AAPL ShortWe can observe that price has recently rallied into a higher timeframe premium zone, which acts as a potential supply area where institutional traders may look to offload positions. The reaction from this zone aligns with the idea that aggressive buying into premium areas can attract counter-order flow.
After this strong impulsive move upward, price tapped into the higher timeframe sell zone and appears to be rejecting it, forming a short-term shift in momentum. The marked arrow suggests a potential short scenario, targeting a reversion to the nearby inefficiency and resting liquidity just below the recent breakout structure.
The green highlighted area shows a logical draw on liquidity where sell-side liquidity may be resting. This is where price is expected to seek out stop orders from late buyers who entered at the top.
Liquidity Perspective:
Notice how previous swing lows and highs provide clear liquidity pools for price to manipulate. Price behavior around these levels often indicates the intention of larger players to grab liquidity before moving in the opposite direction.
Risk Management:
As always, traders should manage risk appropriately by defining clear invalidation levels and never risking more than a small percentage of their capital per trade. Proper risk-to-reward planning ensures sustainability and discipline when executing this strategy.

Datadog's S&P 500 Entry: A New Tech Paradigm?Datadog (DDOG), a leading cloud observability platform, recently marked a significant milestone with its inclusion in the S&P 500 index. This pivotal announcement, made on July 2, 2025, confirmed Datadog's replacement of Juniper Networks (JNPR), effective before the opening of trading on Wednesday, July 9. The unscheduled change followed Hewlett-Packard Enterprise Co.'s (HPE) completion of its acquisition of Juniper Networks on the same day. The market reacted robustly, with Datadog shares surging by approximately 9.40% in extended trading following the news, reaching a five-month high and underscoring the anticipated "index effect" from passive fund inflows. Datadog's market capitalization, approximately $46.63 billion as of July 2, 2025, significantly exceeded the updated S&P 500 minimum threshold of $22.7 billion, effective July 1, 2025.
Datadog's financial performance further solidifies its position. The company reported $762 million in revenue and $24.6 million in GAAP net income for the first quarter of 2025. For the full year 2024, Datadog generated $2.68 billion in revenue. While the document suggested a cloud observability market valued at "over $10 billion," independent verification from sources like Mordor Intelligence indicates the "observability platform market" was valued at approximately $2.9 billion in 2025, projected to grow at a Compound Annual Growth Rate (CAGR) of 15.9% to reach $6.1 billion by 2030. Other analyses, like Market Research Future, project the "Full-Stack Observability Services Market" to be $8.56 billion in 2025 with a higher CAGR of 22.37% through 2034, highlighting varying market definitions. Datadog operates within a competitive landscape, facing rivals such as Elastic and cloud giants like Amazon and Microsoft, alongside Cisco, which completed its acquisition of Splunk on March 18, 2024.
The S&P committee's decision to include Datadog, despite other companies like AppLovin boasting a higher market capitalization of $114.65 billion (as of July 2, 2025), underscores a strategic preference for foundational enterprise technology addressing critical infrastructure needs. This move signals an evolving S&P 500 that increasingly reflects software-defined infrastructure management and analytics as a core economic driver, moving beyond traditional hardware or consumer-facing software. While Workday's inclusion was cited as occurring in 2012 in the original document, it was added to the S&P 500 effective December 23, 2024, preceding its significant growth in the enterprise SaaS sector. Datadog's ascension thus serves as a powerful signal of the technological segments achieving critical mass and institutional validation, guiding future investment and strategic planning in the enterprise technology landscape.

$AMZN - support at $218.63 . next level at $225AMZN - Stock holding support on the trendline. Stock is also holding flat top support at $218.56. With prime day coming soon, we can see a spike towards to $225 and $230 . decent call flow coming in.

$PLTR - support bounce at $130PLTR - Stock testing bottom of the channel on the daily time frame. Stock has held that support level trice. on high watch if we see a bounce here. Calls above $135 looking good . Stock is decent at the indicator level.

Waiting for a pullbackI have sold an get some gains but still thinking that NASDAQ:RGTI will fly sooner
At this moment, just watching and waiting for a pullback to enter again at $12 level

7/2/25 - $exod - A buy probs but non obvi yet7/2/25 :: VROCKSTAR :: AMEX:EXOD
A buy probs but non obvi yet
- solid 20s+ % top line growth
- excellent EBITDA mgns in the 30s and growing
- mid 20s PE "good", esp when you back out the 200 mm or so they have in BTC and net cash... that puts you closer to high teens... "great" actually
- but stock not catching a bid in this euphoria
- perhaps this one is just not as well known
- stock "should" work as a catchup to beta should btc continue to run, but if we undergo a dip here and this is a weaker link (they "did" just miss recent results)... i'd probably make this a small spot to do more work
- keep it on your radar, probs a buy here <$30... but i'd love to own it in the mid to low $20s if/do we get there
V

Crypto Mining CIFR LongWe are at last major resistance here at 4 bucks before possible push towards and above 6$
Any pullback between 3.8 - 4 represents a lucrative risk to reward
Entering half position here and rest below 4$
TP1 5.06
TP2 6.06
SL 3.24

Short Trade Idea: AVAV (NASDAQ: AVAV)🧠📅 Timeframe: 30-Minute
📉 Type: Short Position
📐 Setup: Bearish channel breakdown + retest rejection
📍 Trade Details:
Entry: $246.24 (breakdown + retest of falling wedge)
Stop Loss: ~$253.29 (above recent resistance)
Target 1: $236.58 (previous support / minor zone)
Target 2: $230.00 (horizontal support)
Target 3: $224.85 (major green zone / measured move)
🔎 Technical Breakdown:
Price rejected upper wedge resistance after a failed attempt to recover
Bearish momentum building after lower highs and consistent selling pressure
Clean structure with declining volume during bounce — bearish signal
Retest rejection makes it ideal for continuation downside play
🎯 Risk/Reward Outlook:
Tight stop (~$7) with downside potential of ~$20
RR Ratio: 2.5 to 3:1

Long Trade Idea: KKR NYSE: KKR🧠
📅 Timeframe: 30-Minute
📈 Type: Long Position
📐 Setup: Breakout from descending triangle + bullish trend continuation
📍 Trade Details:
Entry: $134.62 (confirmed breakout candle above resistance zone)
Stop Loss: ~$133.90 (below breakout structure)
Target 1: $135.38 (minor resistance)
Target 2: $136.26 (major green zone / profit target)
🔎 Technical Breakdown:
Price has broken out of a tight consolidation triangle
Higher lows forming into resistance, now cleared
Retesting old resistance turned support
Momentum is with the bulls; volume likely increasing near breakout
🎯 Risk/Reward Outlook:
Clean breakout entry
Risk: small downside (~0.70 points)
Reward: ~1.5–2 points (RR > 2:1)

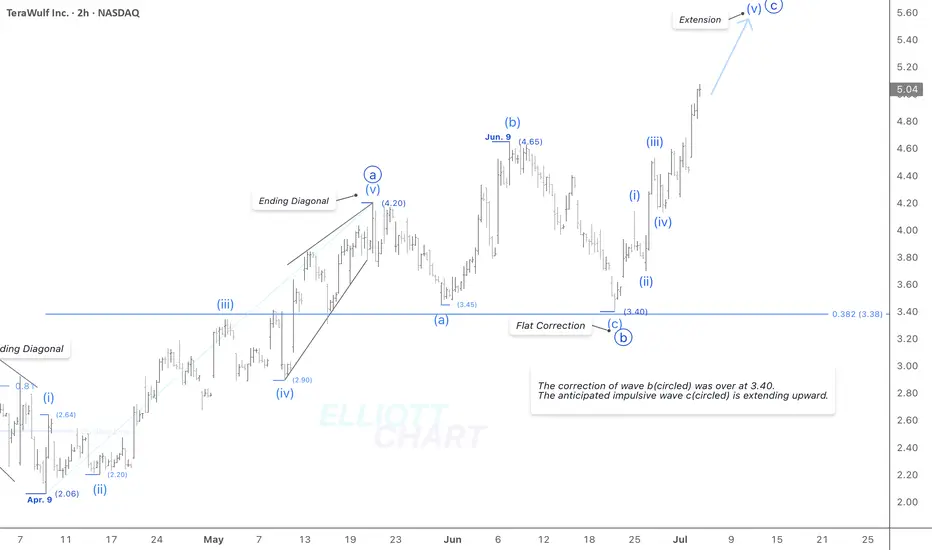
WULF / 2hAccording to the prior analysis, NASDAQ:WULF has risen by 13.5% today.
Wave Analysis >> The ongoing impulsive wave c(circled) seems to be extending in its fifth wave.
Trend Analysis >> The Minor degree trend is up now in an impulsive wave c(circled).
#CryptoStocks #WULF #BTCMining #Bitcoin #BTC
CLSK / 4hAccording to the prior analysis, NASDAQ:CLSK continued to advance 12.6% today.
Now, 70% of the anticipated rally lies ahead on the ongoing impulsive wave iii(circled).
Trend Analysis >> The Minor degree trend is up, now in an impulsive third wave in Minute degree towards the expected target.
The first Fib extension target >> 20.06
#CryptoStocks #CLSK #BTCMining #Bitcoin #BTC

RIOT / 3hNASDAQ:RIOT has exceeded 12.12, which I'd considered as a validating line at the extreme high of that leading diagonal in my prior analysis. Hence, the leading diagonal as the entire wave (1) is not valid now.
Wave Analysis >> According to this adjusted wave count, wave 1 and 2, i(circled) and ii(circled) all are over, and advance in wave iii(circled) of Minor degree impulsive wave 3 is underway.
#CryptoStocks #RIOT #BTCMining #Bitcoin #BTC

Long $MRK- NYSE:MRK is a quality compounder selling at a discount.
Year | 2025 | 2026 | 2027 | 2028
EPS | 8.90 | 9.72 | 10.65 | 10.38
EPS% | 18.36% | 9.21% | 9.54% | -2.52%
Conservative forward p/e should be 10
Fair Stock value:
EPS | 8.90 | 9.72 | 10.65 | 10.38
Price | 89 | 97 | 106 | 103
Positive Suprises or rotation into healthcare by fund manager would leead to forward p/e of 15
EPS | 8.90 | 9.72 | 10.65 | 10.38
Stock price | 133 | 145 | 159 | 155

NVIDIA: More Room in Wave BNvidia’s strong rally over recent weeks lifted the stock above resistance at $153.13. Despite a brief pullback on Tuesday, we still expect beige wave B to extend toward $178.39. Afterward, beige wave C should initiate a substantial correction, likely finding its low above $81.98 to complete blue wave (IV). If Nvidia rallies directly through $178.39, that would support our alternative view that blue wave alt.(IV) has already bottomed (37% probability).
📈 Over 190 precise analyses, clear entry points, and defined Target Zones - that's what we do.

$CLF-Support: $5.97 (must hold for bullish case).
-Breakout Signal: Close above descending trendline + 20 MA.
-Target: $6.50+ (confirmed breakout).
-Watch: Volume surge & MA crossover for confirmation.
-Risk: Below $5.97 invalidates setup.
NYSE:CLF refers to Cleveland-Cliffs Inc., a major American iron ore and steel producer. NYSE:CLF

