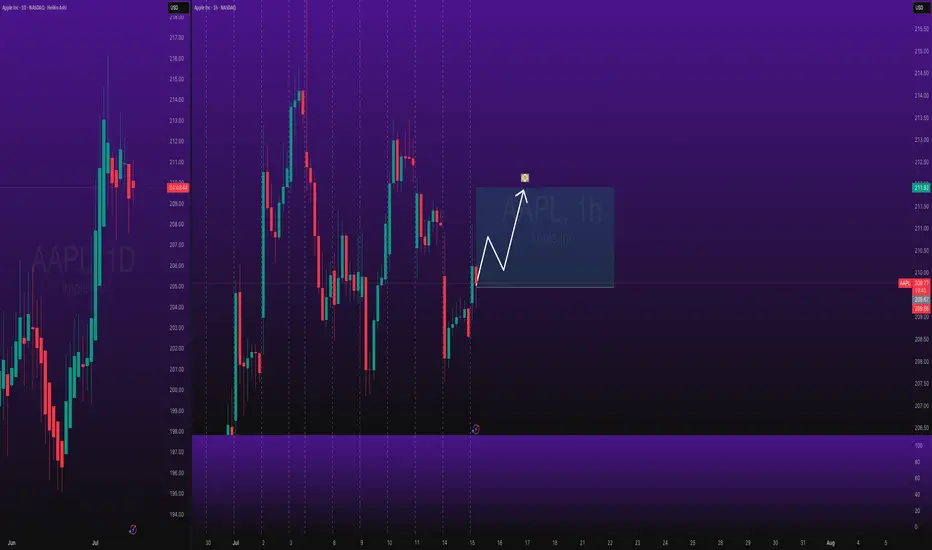
Stocks SPOT ACCOUNT: APPLE stocks Buy Trade with Take ProfitStocks SPOT ACCOUNT:
MARKETSCOM:APPLE stocks my buy trade with take profit.
This is my SPOT Accounts for Stocks Portfolio.
Trade shows my Buying and Take Profit Level.
Spot account doesn't need SL because its stocks buying account.
Looks good Trade.
Disclaimer: only idea, not advice
Cup and handle formation. The handle is currently being completeCup and handle formation. The handle is currently being completed.
The support level is at 1.60

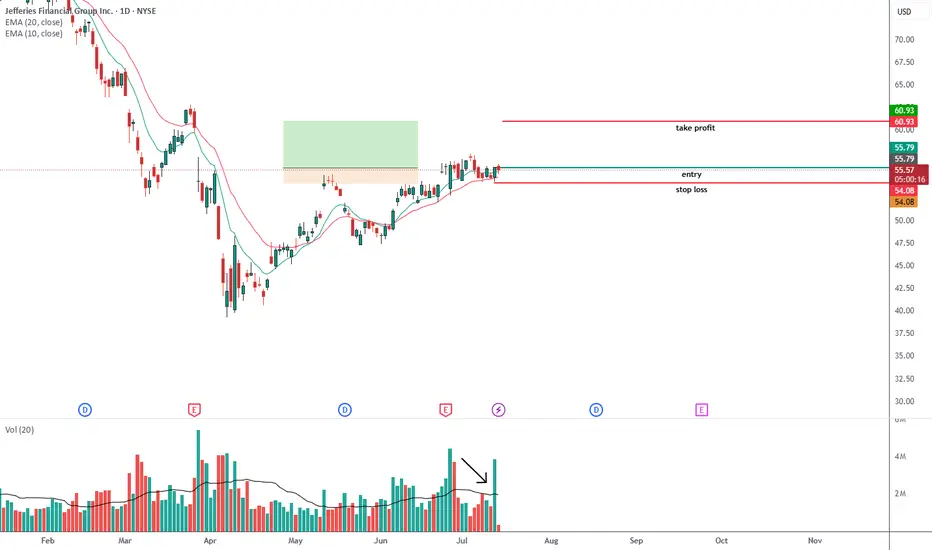
Jef -- possible swing trade opportunityJef -- possible swing trade opportunity based on price action and volume patterns
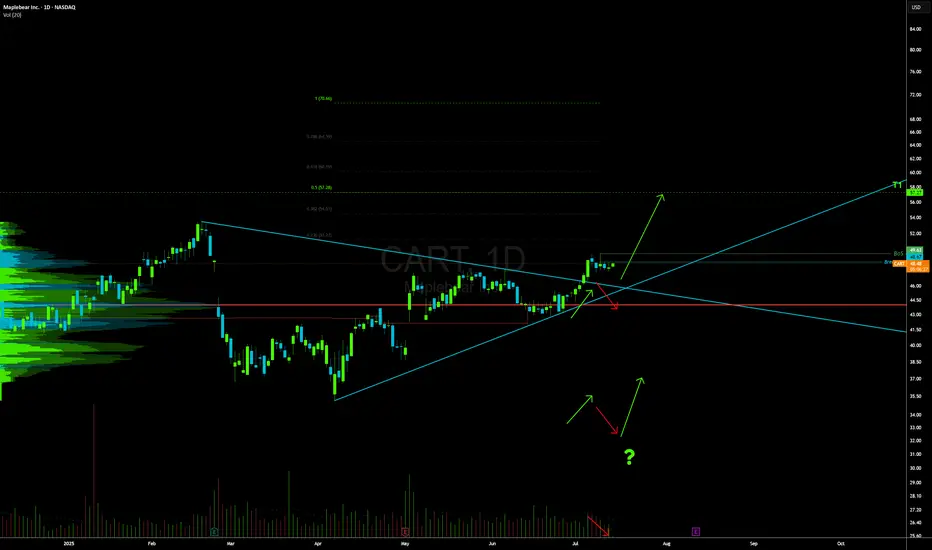
CART LONG
Strong Profits
The company makes solid money on what it sells. It keeps a high percentage of revenue as profit, with strong margins all around. It also generates good returns from the money it invests.
No Debt, Plenty of Cash
The company has almost no debt and a strong cash position. It has more than enough to cover short-term needs and stay financially stable.
Earnings Are Growing
Earnings more than doubled over the last year and are expected to grow again next year. Big investors like mutual funds and institutions are buying more of the stock, which is a good sign.
Business Has an Edge
The company has very high profit margins, which suggests it has pricing power or a business model that’s hard to compete with.
HIGH INSTITUTIONAL OWNERSHIP 66.15%
-Broke Out of a Wedge
The stock recently broke out of a wedge pattern, which often means it's ready to move higher.
-Pulling Back Gently
After the breakout, the stock is easing back on light trading volume INTO THE 8ema. That usually means sellers aren't too aggressive and a move higher could be coming.
Looking Toward the Mid-Fifties
Based on the current setup, the stock looks like it could climb to around 57 if momentum holds up.
-Momentum is Positive
The stock is trending above its key moving averages and has gained a lot over the past year. The trend is still strong.
15 near term?NYSE:ACHR has been consolidating very well in this range, and today we saw a very strong candle with a lot of volume. This can be used as confirmation that it's breaking out of this channel to move higher. My first target is 12.48, then the ATH. After that, we should quickly reach the 14.5-15.8 range.

KALV FDA approval rallyKALV received FDA approval this week for a new drug, has $220mln in cash, and just bounced off the daily 21EMA (overlayed on this 4H chart).
Recently rejected off the monthly 100ema two times (overlayed on this 4H chart). Breakout beyond the monthly 100ema and first target is $20. Numerous price target increases, most notably, one at $27 and another increased from $32 to $40.

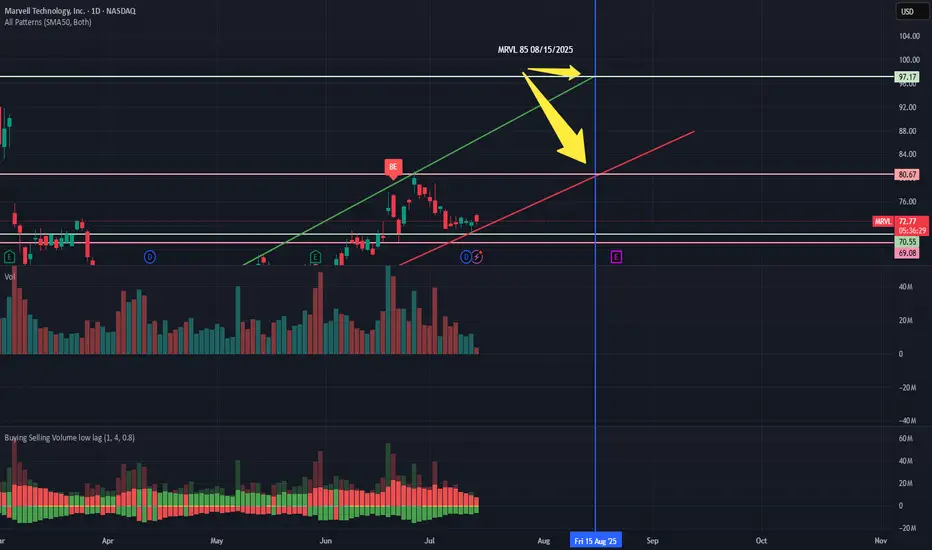
MRVL Trading Idea For Q2 EarningsNFA
I bought a few contracts for Call options for MRVL 08/15/2025 85 C last week.
Let's see how it plays out up to the earnings announcement and a few days beyond. :)
GLTA
Rackspace Technology inc Stock in Triggering level 💯 , 1st Target prices zone between 2.88$ - 3.03$
Stock on Inverted Head and Shoulders pattern at the bottom, And Target prices zone between 5.02$ - 5.76$ ( Resistance level).
Highly recommended for Buy 👌

Time for Lucid Group Inc. (LCID) – Short-Term Bullish --3.50 USDLucid Group Inc. (LCID) on the 4-hour chart is showing a moderately bullish structure, suggesting potential for continued short-term upside. After a period of consolidation and base-building, the price has broken above key moving averages (MA5, MA10, and MA30), which are now turning upward and beginning to act as dynamic support. This shift indicates improving technical sentiment. The nearest resistance is around the $3.08 level — a zone defined by previous swing highs. A confirmed breakout above this level could pave the way toward the next target around $3.50, which represents both a psychological threshold and a former supply zone.
Supporting this bullish outlook, momentum indicators (likely WaveTrend or Stochastic RSI) are signaling continued upside pressure without yet showing strong overbought conditions. However, caution is warranted: if the price gets rejected at the $3.08 resistance, a pullback toward the $2.70–$2.75 support area is possible. Holding that support would be crucial for maintaining the current higher-low structure. Overall, the technical setup favors a move toward $3.50, but it requires follow-through from buyers at key resistance levels.
Potential TP : 3.50 USD

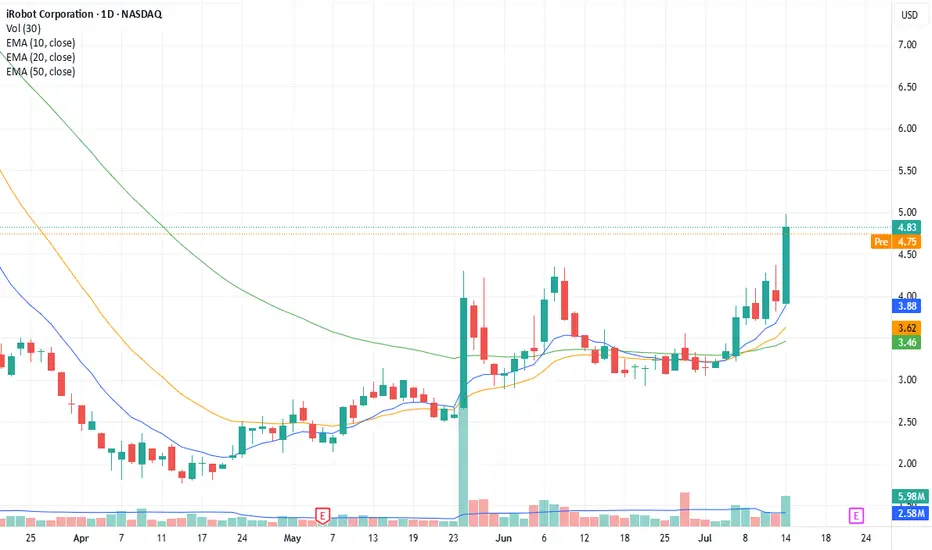
IRBT swing? 1) the uptrend is there
2) breakout already happened, maybe twice now $3.35 and $3.75 maybe ??
3) maybe look to enter at $4 if we comes back
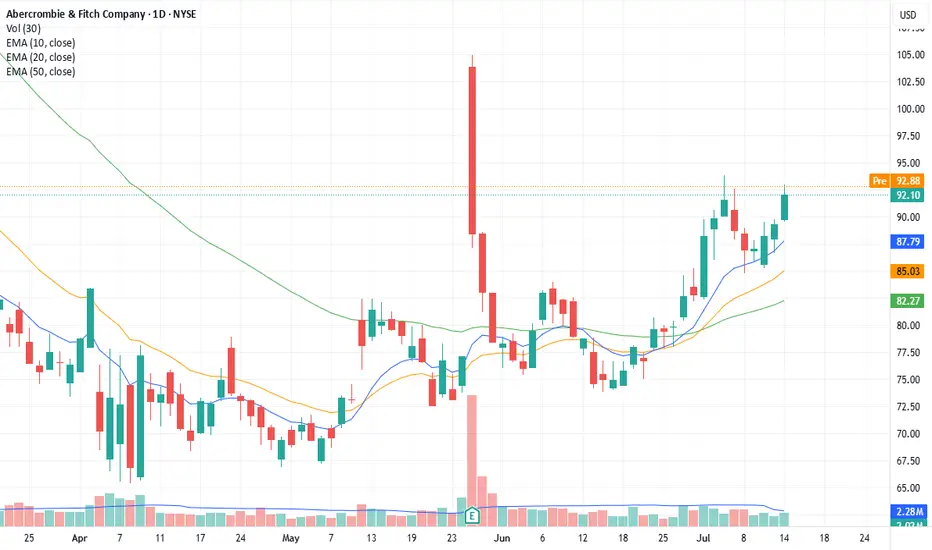
ANF break out1) uptrend since mid june
2) drying of volumes
3) breaking through the $92.10 line
4) entry $92, stop loss at $89.50
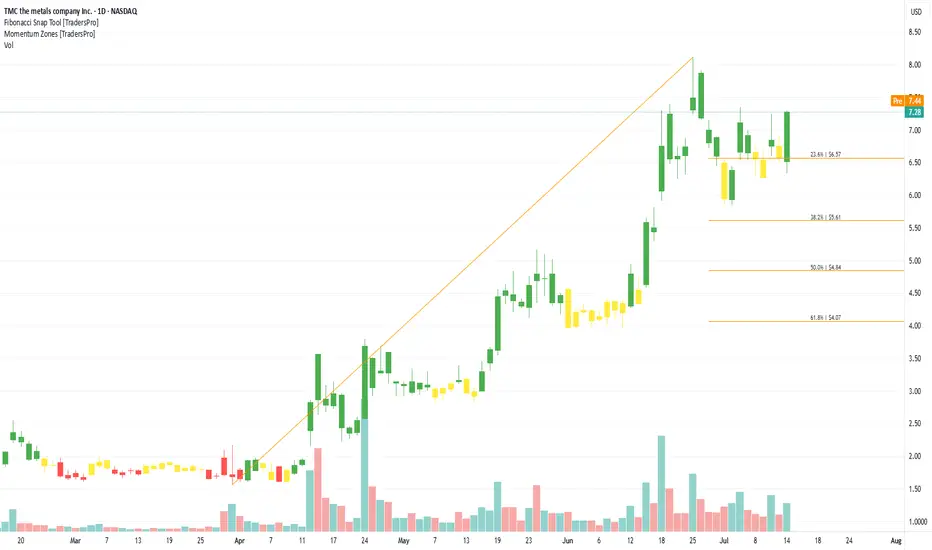
TMC the metals company Inc. (TMC) Mines Ocean NodulesTMC the metals company Inc. (TMC) is developing deep-sea mining solutions to source key battery metals like nickel, cobalt, copper, and manganese from polymetallic nodules found on the ocean floor. These metals are critical for electric vehicles and clean energy storage. TMC’s growth is driven by the rising demand for sustainable battery materials, global EV adoption, and the need to diversify away from traditional, land-based mining operations.
On the chart, a confirmation bar with increasing volume shows strong momentum. The price has entered the momentum zone by breaking above the .236 Fibonacci level. Traders can use the Fibonacci snap tool to set a trailing stop just below that level to protect gains while allowing for additional upside potential.
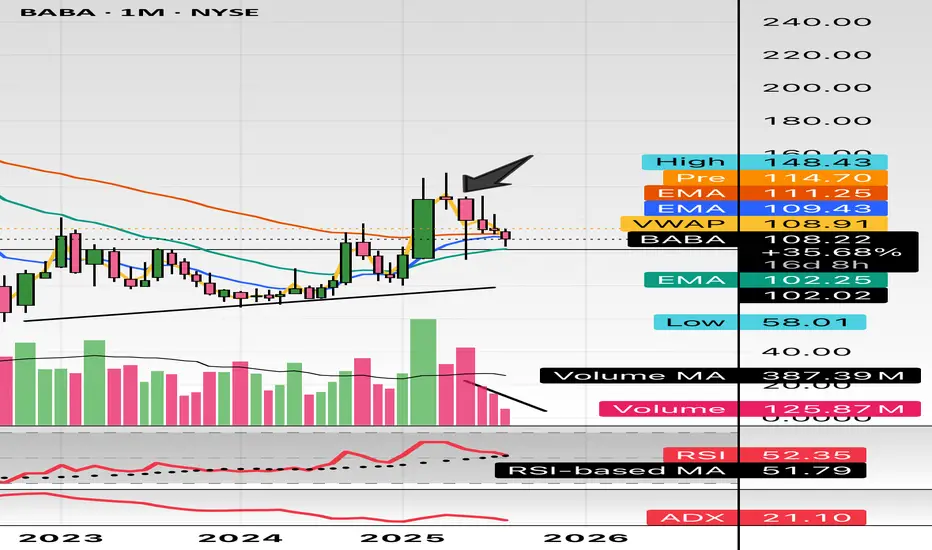
$BABA don’t miss this milky bottle. Called this out at $105 in minds. This Monthly declining volume, support at $100, and uptrend pattern. China will boom into the end of Q3 and early 2026. Target is $180 and $200.
WSL.
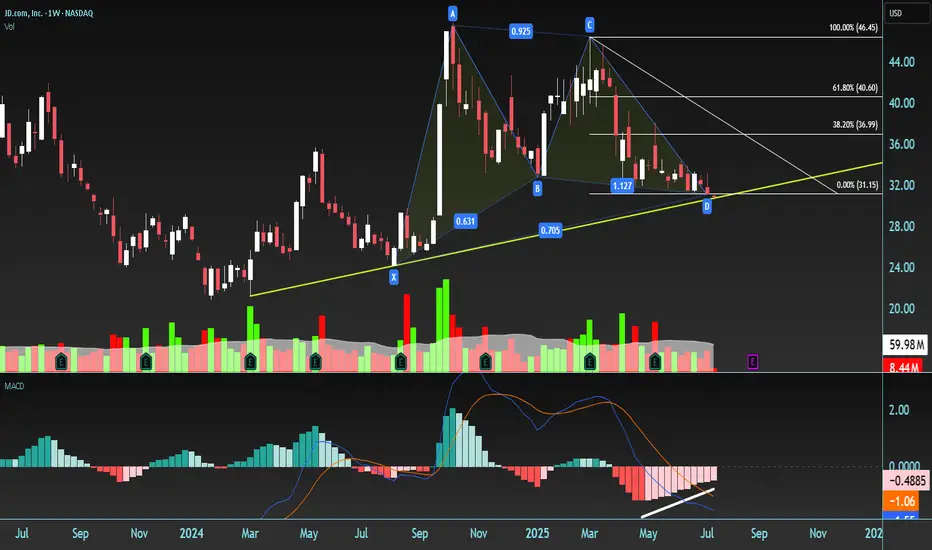
Bullish Gartley Pattern – Trade Setup on JD.comPotential Bullish Gartley pattern has formed with the following structure: XABCD.
initial low X = 23.45 , Price rallies to point A, then forms a corrective structure down to
D = 30.71 trough BCD. CD leg is downward, completing the pattern.
Despite the decline, point D is higher than X, suggesting a bullish setup. The area around D (30.71) is identified as a Potential Reversal Zone (PRZ).
Confluences Supporting a Long Entry
1. Gartley Completion at PRZ
Point D lies near the 78.6% Fibonacci retracement of the XA leg — a typical Gartley completion level.
2. Rising Support Trend Line
D is aligned with a yellow ascending trend line, reinforcing it as a potential bounce area.
3. MACD Bullish Divergence
Price makes a lower low into D, while MACD forms a higher low, signaling bullish momentum divergence.
Trade Plan
* Enter long after confirmation via a strong bullish candle*(e.g., bullish engulfing, hammer)
* Preferably accompanied by above-average volume
Stop Loss:
* Place stop just below point D (30.71)
* Allow a small buffer (e.g., 1–2% below) to account for noise
Targets – Fibonacci Retracement of CD Leg:
1. Target 1 – 38.2%
2. Target 2 – 61.8%
3. Target 3 – 78.6%
4. Target 4 – 100% (full retracement of CD)
Risk Management:
* Use appropriate position sizing (e.g., risk only 1–2% of total capital)
* Consider trailing the stop as targets are hit to lock in profits
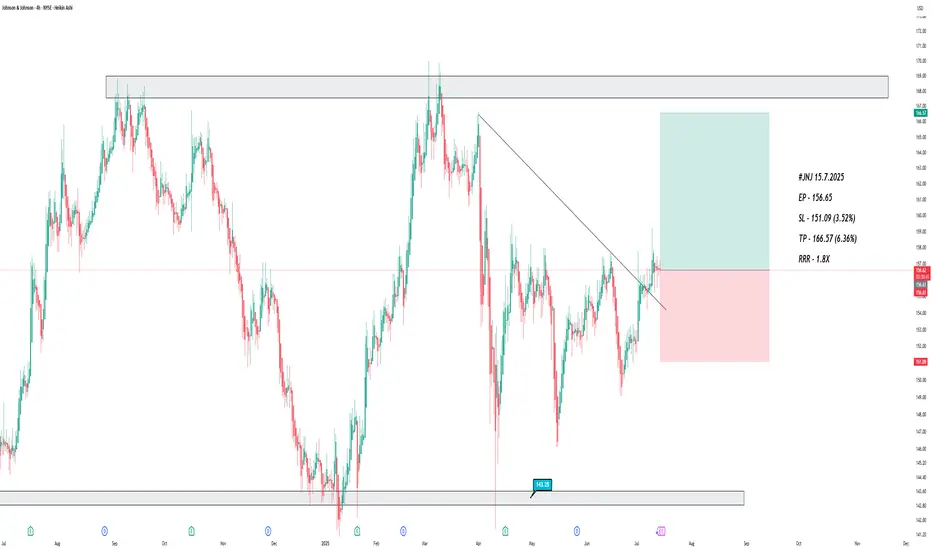
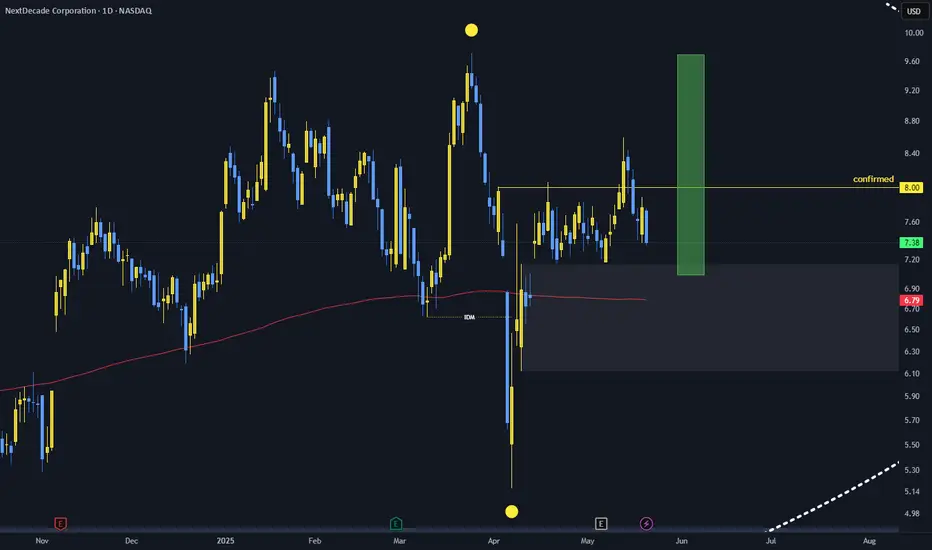
Bullishpossible entry covering the green rectangle.
i see a new high but price do whatever it likes and may fail. so, as usual it's NOT a financial advice.
I share my thoughts, hope to hear from you. Auf Wiedersehen!
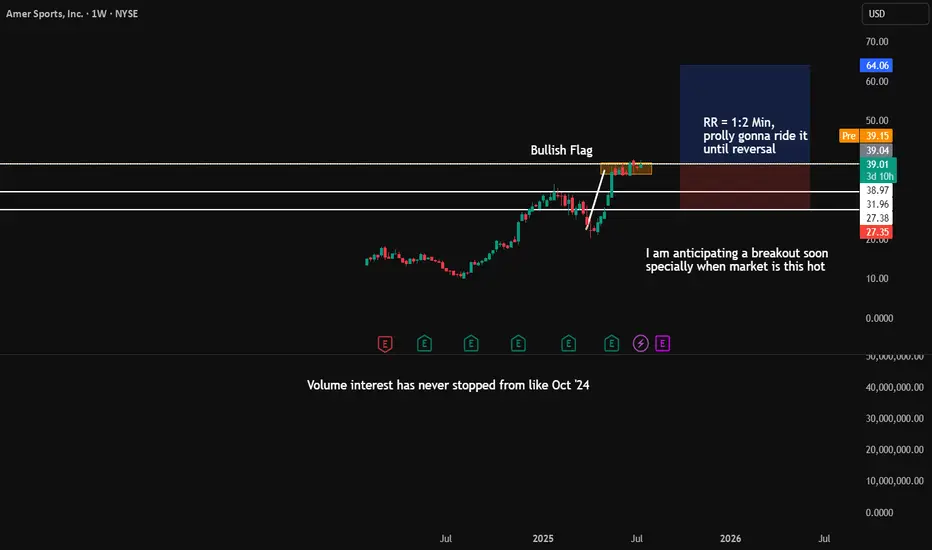
AS breakout anticipationThis company has regularly beaten the estimates.
The Fundamental trajectory is in uptrend.
What I love about this kind of stock is there is constant above average volume, the volume interest is keeping on rising from Oct '24. For me Bullish flag breakout is what's going to happen sooner or later.
Well pullback to $38.97 is possible, but with good risk management it will be easy for me to risk some for the potential huge breakout that I am anticipating.
QuickView : AKAMOn the daily Chart the price is trying to make a move higher without success. Bears are still in control and a new bearish crossover is coming.

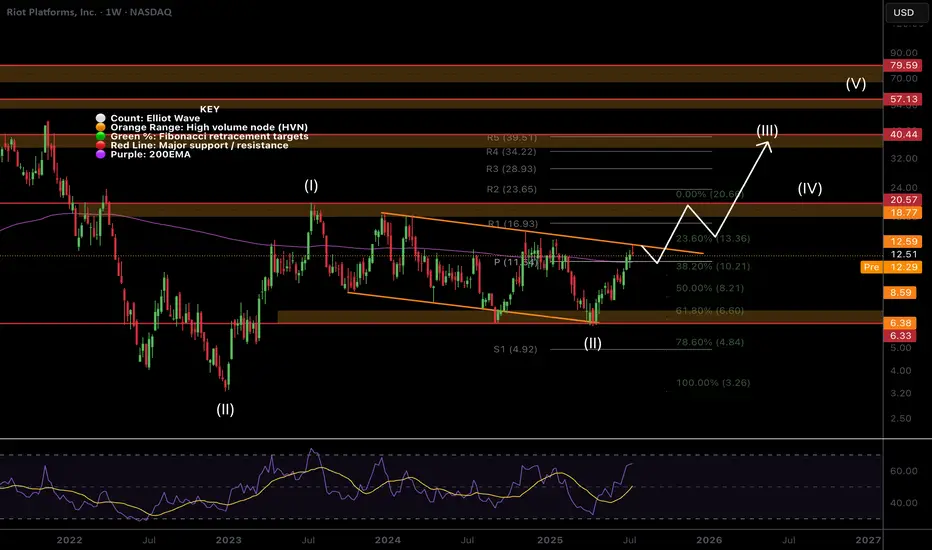
$RIOT Hit The Target Whats Next?NASDAQ:RIOT hit the descending orange resistance were I took partial take profits on my trade this week and it was immediately rejected as expected.
Price is now above the weekly pivot so that is the next support. This level also matches the weekly 200EMA.
Wave (II) hit the 'alt-coin' golden pocket of 0.618-0.786 Fibonacci retracement at the High Volume Node (HVN) support and descending support line which kicked off wave (III).
A breakout above the descending resistance line bring up the the next target of the HVN and previous swing high at $18-20 and $40 following a breakout above that.
Safe trading
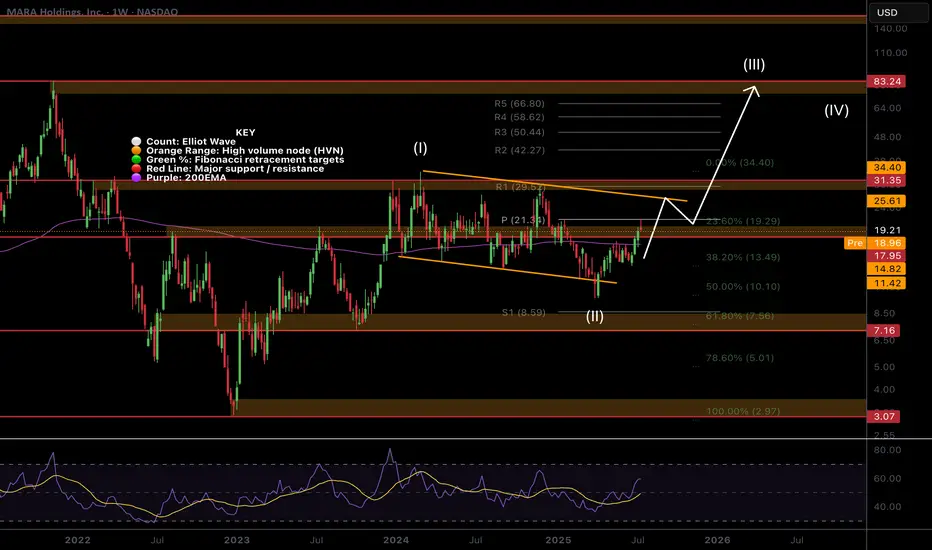
$MARA Hits the Weekly PivotNASDAQ:MARA path has been grinding higher clearing the High Volume Node (HVN) resistance where it is sat as support.
The weekly pivot rejected price perfectly so far but if the count is correct and Bitcoin doesn't dump I expect this continue strongly towards the descending orange line resistance as my partial take profit target.
Once that line is broken i am looking at terminal bull market targets of $80 but will of course take profit at key areas along the way.
Wave 2 swung below the descending support and recovered at 0.5 Fibonacci retracement potentially kicking off wave 3.
Safe trading
YEXT 1W - breakout confirmed, retest inside bullish channelYext stock just pulled a clean breakout of the weekly downtrend line, retested the buy zone around the 0.5 Fibo level ($7.32), and is now bouncing within a rising channel. The 200MA and 50EMA are both below price, supporting a shift in trend even though the golden cross hasn’t formed yet. The volume increased on breakout, and there's low overhead supply - a classic setup for continuation. The arrow shows the expected move, contingent on confirmation.
Targets: 9.15 - 11.40 - 15.06
Fundamentally, Yext offers enterprise-grade AI-powered search solutions and recently gained attention with new product updates. With AI adoption accelerating, the company may ride the next wave of institutional interest.
When price retests the zone, MA is supportive, and there's no overhead resistance - that’s not noise, that’s a signal.

$HUT Clear for Further Upside?NASDAQ:HUT is having a great time clearing resistances, the weekly 200EMA and the weekly Pivot point did not prove challenging.
It is currently sitting in a High Volume Node (HVN) where price is likely to reject and retest the weekly pivot as support before continuing upwards towards $32 and beyond in wave 3.
Wave 2 tested the 'alt-coin' golden pocket between 0.618-0.782 Fibonacci retracement giving me confidence in the count.
Safe trading
