$HUT Clear for Further Upside?NASDAQ:HUT is having a great time clearing resistances, the weekly 200EMA and the weekly Pivot point did not prove challenging.
It is currently sitting in a High Volume Node (HVN) where price is likely to reject and retest the weekly pivot as support before continuing upwards towards $32 and beyond in wave 3.
Wave 2 tested the 'alt-coin' golden pocket between 0.618-0.782 Fibonacci retracement giving me confidence in the count.
Safe trading

Quick View: $AZN- On the daily Chart the price is testing now the lower side of the channel with a new bullish crossover and positive price action. Looks like there is a great chance for a new entry here

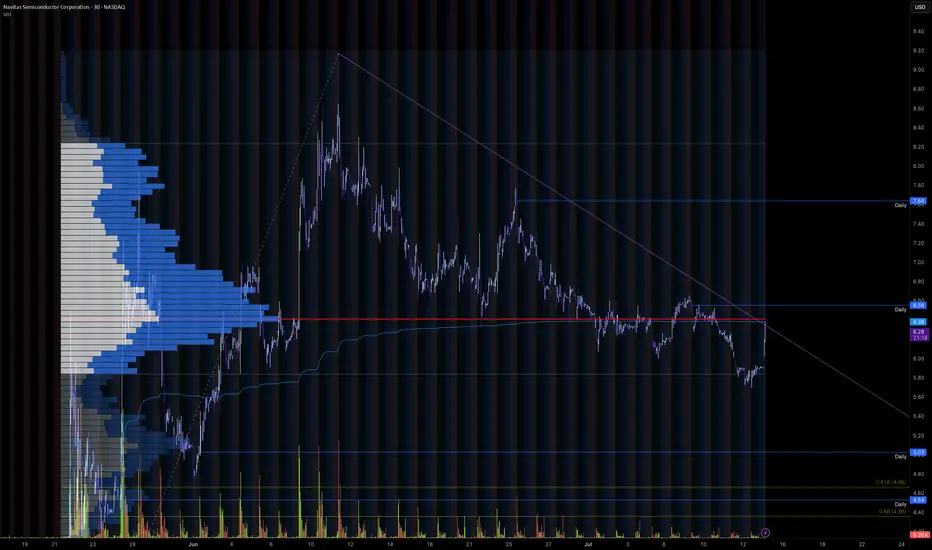
Trendline Breakout for Wave 3Navitas is currently looking at breaking out of its recent downtrend to potentially begin wave 3 of its move up, which, as we all know, is the most impulsive move.
Could be very tasty after a 350% pump already
Need to get above the range POC and breakout of the trend line, would be looking to get in on the retest of the downtrend line.
$CLSK Trapped between Critical Resistance and Support?NASDAQ:CLSK Shot through the weekly 200EMA and hit the weekly pivot resistance and was rejected into the High Volume Node (HVN) just below.
If the count is correct we should see price breakthrough in wave 3 after some consolidation and continue up after wave 2 tested the .618 Fibonacci retracement and HVN as support.
Heavy resistance HVN coupled with the R1 pivot at $20.40 will prove another challenge to overcome. Ultimately, if the count is correct AND Bitcoin doesn't tank we can expect a challenge of the all time highs up at $60.
I already closed partial take profit myself at the weekly pivot on a recent trade and will be looking to go long again to the those targets. Make sure to always be taking profits on the way as nobody has a Crystal ball!
RSI is currently printing a bearish divergence on the weekly so we need to see that negated.
Analysis is invalidated below $6.
Safe trading
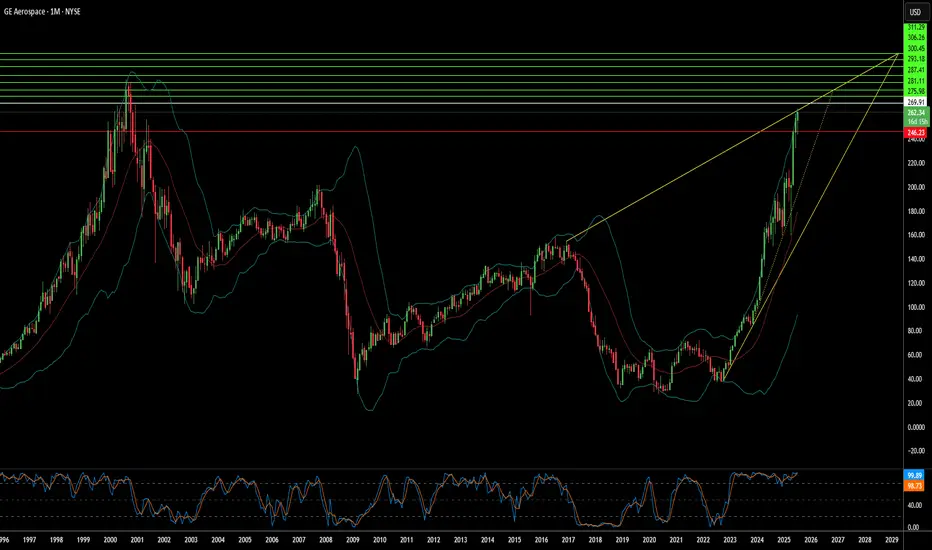
Soaring High: What Fuels GE Aerospace's Ascent?GE Aerospace's remarkable rise reflects a confluence of strategic maneuvers and favorable market dynamics. The company maintains a dominant position in the commercial and military aircraft engine markets, powering over 60% of the global narrowbody fleet through its CFM International joint venture and proprietary platforms. This market leadership, coupled with formidable barriers to entry and significant switching costs in the aircraft engine industry, secures a robust competitive advantage. Furthermore, a highly profitable aftermarket business, driven by long-term maintenance contracts and an expanding installed engine base, provides a resilient, recurring revenue stream. This lucrative segment buffers the company against cyclicality and ensures consistent earnings visibility.
Macroeconomic tailwinds also play a crucial role in GE Aerospace's sustained growth. Global air travel is steadily increasing, driving higher aircraft utilization rates. This directly translates to greater demand for new engines and, more importantly, consistent aftermarket servicing, which is a core profit driver for GE Aerospace. Management, under CEO Larry Culp, has also strategically navigated external challenges. They localized supply chains, secured alternate component sources, and optimized logistics costs. These actions proved critical in mitigating the impact of new tariff regimes and broader trade war tensions.
Geopolitical developments have significantly shaped GE Aerospace's trajectory. Notably, the U.S. government's decision to lift restrictions on exporting aircraft engines, including LEAP-1C and GE CF34 engines, to China's Commercial Aircraft Corporation of China (COMAC) reopened a vital market channel. This move, occurring amidst a complex U.S.-China trade environment, underscores the strategic importance of GE Aerospace's technology on the global stage. The company's robust financial performance further solidifies its position, with strong earnings beats, a healthy return on equity, and positive outlooks from a majority of Wall Street analysts. Institutional investors are actively increasing their stakes, signaling strong market confidence in GE Aerospace's continued growth potential.
3 Reasons Why Cisco Stock Is Ready to Rocket (Bonus Strategy)3 Reasons Why Cisco Stock Is Ready to Rocket (Bonus Strategy Inside)
Cisco is flashing bullish signs from candlesticks to volume. Here's why a breakout could be imminent — with a bonus momentum strategy revealed.
---
Cisco Systems ( NASDAQ:CSCO ) is showing signs of a potential breakout — and savvy traders should take notice. Here’s why this tech giant is gathering bullish momentum across multiple signals:
1️⃣ Long Lower Shadow Candlestick Pattern
A long lower shadow on the recent candle suggests strong rejection of lower prices. This shows that buyers stepped in
aggressively after an intraday dip — a classic bullish reversal sign that often marks the end of a pullback phase.
2️⃣ Volume Oscillator Below Zero
The volume oscillator dipping below zero may seem bearish at
first, but in context, it shows a decline in selling pressure. When paired with other bullish indicators, this can signal the calm
before a strong move upward — especially if bulls take control on the next candle.
3️⃣ High Volume on the 4H Time Frame
Volume doesn’t lie — and it’s surging on the 4-hour chart. This spike in volume at key support levels adds strong confirmation
that institutional players may be stepping in. When volume rises while price action forms reversal candles, it increases the
probability of a sustained upward move.
---
🚀 Bonus Reason: The Rocket Booster Strategy is in Play
Cisco is also aligning with the Rocket Booster Strategy, which requires:
Price trading above the 50 EMA
Price trading above the 200 EMA
A recent gap up confirmed by Parabolic SAR
Strong supporting volume
This strategy acts like ignition for high-momentum trades — and Cisco looks ready for lift-off.
---
📌 Conclusion:
With technicals aligning and volume building, Cisco could be gearing up for a breakout. Traders should keep an eye on confirmation candles and volume spikes to validate the next leg upward.
---
📉 Disclaimer: Trading involves risk. Always conduct your own research and consult a financial advisor before investing.
---

Not too bullish, but one to watch for break outThis trade is still in the consolidation phase, but has a potential break out with volume. Wanting to see price get above $13, before adding more to this position.
For the time being, watch and look for volume and consolidation.
NSE IONQ - Are we ready for a breakout?The corrective phase is complete and an impulse move appears likely. A strong buy above the A-B-C channel could target levels around 30 - 37 - 45 or higher. Good entry is possible above 26. However, if conditions worsen, further corrections may ensue.
I will update further information soon.

RGTI Heading to $17+ Good evening trading family
So currently due to price action it appears we are on our way to 17 dollar target however we expect a little bit of a correction at the 15 range.
However worst scenario if we go below 11 dollars be prepared for a sinker down to 8.
Trade Smarter Live Better
Kris/ Mindbloome Exchange

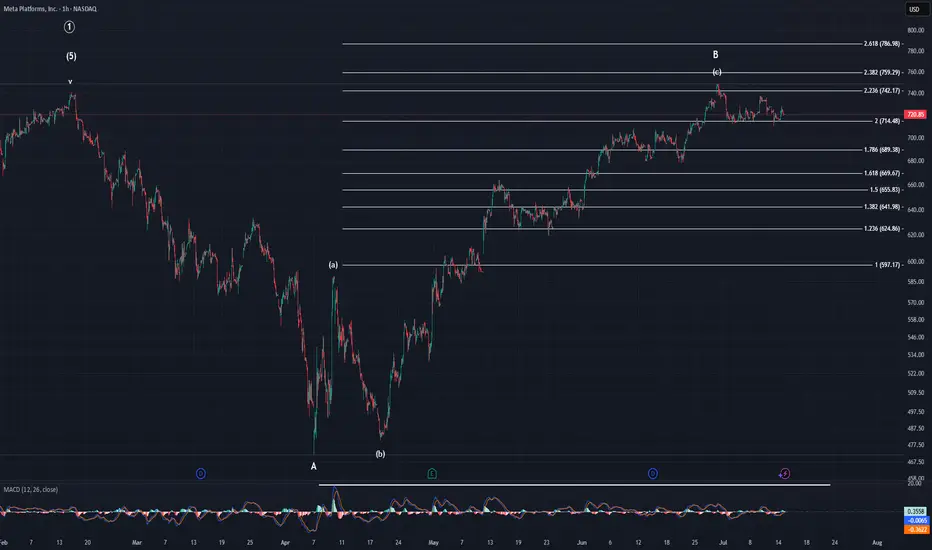
MetaSince the last post I made price has yet to make a new high. It has managed to chop in this area with a slight downward bias. If we're on the verge of the top of the indices, there is no reason to think Meta will continue higher much longer. This pattern, which is clearly corrective in nature, is way overextended. We started off with a 3-wave move higher off the April low and have risen all the way to the 2.236. Even if you could somehow say this is impulsive, it would still be over extended. So, no matter how you look at this pattern, it is in need of a correction. The question is how will that correction look. IMO, it will look like a minor C wave of intermediate (A). However, if it is somehow impulsive, then it would look like either minor A just now starting, or a smaller degree wave 2.
MSFT watch $392.76-394.12: Key Resistance to Tariff RecoveryMSFT testing a well proven Resistance zone $392.76-394.12
This zone rejected twice already, now may be ready to break?
Fib reactions have been precise, so look for Break-n-Retest

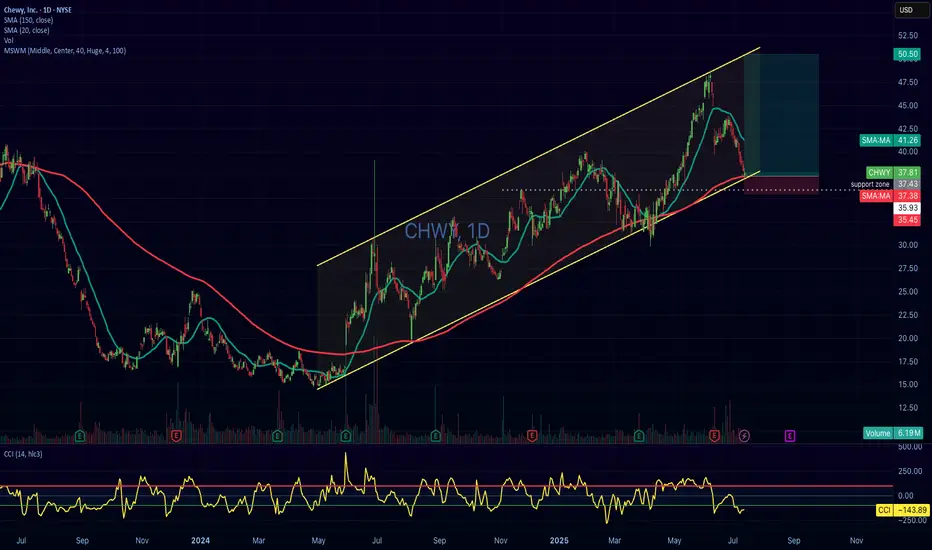
CHWY Long – Swing from 150 SMA Support with Oversold CCI and GapNYSE:CHWY
📅 Entry: July 15, 2025
📉 Price: 37.80
✋ Stop: 35.82
🎯 Target: 50.87
⚖️ Risk-Reward: 1:6.6
✅ Status: Active
🧠 Trade Idea:
CHWY is testing the lower bound of a well-defined ascending channel, while also bouncing from the 150-day simple moving average (SMA150) — a strong technical support area.
Additional bullish signals include:
The price is significantly stretched below the 20-day SMA, suggesting a potential mean-reversion move.
The Commodity Channel Index (CCI) is deeply oversold (around -143), starting to curl upwards — a classic reversal signal.
There's an open gap above near the $47 level, providing a natural swing target.
📌 This trade aims to capitalize on a high-probability reversal setup, with strong confluence of support, momentum shift, and attractive risk-reward.
#swingtrading #CHWY #technicalanalysis #stocks #tradingview #longsetup #riskreward #CCI
FTNT - Precision Swing Trade Setup📈 Symbol: FTNT (Fortinet)
⌛ Timeframe: Daily Chart
⚡ Strategy: High-Conviction Swing Trade (5-10 days)
🎯 Pinpoint Trade Execution
Entry: $103.00 (Key psychological level + SMA 50 confluence)
Stop-Loss: $95.80 (7% risk, below July swing low)
Take-Profit: $118.16 (14.7% upside, pre-earnings resistance)
Risk-Reward: 1:2.1 (Optimized ratio)
📊 Technical Rationale
✅ Triple Confirmation Setup:
Connors RSI2 Signals: Back-to-back buy triggers (July 10-11)
Volume Surge: 30% above 20-day avg on reversal candle
MACD Flip: Bullish crossover at -2.5 (oversold rebound)
Key Levels:
Defense Line (SL): $95.80 (Protects against false breakout)
Profit Zones:
$110.50 (Partial take-profit at 50% Fib)
$118.16 (Full exit at 61.8% Fib + VWAP resistance)
⚡ Smart Trade Management
1️⃣ Entry: $103.00 limit order
2️⃣ Stop Strategy:
Initial SL: $95.80
Adjust to $101.00 if price hits $108.00
3️⃣ Profit Plan:
Sell 30% at $110.50
Trail remainder with 2-bar low exit
🌐 Fundamental Context
Earnings Date: July 25 (Plan exit before)
Short Interest: 8.5% float (squeeze potential)
Institutional Activity: 13F filings show $200M+ inflows
⚠️ Critical Risk Notes
Sector Risk: Tech volatility (monitor SOXX ETF)
Earnings Gap Risk: July 25 event may override technicals
Alternative Scenario: Invalidated below $95.80 → Wait for retest
#PrecisionTrading #Cybersecurity #RiskReward
👇 Like/Comment if you'd take this trade!
🔔 Follow for institutional-grade setups
(Chart: Daily timeframe with Fib levels + volume profile)

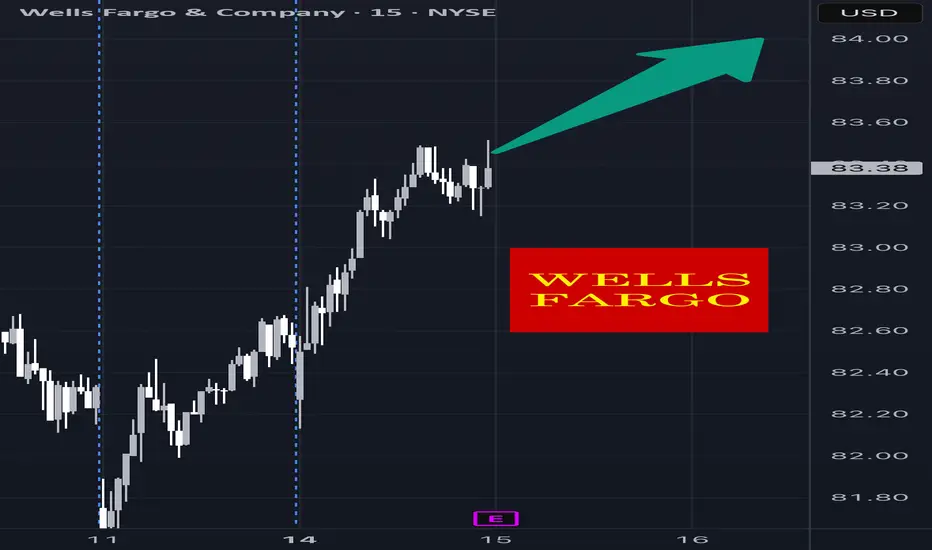
WFC Earnings Setup – 07/14/2025 $86C | Exp. July 18 | Betting on
📈 WFC Earnings Setup – 07/14/2025
$86C | Exp. July 18 | Betting on a Bank Bounce
⸻
🔥 EARNINGS HEAT CHECK
💼 WFC reports BMO (07/15)
📊 Historical move avg: ~3–5%
📍 Current price: $82.53
📈 Above 20D/50D MAs → trend intact
⚠️ RSI = 78.07 = overbought 🚨
💥 Expected move: $2.89
⸻
🧠 SENTIMENT SNAPSHOT
🔄 Call OI stacked at $86
🔻 Put OI focused at $81
⚖️ Balanced flow → slight bullish tilt
🧾 IV is elevated, so IV crush is coming
⸻
🏦 SECTOR SUPPORT
• Financials showing strength 📈
• No major institutional bias
• VIX @ 16.40 → macro calm = earnings-friendly
⸻
🎯 Trade Plan – IV Exploitation Setup
{
"ticker": "WFC",
"type": "CALL",
"strike": 86,
"exp": "2025-07-18",
"entry": 0.81,
"target": 1.62,
"stop": 0.40,
"size": 1,
"confidence": "70%",
"entry_timing": "pre-earnings close"
}
🔹 Call Entry: $0.81
🎯 Profit Target: $1.62 (+100%)
🛑 Stop: $0.40 (-50%)
📅 Expiry: 07/18/25
📆 Earnings Date: 07/14 (BMO)
📈 Expected Move: ~$2.89
🧠 Confidence: 70%
⸻
⚠️ Key Risks
• IV crush = quick decay if WFC doesn’t move
• Guidance could swing the stock either direction fast
• Overbought = short-term pullback risk even on good earnings
✅ Why $86C?
• Just outside expected move
• High OI = liquidity
• Reasonable premium = good risk/reward
⸻
📣 Model Consensus:
“Moderately Bullish” — strong setup but keep it tight around earnings!
Tag your favorite bank stock trader 🏦👇
Who’s playing WFC earnings this quarter?
#WFC #EarningsPlay #OptionsTrading #CallOption #BankingStocks #IVCrush #RiskReward #AITrading #
JPM Breakout in Play – Target $295+
🧠 Chart Analysis Summary:
Pattern: Symmetrical triangle breakout has occurred. Momentum is building.
Current Price: $288.58
Breakout Confirmation: Price closed above resistance trendline (pink), signaling potential bullish move.
📊 Key Levels:
Entry Zone: $288.50–289.00
Resistance/Targets:
Minor Resistance: $291.87 (red line)
Main Target: $295.54 (green line)
Support Zone:
$284.00–285.00 (white zone, strong base)
🎯 Trade Plan (Bullish Setup):
Entry: $288.60
Target: $295.00–295.50
Stop-Loss: Below $284.00

BK Earnings Trade Setup – 07/14/2025 $97.50C | Exp. July 18 | Ri
📈 BK Earnings Trade Setup – 07/14/2025
$97.50C | Exp. July 18 | Riding the Sector Wave
⸻
🔥 BULLISH EARNINGS SETUP
🏦 BK sits at $93.69, just under its 52W high of $95.10
📈 Strong trend + volume rising pre-earnings
📊 RSI = 76.29 → overbought, but could break out on positive earnings
⸻
🧠 Macro + Sector Check
• Financials are strong across the board 🟢
• Analysts bullish on BK 📣
• VIX at 16.40 = market calm = earnings plays viable
⸻
🎯 Earnings Trade Plan – High OI Strike
{
"ticker": "BK",
"type": "CALL",
"strike": 97.50,
"exp": "2025-07-18",
"entry": 0.90,
"target": 1.80,
"stop": 0.45,
"size": 1,
"confidence": "75%",
"entry_timing": "pre-earnings close"
}
🔹 Call Entry: $0.90
🎯 Target: $1.80 (+100%)
🛑 Stop: $0.45
📆 Expiry: 07/18/2025
📈 Expected Move: ~4%
📅 Earnings Date: 07/15 (BMO)
📊 Confidence: 75%
⸻
📌 Why $97.50C?
✅ High OI
✅ Matches expected move
✅ Good leverage near key levels
⸻
⚠️ Risk Note:
• RSI is hot 🔥
• If earnings miss → IV crush hits hard
• Not a diamond-hands trade — manage it tight
⸻
💬 Model Take:
“Moderately Bullish” — everything’s aligned, but keep stops tight due to overbought conditions.
Tag your earnings squad 📢 — BK is in play.
#BK #EarningsPlay #OptionsTrading #CallOption #FinancialSector #BreakoutSetup #

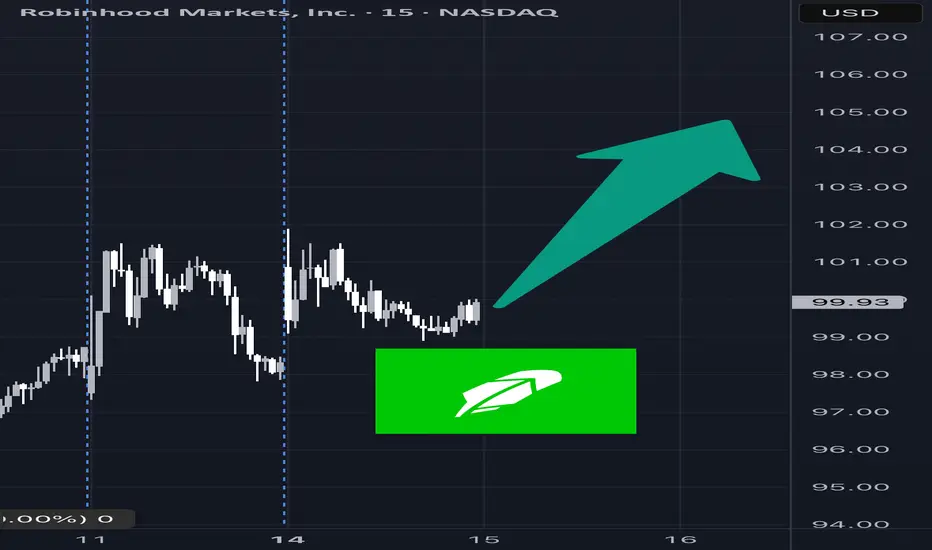
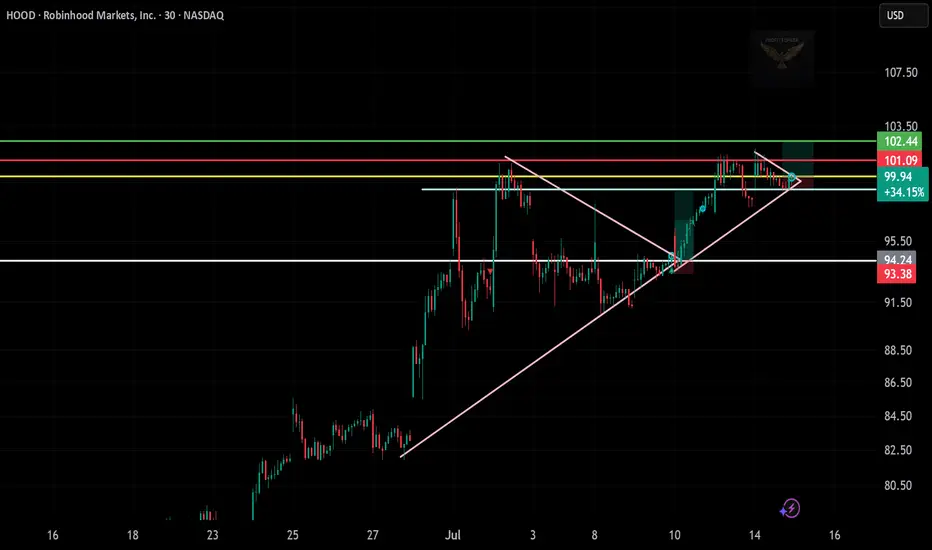
HOOD Breakout Watch – Eyeing $103+
🧠 Chart Breakdown:
Setup: Price broke out of a large ascending triangle and is now forming a mini symmetrical triangle — a consolidation before a possible continuation.
Current Price: $99.94
Breakout Zone: Near $100, close to decision point.
📊 Key Levels:
Immediate Resistance:
$101.09 (yellow)
$102.44 (first green target)
$103.50 (final target zone)
Support Levels:
$94.74 (white line)
$93.38 (stop-loss zone)
🎯 Trade Idea (Bullish Bias):
Entry: $100.00
Target 1: $102.44
Target 2: $103.50
Stop-Loss: Below $94.74
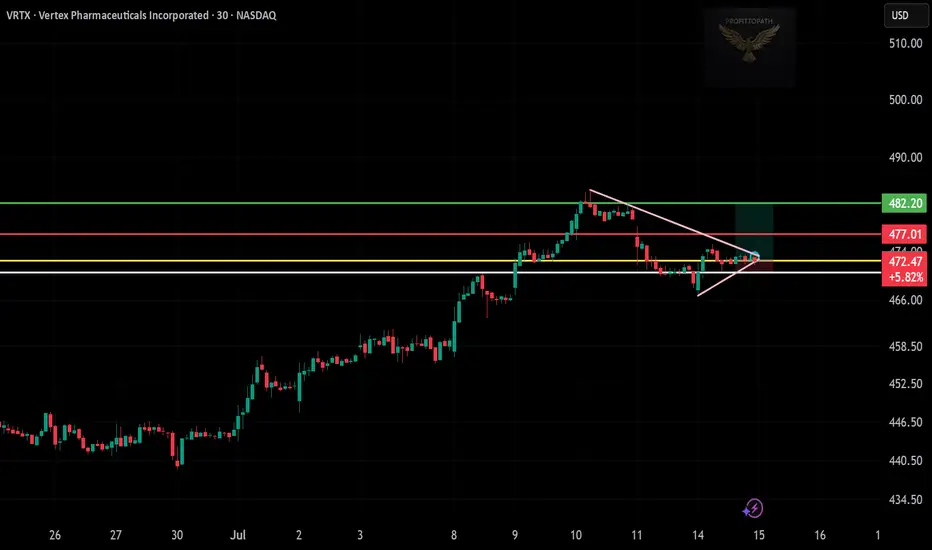
VRTX Tight Triangle Breakout – Watch Closely
🧠 Chart Analysis Summary:
Pattern: A symmetrical triangle is visible, tightening toward the apex with a breakout just forming.
Current Price: $472.47 (breakout near)
Key Levels:
Support Zone: Around $468–470 (white/yellow zone)
Resistance Zone:
First Target: $477.01 (red line)
Major Target: $482.20 (green line)
Volume Confirmation: Suggested to confirm breakout with volume increase.
📊 Trade Idea (Long Setup):
Entry: $472.50–473.00
Target 1: $477.00
Target 2: $482.00
Stop-Loss: Below $468.00
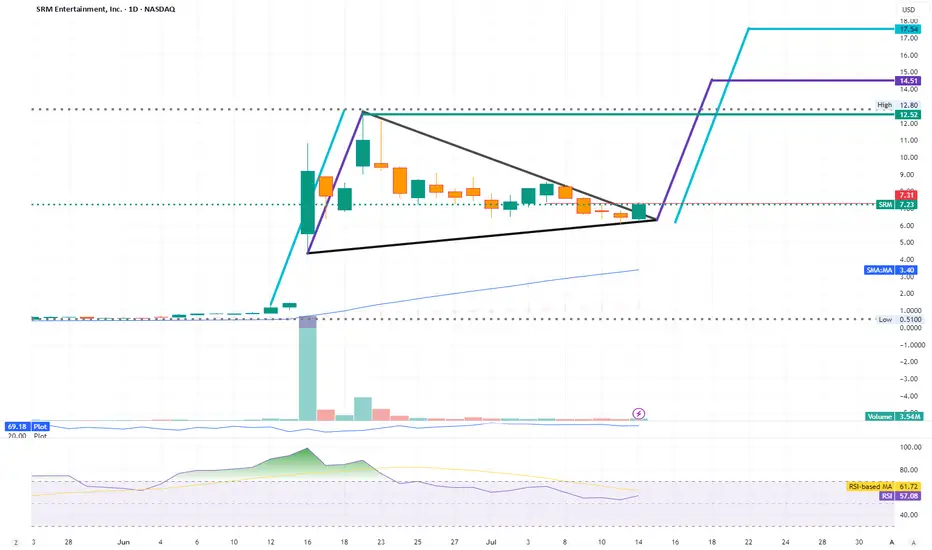
SRM - SRM Entertainment Inc (Soon to be TRON INC.)SRM Entertainment (SRM) used to design, development, and delivery of toys and themed merchandise for the global amusement and entertainment industry. They work with popular brands like Harry Potter, Frozen, Marvel, and Star Wars to create exclusive products found in various venues. However, through a reverse takeover they're are planning to change their name to Tron Inc.
The main reason for this shift is a $100 million equity investment dedicated to a new TRON Token Treasury Strategy. Justin Sun, the founder of the TRON blockchain, is also coming on board as an advisor. This move means they're completely shifting away from their prior business to focus on revenue generation within the blockchain space, with plans to implement a dividend policy through TRX staking.
Financially, SRM's past performance showed some weaknesses, with negative net income. However, what they did in the past is meaningless and has nothing to do with what they are doing now. The new $100 million investment significantly changes their financial outlook, providing substantial capital for their new direction. Currently, they report around $1.09 million in cash and short term investments, with total assets at about $5.81 million and liabilities around $828K.
The move into blockchain with a significant investment and Justin Sun's involvement could position them in a growing technology sector. If the TRON Token Treasury Strategy is successful and the blockchain market expands, there's potential for upside and a dividend policy from TRX staking could attract investors.
Their new model focuses on the TRON Token Treasury Strategy. They plan to generate revenue by acquiring and holding TRON (TRX) tokens, benefiting if the TRX value increases. They'll also earn staking rewards by locking up their TRX holdings to support the TRON network, and, once stable, they intend to distribute a portion of these staking rewards as dividends to shareholders. This strategy ties their financial performance directly to the TRON blockchain ecosystem.
Overall, this is a high risk, high reward situation. It will requires careful monitoring given volatility of the crypto market. It's not a typical long term, low maintenance investment at this stage.
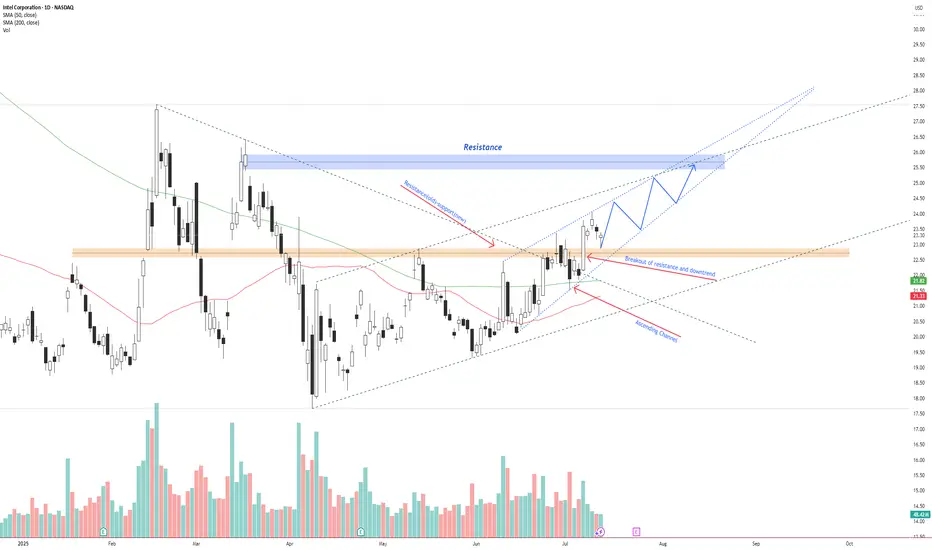
INTC – Breakout Confirmed, Bullish Continuation Inside AscendingIntel NASDAQ:INTC has broken above previous resistance and a descending trendline, confirming a bullish reversal.
Price is currently respecting an ascending channel and forming higher highs and higher lows. The breakout retest around $22.50 has held as new support.
If the current structure remains intact, price could continue toward the $26.00–$26.50 resistance zone. A breakout above this zone opens the door for a move toward $28+.
Key levels:
Support: $22.50 (previous resistance)
Resistance: $26.00–$26.50
Trend structure: Bullish channel
Volume supports the trend, and price is trading above both the 50 SMA and 200 SMA.
📌 Watching for a pullback and continuation move inside the channel.
This is not financial advice. Always do your own research.
Mean Reversion Trade: QCOM1. RSI in oversold region
2. Price likely to rebound back the the mean
Trade Rules:
Entry Trigger - RSI has cross below oversold region, enter limit buy at close price
Exit Trigger - Close at market when close price cross above exit trigger (Red step line)

HOOD Weekly Call Option Setup – 07/14/2025 $106C | Exp. July 18
📈 HOOD Weekly Call Option Setup – 07/14/2025
$106C | Exp. July 18 | Breakout Watch Above $100 👀
⸻
🔥 BULLISH MOMENTUM BUILDING
🟢 HOOD is pushing hard into $100 resistance — price riding above 10/50/200 EMAs on all timeframes.
📊 RSI hot (65.6 on 5m / 71.6 daily), but not maxed out — short-term pullback possible, but trend still bullish.
💰 Volume + call flow favor more upside.
⸻
📰 Catalyst:
Positive crypto market sentiment = increased trading activity = good for HOOD’s core business.
VIX at 16.40 = risk-on environment = perfect for high-beta names like this one.
⸻
🎯 Trade Plan – High R/R Call Setup
Clean structure, riding sentiment — but be quick around $100.
{
"ticker": "HOOD",
"type": "CALL",
"strike": 106,
"exp": "2025-07-18",
"entry": 0.92,
"target": 1.38,
"stop": 0.46,
"size": 1,
"confidence": "70%",
"entry_timing": "market open"
}
🔹 Entry: $0.92
🎯 Target: $1.38 (+50%)
🛑 Stop: $0.46 (-50%)
📅 Expiry: 07/18/25
📈 Confidence: 70%
💼 Strategy: Naked Call
⸻
💬 Model Consensus:
“Moderately Bullish” — clean momentum + bullish call flow = good entry.
⚠️ Watch RSI + $100 resistance — quick rejection is possible.
⸻
📌 Why $106C?
🔸 OI building there → potential magnet
🔸 Cheaper than ATM but within reach
🔸 High gamma setup if we break $100 early
⸻
💡 Trade Smart:
🏃 Get in early → fade into strength
🧠 Position size accordingly → don’t get greedy
📢 Tag your trading buddy who’s still ignoring HOOD 😏
#HOOD #OptionsTrading #BreakoutSetup #CryptoMomentum #AITrading #CallOptions #FlowPlay #TradingView #0DTE #