• Products
  • Community
  • Markets
  • Brokers
  • More
Get started
  • Markets
  • /Vietnam
  • /Stocks
  • /Ideas
DLG=))
HOSE:DLG
by paulzz
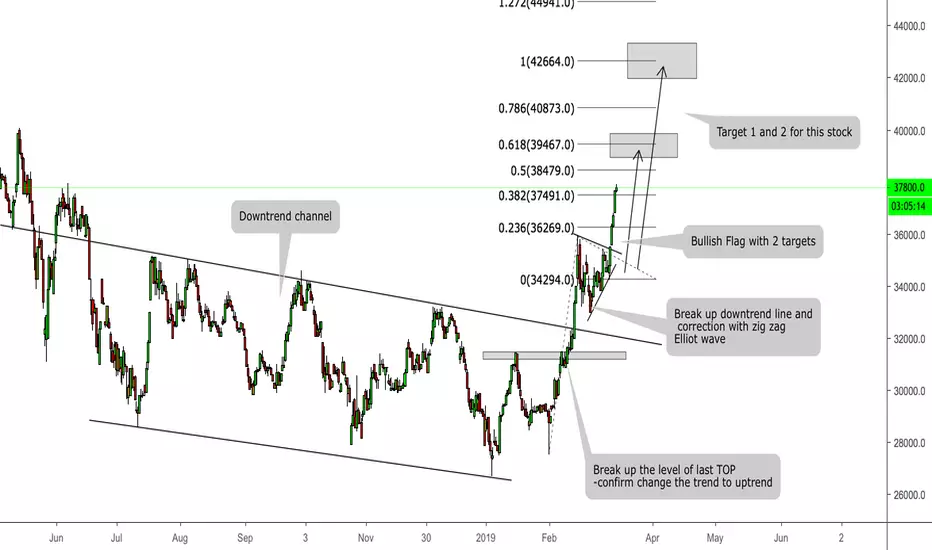
VINCOM RETAIL JOINT STOCK COMPANY - Nice bullish flagNice bullish pattern Break up downtrend line and last top Target 1 and 2 follow Fibonacci Extension Bullish Flag pattern Good luck !
HOSE:VRE
by xuanhaimmoer
Updated
HOA PHAT GROUP JOINT STOCK COMPANY - Watching market Watching market Detail in the chart
HOSE:HPG
by xuanhaimmoer
VINGROUP JOINT STOCK COMPANY - Nice stockNice stock Buy zone for holding in long term
HOSE:VIC
by xuanhaimmoer
VIETJET AVIATION JOINT STOCK COMPANY - Break support Break support Short entry is recommended
HOSE:VJC
by xuanhaimmoer
VRE - risk and rewardEverything is on the chart
HOSE:VRELong
by khoatrand
MWG - Target profit and risk controlMWG - in my portfolio. Risk and reward is on the chart
HOSE:MWGLong
by khoatrand
HA DO GROUP JOINT STOCK COMPANY - Wait actionWait pull back and buy again
HOSE:HDG
by xuanhaimmoer
NSC - 2 scenarios - play with cut loss in mindNSC is one of my favorite stocks. Personally, I strongly believe that agriculture and biology is the trend of this century, especially in Vietnam. So, I give it my bet. However, as an investor, I need to control my emotion. So, I draw this chart for myself to forecast the future. Everything is possible
HOSE:NSCLong
by khoatrand
DXG analysisGood chance to buy at this time. Cut loss if price breaks below 22
HOSE:DXGLong
by khoatrand
VNINDEX - CTG bank Today CTG strong with big volume big and up thought the cloud.
HOSE:CTG
by VietKabuLucky
11
Good chance to buy long-term with forecast AB=CD & Elliott?My strategy: I used many techniques in my analysis with - Price Action is a trading technique that allows me to read the market and make subjective trading decisions based on the recent and actual price movements. - Price Channel is a pair of parallel trend lines that form a chart pattern for a stock or commodity. Channels may be horizontal, ascending or descending. When prices pass through and stay through a trendline representing support or resistance. - Elliott Wave is a form of technical analysis that finance I use to analyze financial market cycles and forecast market trends by identifying extremes in investor psychology, highs and lows in prices, and other collective factors. - Supply and Demand is a theory that explains the interaction between the supply of a resource and the demand for that resource. The theory defines the effect that the availability of a particular product and the desire (or demand) for that product has on its price. Generally, low supply and high demand increase price. In contrast, the greater the supply and the lower the demand, the price tends to fall. - Support and Resistance are a critical part of trend analysis because it can be used to make specific trading decisions and identify when a trend is about to reverse. "Highly volatile investment product. Past performance is not an indication of future results. The content is intended for educational purposes only and should not be considered as investment advice. Your capital is at risk."
TLong
by TieuLongFX
Taseco likey to hit some 'turbulence' around 70,000Strong rebound but 70,000 level very crowded.
HOSE:AST
by luahawaii
VNM VietKabuTodayVNM VietKabuToday
HOSE:VNM
by VietKabuLucky
Updated
FPT (HOSE Vietnam) - Moving Up. Strong Buy for long termFPT (HOSE Vietnam) - Moving Up. Strong Buy for long term.
HOSE:FPT
by VinhTrongDuong
Updated
AAAAAA
HOSE:AAA
by SanTran
AAA UpdateAAA Update
HOSE:AAA
by UnknownUnicorn3658237
MBB UpdateMBB Update
HOSE:MBB
by UnknownUnicorn3658237
HPG mau hinh dieu chinhHPG mau hinh dieu chinh
HOSE:HPG
by UnknownUnicorn3658237
DHG - Rouding BottomsDHG - Rouding Bottoms
HOSE:DHGLong
by UnknownUnicorn3658237
11
VCI - FollowVCI - Follow
HOSE:VCI
by UnknownUnicorn3658237
TCM TCM
HOSE:TCH
by UnknownUnicorn3658237
DCM - Throwback - WDCM - Throwback - W
HOSE:DCM
by UnknownUnicorn3658237
1122334455667788991010111112121313141415151616171718181919202021212222232324242525
…999999

Select market data provided by ICE Data services. Select reference data provided by FactSet. Copyright © 2025 FactSet Research Systems Inc.© 2025 TradingView, Inc.

More than a product
  • Supercharts
Screeners
  • Stocks
  • ETFs
  • Bonds
  • Crypto coins
  • Crypto pairs
  • CEX pairs
  • DEX pairs
  • Pine
Heatmaps
  • Stocks
  • ETFs
  • Crypto
Calendars
  • Economic
  • Earnings
  • Dividends
More products
  • Yield curves
  • Options
  • News Flow
  • Pine Script®
Apps
  • Mobile
  • Desktop
Community
  • Social network
  • Wall of Love
  • Refer a friend
  • House Rules
  • Moderators
Ideas
  • Trading
  • Education
  • Editors' picks
Pine Script
  • Indicators & strategies
  • Wizards
  • Freelancers
Tools & subscriptions
  • Features
  • Pricing
  • Market data
Special offers
  • CME Group futures
  • Eurex futures
  • US stocks bundle
About company
  • Who we are
  • Manifesto
  • Athletes
  • Blog
  • Careers
  • Media kit
Merch
  • TradingView store
  • Tarot cards for traders
  • The C63 TradeTime
Policies & security
  • Terms of Use
  • Disclaimer
  • Privacy Policy
  • Cookies Policy
  • Accessibility Statement
  • Security vulnerability
  • Status page
Business solutions
  • Widgets
  • Charting libraries
  • Lightweight Charts™
  • Advanced Charts
  • Trading Platform
Growth opportunities
  • Advertising
  • Brokerage integration
  • Partner program
  • Education program
Community
  • Social network
  • Wall of Love
  • Refer a friend
  • House Rules
  • Moderators
Ideas
  • Trading
  • Education
  • Editors' picks
Pine Script
  • Indicators & strategies
  • Wizards
  • Freelancers
Business solutions
  • Widgets
  • Charting libraries
  • Lightweight Charts™
  • Advanced Charts
  • Trading Platform
Growth opportunities
  • Advertising
  • Brokerage integration
  • Partner program
  • Education program
Look FirstLook First