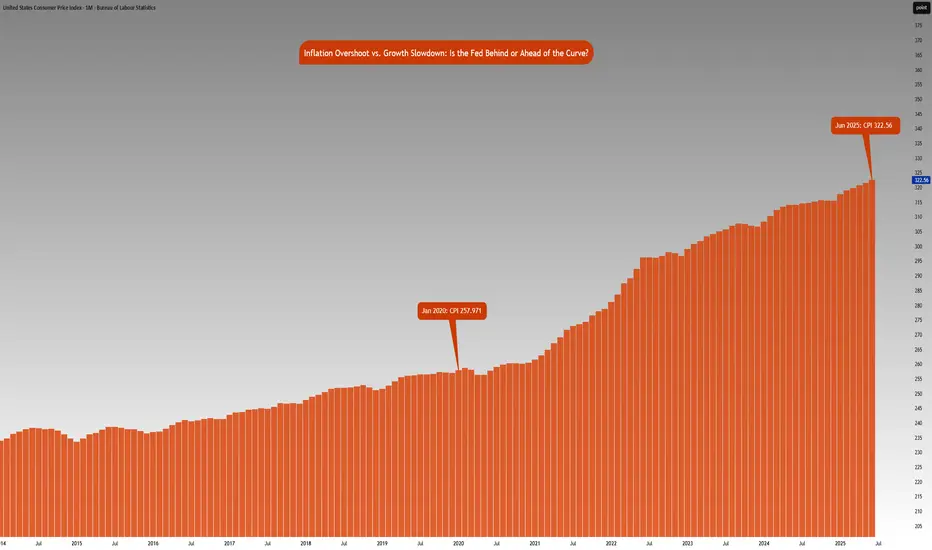
Inflation vs. Growth : Is the Fed Behind or Ahead of the Curve?CME_MINI:NQ1! CME_MINI:ES1! CME_MINI:MNQ1! CME_MINI:MES1! CBOT:ZN1!
Fed Policy recap:
There is an interesting and unusual theme to keep an eye on this week. The Fed is in a ‘blackout period’ until the FOMC meeting- this is a customary quiet period ahead of an FOMC policy meeting. Fed
Economy
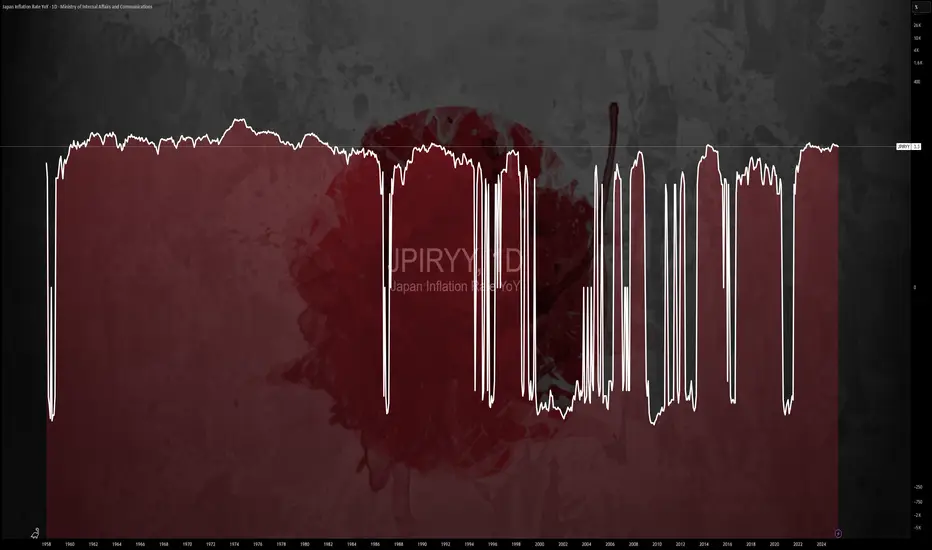
$JPIRYY -Japan Inflation Hits 7-Month Low (June/2025)ECONOMICS:JPIRYY 3.3%
June/2025
source: Ministry of Internal Affairs & Communications
-Japan’s annual inflation rate eased to 3.3% in June 2025 from 3.5% in May, marking the lowest reading since last November, as a sharp slowdown in electricity and gas prices offset persistent upward pressure fro
INSIGHT INSPIRED BY SHAIKH : the upcoming international crisisShaikh 2016 writes "Gold is the currency of last resort for the international system" & shows that each time since 1840 the commodity price (CPI, PPI) sinks against Gold, there is a crisis. We are there. My guess is that the international monetary system will be in crisis.

FED: less than 5% probability of a rate cut on July 301) The US labor market remains resilient according to the latest NFP report, which is good news for the macro-economic situation
The US labor market demonstrated its resilience last week, making a rate cut by the FED on Wednesday July 30 unlikely: the unemployment rate fell to 4.1% of the labor fo

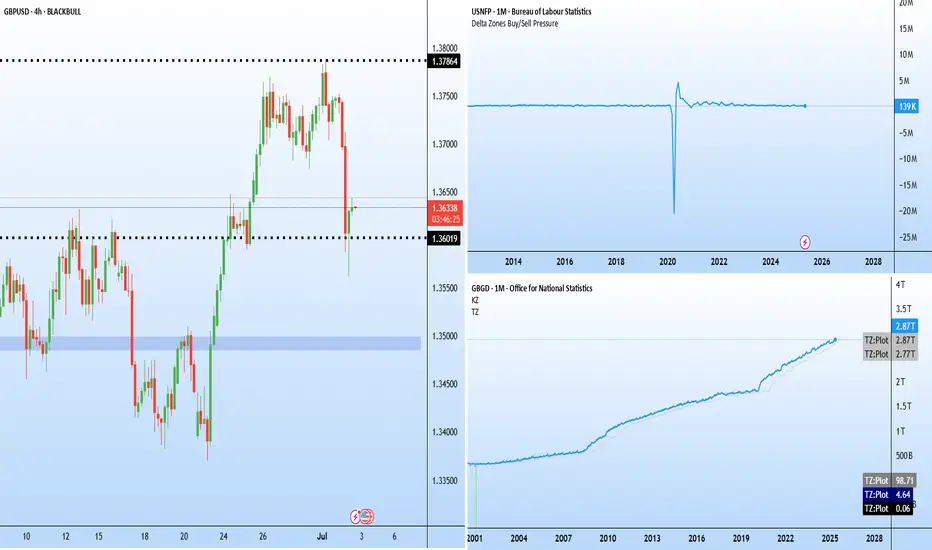
Jobs vs politics: GBPUSD caught in crossfire Two major stories are developing on either side of the Atlantic.
ADP reported a 33 k fall in June private payrolls (consensus +95 k). It is the third straight miss and sets the tone for Thursday’s early Non-Farm Payroll (NFP) release, brought forward because of the 4 July holiday.
In the UK, s
What is Inflation Climate and Weather? Copper is NextThe key driver of most markets — and a major influence on their trends — is inflation.
Once we understand the difference between short-term inflation weather and long-term inflation climate, we can better recognize where risk meets opportunity.
On this half yearly chart. We can see as the close on

Every cycle since 1970 has whispered the same sequence...Every cycle since 1970 has whispered the same sequence...
➊ Fed pivot (rate cutting cycle)
➋ Recessions + jobless claims uptrend
➌ Gold vs the stock market uptrend
That’s when commodities explode and outperform.

Argentina Money Supply Reduced Along With InflationWe once again see that MMT ("Modern" Monetary Theory) is 100% wrong. Milton Friedman wins again.
"Inflation is always and everywhere a monetary phenomenon."
Don't let modern economic hacks fool you.

FED Balance Sheet Projection Using Technical AnalysisThis chart refers to the total assets owned by the Federal Reserve System. Essentially, if this chart is contracting, there is less liquidity in the economy/markets, if it's expanding, there is more liquidity. If this chart enters its expansion phase, we can expect risk assets to pump, reaching new

BofA High Yield SpreadsI check this chart all the time. If the blue line starts trending higher the market will struggle.

See all popular ideas
GDPGDP GrowthReal GDPGDP Per CapitaGDP Per Capita PPPInflation RateInterest RateUnemployment RateGovernment Debt to GDPPopulationAverage Hourly EarningsHouse Price IndexManufacturing Production YoYIndustrial Production YoYCurrent AccountCurrent Account to GDPBalance of TradeEconomic Activity IndexCrude Oil ProductionSee all