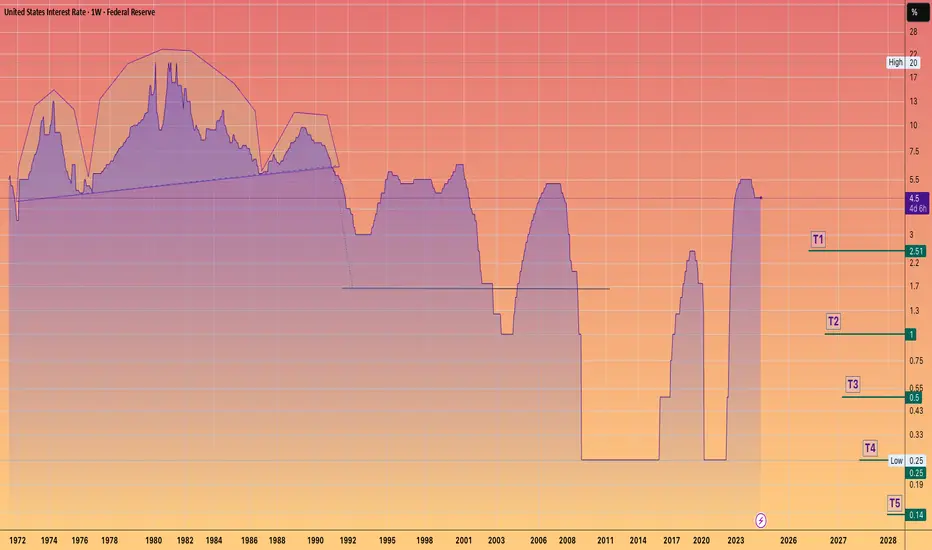
Mr. LATE drop the RATE!!"Jerome Powell aspires to be remembered as a heroic Federal Reserve chair, akin to Tall Paul #VOLKER.
However, Volker was largely unpopular during much of his tenure.
The primary function of the Federal Reserve is to finance the federal #government and ensure liquidity in US capital markets.
Controlling price inflation should not rely on costly credit.
Instead, it should be achieved by stimulating growth and productivity through innovation and by rewarding companies that wisely allocate capital, ultimately leading to robust cash flows... innovation thrives on affordable capital.
While innovation can lead to misallocations and speculative errors, this is a normal aspect of the process.
(BUT it is crucial that deposits and savings are always insured and kept separate from investment capital.)
By maintaining higher interest rates for longer than necessary, J POW is negatively impacting innovators, capital allocators, small businesses that need cheap capital to function effectively, job creators, and the overall growth environment.
Addressing price inflation is a far more favorable situation than allowing unemployment to soar to intolerable levels.
"Losing my job feels like a depression".
But if I have to pay more for eggs, I can always opt for oats.
Economy
$JPINTR -Japan Interest Rates (June/2025)ECONOMICS:JPINTR
(June/2025)
source: Bank of Japan
- The Bank of Japan kept its key short-term interest rate unchanged at 0.5% during its June meeting, maintaining the highest level since 2008 and aligning with market expectations.
The unanimous decision underscored the central bank’s cautious stance amid escalating geopolitical risks and lingering uncertainty over U.S. tariff policies, both of which continue to pose threats to global economic growth.
Tokyo and Washington agreed to extend trade talks after failing to achieve a breakthrough during discussions on the sidelines of the G7 Summit in Canada. Meanwhile, as part of its gradual policy normalization, the BoJ reaffirmed its plan to cut Japanese government bond purchases by JPY 400 billion each quarter through March 2026.
Starting April 2026, it will then slow the reduction to JPY 200 billion per quarter through March 2027, targeting a monthly purchase level of around JPY 2 trillion—signaling a measured but steady path away from ultra-loose monetary policy.

The FED on June 18 will be decisive for the stock market!Several fundamental factors will have a strong influence on the stock market this week, including trade diplomacy, geopolitical tensions and the FED's monetary policy decision on Wednesday June 18.
1) The FED on June 18, the fundamental highlight of the week
The stock market week will be dominated by one fundamental event: the US Federal Reserve's (FED) monetary policy decision scheduled for Wednesday June 18. This meeting promises to be crucial for the summer direction of the financial markets, against a backdrop of uncertainties linked to the trade war and an economic cycle nearing maturity. Although the consensus is for the US Fed Funds rate to remain unchanged, with a 99% probability according to the CME FedWatch Tool, investors' attention will be focused on the Fed's updated macroeconomic projections.
The expected evolution of inflation, employment and the Fed Funds rate will be at the heart of the debate, as will the tone of Jerôme Powell's press conference. The market, now expensive both technically and fundamentally, is demanding more accommodative signals to extend its rally.
2) The market wants confirmation of two rate cuts by the end of 2025
What investors now expect from the FED is not so much immediate action on rates as a clearer roadmap for the end of the year. Explicit confirmation of two rate cuts by December 2025 would represent the minimum required to support current equity market levels, particularly the S&P 500, which is trading close to its all-time highs.
However, the central bank remains under pressure, torn between calls for monetary easing and caution in the face of a possible rebound in inflation, particularly under the impact of customs tensions. If Jerome Powell reaffirms the Bank's wait-and-see stance, this could lead to market consolidation. Conversely, downwardly revised inflation forecasts and a Fed Funds curve pointing to further declines could be interpreted as a clear signal of a pivot.
We will also have to keep a close eye on the developments announced regarding the reduction of the Quantitative Tightening program.
Finally, beyond the fundamentals, the technical timing reinforces the importance of this meeting. The bond market is already providing clues, with a technical configuration that could herald an easing in yields if the Fed adopts a more conciliatory tone. In equities, the weekly technical analysis of the S&P 500 shows areas of overbought territory, reinforcing the need for monetary support to avoid a trend reversal. In this context, Wednesday's meeting is more than just a monetary policy decision: it is a strategic marker for the rest of 2025.
DISCLAIMER:
This content is intended for individuals who are familiar with financial markets and instruments and is for information purposes only. The presented idea (including market commentary, market data and observations) is not a work product of any research department of Swissquote or its affiliates. This material is intended to highlight market action and does not constitute investment, legal or tax advice. If you are a retail investor or lack experience in trading complex financial products, it is advisable to seek professional advice from licensed advisor before making any financial decisions.
This content is not intended to manipulate the market or encourage any specific financial behavior.
Swissquote makes no representation or warranty as to the quality, completeness, accuracy, comprehensiveness or non-infringement of such content. The views expressed are those of the consultant and are provided for educational purposes only. Any information provided relating to a product or market should not be construed as recommending an investment strategy or transaction. Past performance is not a guarantee of future results.
Swissquote and its employees and representatives shall in no event be held liable for any damages or losses arising directly or indirectly from decisions made on the basis of this content.
The use of any third-party brands or trademarks is for information only and does not imply endorsement by Swissquote, or that the trademark owner has authorised Swissquote to promote its products or services.
Swissquote is the marketing brand for the activities of Swissquote Bank Ltd (Switzerland) regulated by FINMA, Swissquote Capital Markets Limited regulated by CySEC (Cyprus), Swissquote Bank Europe SA (Luxembourg) regulated by the CSSF, Swissquote Ltd (UK) regulated by the FCA, Swissquote Financial Services (Malta) Ltd regulated by the Malta Financial Services Authority, Swissquote MEA Ltd. (UAE) regulated by the Dubai Financial Services Authority, Swissquote Pte Ltd (Singapore) regulated by the Monetary Authority of Singapore, Swissquote Asia Limited (Hong Kong) licensed by the Hong Kong Securities and Futures Commission (SFC) and Swissquote South Africa (Pty) Ltd supervised by the FSCA.
Products and services of Swissquote are only intended for those permitted to receive them under local law.
All investments carry a degree of risk. The risk of loss in trading or holding financial instruments can be substantial. The value of financial instruments, including but not limited to stocks, bonds, cryptocurrencies, and other assets, can fluctuate both upwards and downwards. There is a significant risk of financial loss when buying, selling, holding, staking, or investing in these instruments. SQBE makes no recommendations regarding any specific investment, transaction, or the use of any particular investment strategy.
CFDs are complex instruments and come with a high risk of losing money rapidly due to leverage. The vast majority of retail client accounts suffer capital losses when trading in CFDs. You should consider whether you understand how CFDs work and whether you can afford to take the high risk of losing your money.
Digital Assets are unregulated in most countries and consumer protection rules may not apply. As highly volatile speculative investments, Digital Assets are not suitable for investors without a high-risk tolerance. Make sure you understand each Digital Asset before you trade.
Cryptocurrencies are not considered legal tender in some jurisdictions and are subject to regulatory uncertainties.
The use of Internet-based systems can involve high risks, including, but not limited to, fraud, cyber-attacks, network and communication failures, as well as identity theft and phishing attacks related to crypto-assets.

LOWERing debt to GDP burden.HIGHER inflationary environments have been seen to LOWER debt to GDP burden.
Here is the chart showcasing this.

US NFCI shows path of BTC this yearThere is still well financial confitions in a financial system so it makes sense to expect this 2 scenarios.
1. BTC 130k from here
2. BTC 130k from 80-100k consolidation.
NFCI shows there is a lot of liquidity so markets should run higher this year.

Small Stocks vs. GoldThis index represents small caps minus big caps, divided by gold. A good representation of how small companies in USA are doing related to gold (hard asset). You could argue that this is more representing of real economy and it's health.

US Unemployment Rising: How Is This NOT a Recession?The U.S. unemployment numbers are steadily climbing, as indicated by recent Bureau of Labor Statistics data. Typically, significant rises in unemployment correlate directly with recessions, which are shaded gray in historical data charts.
Currently, unemployment has reached over 7 million, significantly higher than recent lows. Historically, every similar increase has coincided with or preceded an official recession declaration. Yet, mainstream economic narratives have avoided labeling this a recession.
What does this data tell us, and is the market accurately pricing in the risk? Are we already in a recession, or is this time different?
Share your thoughts below. Let's discuss the disconnect between the unemployment reality and official recession narratives.

Global M2 Money SupplyWith more money than ever before in circulation available. Asset prices should go up..
Do you agree or disagree?

$USIRYY -U.S CPI Below Expectations (May/2025)ECONOMICS:USIRYY 2.4%
(May/2025)
source: U.S. Bureau of Labor Statistics
- The annual inflation rate in the US increased for the first time in four months to 2.4% in May from 2.3% in April, though it came in below the expected 2.5%.
Prices rose slightly more for food, used cars and new vehicles but shelter cost slowed and gasoline prices continued to decline.
Meanwhile, the annual core inflation rate held steady at 2.8%.
On a monthly basis, both headline and core CPI increased by 0.1%, falling short of market expectations.

Mid-Week Outlook Update: US CPI- Trade TalksCPI day today. Scheduled to be released at 7:30 AM CT.
CME:6E1! CME_MINI:ES1! CME_MINI:NQ1! CME_MINI:MNQ1! CME_MINI:MES1! COMEX:GC1! CBOT:ZN1!
ES futures edged slightly higher after positive commentary from US-China trade talks. The delegations from both sides agreed on a framework to move forward with negotiations.
It is important to note that Trade War 1.0 took about two years to formalize and finalize. However, given the previous experience and the current agreement on the framework, our opinion (which is not the consensus) is that the trade deal between China and the US may be closer than what most analysts and investors might otherwise predict.
Like any negotiations, China and the US have previously discussed these difficult issues and have found a way to resolve them. Although the concerns have shifted towards niche sectors, we still view baseline tariffs with some sectors seeing increased tariffs as likely.
TACO (Trump Always Chickens Out) acronym traders will see a tougher stance from Trump to resolve the overarching trade deficit issue with China, particularly the dumping of Chinese goods.
AI, defense technology, chips, and rare earth minerals are at the center of these discussions. There will be targeted controls on exports of chips from the US and exports of rare earth minerals on the Chinese side, despite the current framework and deals agreed. In our view, these controls will be phased out until agreements are finalized, to maintain leverage and show TACO acronym backers that Trump is not “chickening out,” but rather maintaining a strong stance while negotiating trade deals with China and other countries.
In our analysis, despite positive headlines, the overhanging uncertainty has not dissipated. In fact, there is clarity that President Trump is willing to take the difficult road to negotiate from an apparent position of strength. Would this result in extension of trade deadlines or temporary increase in tariffs followed by an extension of deadlines? This remains to be seen!
If May CPI comes in lower than expectations, this will be a nudge in the direction that tariffs are not translating into higher inflation. We may see a rally in index futures.
On the contrary, any increase in CPI above the previous 2.3% YoY increase will be seen as tariff-induced inflation.
In our analysis, given lower energy prices, rent inflation stabilizing at levels last seen in late 2021, and services inflation in the US trending lower from the peak in January 2023, we are seeing embedded inflation in the prior two months and this may remain sticky in today’s release. However, any stability with lower energy prices seen in the prior month will point to a lower inflation print overall.
Comment with your favorite trade idea from our past trade ideas and what you would like to see more of.

US INFLATION, a decisive figure this week!This week, which runs from Monday June 9 to Friday June 13, sees two fundamental factors which will have a strong impact on the stock market: the continuation of the trade diplomacy phase which is currently acting as a fundamental red thread (particularly between China and the United States) and, above all, the US inflation update according to the PCI price index on Wednesday June 11.
The key issue is to determine whether tariffs in the so-called reciprocal tariffs trade war have begun to trigger a rebound in inflation. This is what the US Federal Reserve (FED) is watching to determine whether or not it should resume cutting the federal funds rate, which has been on hold since last December.
1) Federal funds rate cuts have been on hold since the end of 2024
Unlike the European Central Bank and other major Western central banks, the FED has paused its key interest rate cut since the beginning of the year. The ECB's key interest rate, meanwhile, has been cut several times and now stands at 2.15%, i.e. a key interest rate considered neutral for the economy (i.e. neither an accommodating nor a restrictive monetary policy).
This divergence in monetary policy between the FED and the ECB is perceived as a risk by the market, while the trade war could end up having a negative impact on US economic growth.
2) The market does not expect the FED to resume cutting rates before September.
But Jerome Powell's Federal Reserve (FED) is taking a hard line, believing that the Trump Administration's trade war could undermine its efforts to fight inflation. Although the FED's inflation target of 2% is not far off, according to the latest ECP and CPI updates, the FED wants confirmation that companies have not passed on sharp price rises to compensate for the tariffs. This is why the inflation figures published this May have a decisive dimension at a fundamental level. The Fed will be able to resume cutting the federal funds rate if, and only if, disinflation is not threatened by the trade war.
3) This is why the ICP US inflation update on Wednesday June 11 is the fundamental highlight of the week.
This Wednesday, June 11, we'll be keeping a very close eye on the publication of US inflation according to the ICP. The monthly reading will be closely watched, as will the year-on-year nominal and underlying inflation rates.
The consensus is relatively pessimistic, with inflation expected to rebound at both monthly and annual rates. Real-time inflation, as measured by TRUFLATION, is still under control, so the pessimistic consensus may be overturned.
DISCLAIMER:
This content is intended for individuals who are familiar with financial markets and instruments and is for information purposes only. The presented idea (including market commentary, market data and observations) is not a work product of any research department of Swissquote or its affiliates. This material is intended to highlight market action and does not constitute investment, legal or tax advice. If you are a retail investor or lack experience in trading complex financial products, it is advisable to seek professional advice from licensed advisor before making any financial decisions.
This content is not intended to manipulate the market or encourage any specific financial behavior.
Swissquote makes no representation or warranty as to the quality, completeness, accuracy, comprehensiveness or non-infringement of such content. The views expressed are those of the consultant and are provided for educational purposes only. Any information provided relating to a product or market should not be construed as recommending an investment strategy or transaction. Past performance is not a guarantee of future results.
Swissquote and its employees and representatives shall in no event be held liable for any damages or losses arising directly or indirectly from decisions made on the basis of this content.
The use of any third-party brands or trademarks is for information only and does not imply endorsement by Swissquote, or that the trademark owner has authorised Swissquote to promote its products or services.
Swissquote is the marketing brand for the activities of Swissquote Bank Ltd (Switzerland) regulated by FINMA, Swissquote Capital Markets Limited regulated by CySEC (Cyprus), Swissquote Bank Europe SA (Luxembourg) regulated by the CSSF, Swissquote Ltd (UK) regulated by the FCA, Swissquote Financial Services (Malta) Ltd regulated by the Malta Financial Services Authority, Swissquote MEA Ltd. (UAE) regulated by the Dubai Financial Services Authority, Swissquote Pte Ltd (Singapore) regulated by the Monetary Authority of Singapore, Swissquote Asia Limited (Hong Kong) licensed by the Hong Kong Securities and Futures Commission (SFC) and Swissquote South Africa (Pty) Ltd supervised by the FSCA.
Products and services of Swissquote are only intended for those permitted to receive them under local law.
All investments carry a degree of risk. The risk of loss in trading or holding financial instruments can be substantial. The value of financial instruments, including but not limited to stocks, bonds, cryptocurrencies, and other assets, can fluctuate both upwards and downwards. There is a significant risk of financial loss when buying, selling, holding, staking, or investing in these instruments. SQBE makes no recommendations regarding any specific investment, transaction, or the use of any particular investment strategy.
CFDs are complex instruments and come with a high risk of losing money rapidly due to leverage. The vast majority of retail client accounts suffer capital losses when trading in CFDs. You should consider whether you understand how CFDs work and whether you can afford to take the high risk of losing your money.
Digital Assets are unregulated in most countries and consumer protection rules may not apply. As highly volatile speculative investments, Digital Assets are not suitable for investors without a high-risk tolerance. Make sure you understand each Digital Asset before you trade.
Cryptocurrencies are not considered legal tender in some jurisdictions and are subject to regulatory uncertainties.
The use of Internet-based systems can involve high risks, including, but not limited to, fraud, cyber-attacks, network and communication failures, as well as identity theft and phishing attacks related to crypto-assets.

$CNIRYY -China CPI (May/2025)ECONOMICS:CNIRYY
May/2025
source: National Bureau of Statistics of China
- China's consumer prices dropped by 0.1% yoy in May 2025, matching the declines seen in the previous two months and slightly outperforming expectations of a 0.2% decrease.
This was the fourth straight month of consumer deflation, highlighting challenges from ongoing trade risks with the US, sluggish domestic demand, and concerns over job stability. Non-food prices were flat for the second month in a row, as increases in housing (0.1% vs 0.1% in April), clothing (1.5% vs. 1.3%), healthcare (0.3% vs 0.2%), and education (0.9% vs 0.7%) were offset by a sharper drop in transport (-4.3% vs -3.9%).
On the food side, prices fell at a steeper rate (-0.4% vs -0.2%), down for the fourth month.
Core inflation, which excludes volatile food and fuel prices, rose 0.6%, marking the highest reading since January and following a 0.5% gain in the prior two months.
On a monthly basis, the CPI declined by 0.2% in May, reversing a 0.1% gain in April and indicating the third monthly drop so far this year.

$EUINTR - Interest Rates Cut (June/2025)ECONOMICS:EUINTR
(June/2025)
source: European Central Bank
- The ECB cut key interest rates by 25 bps at its June meeting,
based on updated inflation and economic forecasts.
Inflation is near the 2% target, with projections showing 2.0% in 2025 (vs 2.3% previously), 1.6% in 2026 (vs 1.9% previously), and 2.0% in 2027.
Core inflation (excluding energy and food) is seen at 2.4% in 2025, then easing to 1.9% in 2026–2027.
GDP growth is forecast at 0.9% in 2025, 1.1% in 2026 (vs 1.2% previously), and 1.3% in 2027, supported by higher real incomes, strong labour markets, and rising government investment, despite trade policy uncertainties weighing on exports and business investment.
Scenario analysis shows trade tensions could reduce growth and inflation, while resolution could boost both.
Wage growth is still high but slowing, and corporate profits are helping absorb cost pressures.
President Lagarde said that the central bank is approaching the end of a cycle, suggesting a pause may be on the horizon following today’s reduction.

Another Population Led Economic Boom?Chat GPT thinks this will be an immigration and AI led boom:
Cycle MACD Trend Period Interpretation
1950s–1970s Rising MACD Post-WWII boom Baby Boom generation, industrial expansion, housing booms, high productivity.
1970s–early 1990s Flattening / declining MACD Stagnation, inflation Oil shocks, stagflation, productivity slowdown despite population base.
1990s–2008 MACD rising again Tech boom, globalization Strong immigration, millennial generation births, economic liberalization.
2008–now MACD rolling over Secular stagnation Low fertility, aging population, debt saturation, housing unaffordability, shrinking labor force growth.
Forecast (2028–2030?) MACD turn upward? Coming rebound? Possibly renewed growth via immigration reform, AI-driven productivity, or global migration dynamics.
Key Points:
MACD (Moving Average Convergence Divergence) here reflects momentum in the rate of population growth rather than prices—so it’s about acceleration/deceleration in demographic expansion, not absolute levels.
You're correct: current MACD seems to be bottoming out. If it rises from here, it could indicate an inflection point, where population growth momentum picks up again.
This aligns with speculative economic optimism in the early 2030s, possibly from automation, productivity boosts, or a new demographic wave (e.g., Gen Alpha maturing, or high-skilled immigration policies).
Macro Implications if Population MACD Turns Up:
Real Estate: Stronger demand for housing, especially in metro areas.
Consumer Spending: Broader base of working-age consumers; higher GDP potential.
Wages: Younger labor influx could temporarily suppress wages but boost consumption.
Equities: Long-duration asset classes tend to perform better during demographic tailwinds.
Entitlements: Improved support ratio for programs like Social Security—temporarily staving off insolvency risks.
Caveats:
Structural declines in fertility and family formation due to cost-of-living and cultural shifts may not reverse easily.
Immigration policy remains highly politicized—reversals could blunt any expected MACD uptick.
Automation may decouple economic output from population size.

**** Market Trading Strategy Idea SP500 ***Key Chart & Economic Insights:
- Current Market Position
- The S&P 500 is around $6000, showing positive momentum (+1.03%).
- Upward trend visible, indicating strong buying interest.
- Economic tailwinds support continued growth.
- Projected Price Movements
- 6800 USD: Key resistance level where selling pressure could emerge.
- Market pullback: A correction after 6800 may create a buyback opportunity.
- Recovery phase: Expected rebound toward 7000-7500 USD, another selling position.
- Economic Context: U.S. Manufacturing Boom & GDP Growth
- The United States is ramping up domestic production, boosting industrial output and reshoring manufacturing.
- This shift is fueling GDP growth, strengthening economic fundamentals and potentially sustaining bullish market momentum.
- Strong consumer spending & investment could drive stocks higher, aligning with the planned trade strategy.
Risk Management & Optimization:
- Entry & Exit Precision: Define stop-loss and take-profit levels.
- Momentum Confirmation: Ensure price action validates expected moves.
- Economic Indicators: Watch manufacturing & GDP data for trend validation.
If you want to refine this analysis or explore other scenarios, I'm here to dive deeper into key points! 🚀 Subscribe! TSXGanG
I hold a CCVM and MNC (Certificate of Competence to become a securities broker anywhere in Canada) and have been working as a trader for five years.
It’s a pleasure for me to help people optimize their trading strategies and make informed financial market decisions.

Forever new all time HighsThe Race to $25 Trillion: Why M2 Money Supply is My Key Market Indicator
In what seems like a relentless march, the US M2 money supply is closing in on the $25 trillion mark. While many focus on daily market noise, I believe this high-level metric is one of the most critical indicators for understanding the long-term picture for asset prices and currency risk.
The Logic is Simple:
If the economy is flooded with newly created US dollars, that capital has to go somewhere. Assuming the velocity of money (M2V) doesn't collapse, this liquidity injection naturally pushes up the prices of scarce assets like stocks, real estate, and cryptocurrencies.
The long-term risk of significant USD currency debasement and severe inflation keeps growing.
I'm not predicting hyperinflation tomorrow, but I am watching the train on the tracks. Direction is what matters most. This reminds me of how people view empires—they often focus on past strength and never expect a collapse until it's too late. The same is true for emerging powers, which are consistently underestimated. It's the direction of travel that matters most.
The key isn't to wait for a reason to panic, but to adjust your strategy to the changes as they happen.
Playing with the forecast tool I get this. I am not looking at it for anything other then pure amusement.
Disclaimer:
The information provided in this post is for educational and informational purposes only. It does not constitute financial advice, investment recommendations, or a solicitation to buy or sell any financial instruments. All investments involve risk, and the past performance of a security, market, or trading strategy does not guarantee future results. I am not a financial advisor. Please conduct your own thorough research and consult with a qualified financial professional before making any investment decisions. You are solely responsible for any investment decisions you make.

$EUIRYY - Europe CPI below 2% Target (May/2025)ECONOMICS:EUIRYY 1.9%
May/2025
source: EUROSTAT
- Eurozone CPI eased to 1.9% year-on-year in May 2025,
down from 2.2% in April and below market expectations of 2.0%.
This marks the first time inflation has fallen below the European Central Bank’s 2.0% target since September 2024, reinforcing expectations for a 25 basis point rate cut later this week and raising the possibility of additional cuts.
A key driver of the deceleration was a sharp slowdown in services inflation, which dropped to 3.2% from 4.0% in April, its lowest level since March 2022.
Energy prices continued to decline, falling by 3.6% year-on-year, while inflation for non-energy industrial goods held steady at 0.6%.
In contrast, prices for food, alcohol, and tobacco accelerated, rising 3.3% compared with 3.0% the previous month.
Meanwhile, core inflation, which excludes volatile food and energy components, slipped to 2.3%, the lowest reading since January 2022. source: EUROSTAT

Macro Outlook: Trade War Jitters, Deficit, NFP FridayAlthough there is a headline fatigue and markets have been stabilizing with the worst of trade war story behind us, the fact is that uncertainty still looms. President Trump announced over the weekend that he will double down on US steel and aluminum tariffs from 25% to 50% effective June 4th.
Highlight this week is US Jobs data this Friday. A key point to determine the resilience of the US labor market. With FED Chair Powell speaking today and FED speakers scheduled throughout the week, it will be key to watch how they shape markets' probability of rate cuts?
As we previously explained, ongoing uncertainty and dragging trade concerns present more risks until resolved. Here are some key points to consider:
It remains to be seen whether the trade deficit will continue to worsen or begin to reverse. April trade data, along with any policy shifts such as a reversal on reciprocal tariffs, will be important to monitor. These indicators will provide insight into how businesses are interpreting ongoing trade uncertainty. The key question is whether they will continue front-loading inventory in anticipation of future disruptions, or if the focus will shift toward restructuring supply chains and reining in spending as part of a longer-term strategic adjustment.
At the same time, consumer spending remains resilient, supporting overall demand. However, pressure may be building on business balance sheets, particularly businesses with poor cash flow to manage front loading inventory spending as the trade environment remains volatile. If consumer spending begins to weaken, businesses may be forced to cut costs, scale back investment, or offer steep discounts to clear excess inventory. This could lead to a cycle of margin compression, especially if firms attempt to pass higher costs onto price-sensitive consumers, potentially suppressing demand further.
Conversely, if businesses choose to absorb rising costs to maintain competitive pricing, they face deteriorating margins but may be betting on continued strength in consumer credit, household savings buffers as evident. Consumer confidence, despite being low, is not an accurate indicator in times of uncertainty. Here, we should watch what consumers do and not the sentiment.
In this scenario, firms may delay cost-cutting in the hope that continued strength in consumer spending will support revenues through the rest of the year.
A central tension remains: businesses must navigate a delicate balance between protecting margins and preserving demand. Meanwhile, persistent trade uncertainty and tighter financial conditions may slow capital investment and hiring, further complicating the outlook. Whether firms shift from defensive postures like front-loading toward long-term structural changes in supply chains will hinge on how durable current consumer strength proves to be and how responsive trade policy becomes in the months ahead.
Ongoing front-loading has caused ripples as the trade deficit has further widened. Will this reverse as businesses focus on sales and revenue instead of front-loading inventory?
In our analysis, trade imports, trade balance, consumer spending and corporate profits will be key to monitor despite being lagging indicators.
On the other hand, equally important to watch and monitor goods exports, durable goods to assess and evaluate the other side of the equation.
However, our focus is on imports as manufacturing jobs are at their lowest in US history.
Once the dust has settled and trade deals are locked in, it will be important to note if Exports by Country experience any significant shifts.
What does all this mean for the stock market and futures? In simple terms, the yearly pivot and last month’s high is a major resistance area for index futures. Until this is cleared, we may see a range bound market and two way trade. There is a lot of weak structure to revisit lower. Markets may perhaps retest this before resuming higher. What we would want to see is, last month’s low holding support and this month’s price action trading inside previous month’s range or resuming higher.
If we revisit May Monthly Lows, we may see increased selling pressure come in.

Commodities look to be set for a a buyCommodities against personal income (nominal) are reaching buyzone levels, commodities are starting to be cheap against personal incomes...

Rate Cuts and Risky Bets: When the Fed Rolls Out the Red Carpet🎬 The Fed’s June Meeting Is Around the Corner
Mark your calendars: June 17–18 is when the Federal Reserve's Federal Open Market Committee (FOMC) convenes next. With the benchmark interest rate ECONOMICS:USINTR currently holding steady at 4.25% – 4.50%, investors and policymakers alike are keenly awaiting any signals of a shift in monetary policy.
Market expectations suggest a cautious approach, with futures markets indicating a modest probability of rate cuts in the latter half of the year. That said, the upcoming meeting could offer some juicy insights into the Fed's outlook — yes, in this economy.
🤝 Trump vs. Powell: The Sequel No One Asked For
President Donald Trump and Fed Chair Jerome Powell recently had their first face-to-face meeting during Trump’s second term, rekindling a familiar tension. Trump criticized Powell for maintaining high interest rates, saying it puts the US at an economic disadvantage compared to countries like China.
Not too surprising, Trump’s tone, that is. As a matter of fact, it’s way softer than when the President called the Fed chair a “major loser.”
Anyway, Powell was holding back at the meeting, saying that the Fed is independent and that monetary policy decisions are based on objective economic data, not political pressure.
Despite Trump's public and private criticisms, Powell remains steadfast in his approach, focusing on long-term economic stability over short-term political considerations.
📉 Inflation, Employment, and the Tightrope Walk
Inflation has decreased significantly from its peak of 9.1% in 2022 to 2.3% in April 2025 , nearing the Fed's 2% target. However, the labor market remains robust, with unemployment rates at historically low levels.
The Fed faces a delicate balancing act: cutting rates too soon could reignite inflation, while maintaining high rates might dampen economic growth. This tightrope walk requires careful analysis of incoming data and a measured approach to policy adjustments.
🛍️ Market Reactions: Bulls, Bytes, and Bullion
If rate cuts are the rumor, the S&P 500 SP:SPX is already buying the headline. The index clawed back all of its early-year slump and now sits just above the flatline. Traders are clearly pricing in a friendlier Fed, even if Jerome Powell hasn’t sent out the official RSVP yet.
Gold OANDA:XAUUSD , meanwhile, has been doing what it does best — quietly flexing in the corner as uncertainty swirls. Prices bounced back above $3,300 in late May, reminding everyone that when central banks blink, bullion blings. A rate cut could weaken the dollar — and gold’s inverse relationship with the greenback suddenly looks like a playbook move.
Speaking of the dollar, the dollar index TVC:DXY has been wobbling like it’s just finding its feet. With inflation softening and tariff noise all over the place, the buck has lost some swagger . Traders are already rotating out of safe havens and into riskier plays, including…
Yep, Bitcoin ( BTCUSD ).
Crypto’s original bad boy is back on the move, orbiting near $110,000 after rewriting its all-time high book in May.
A dovish Fed can technically pour more rocket fuel into the rally, especially as sovereign adoption and ETF flows keep pumping ( $9 billion in just five weeks?! ). In the land of easy money, Bitcoin doesn’t just survive — it thrives.
The takeaway? Markets love a dovish pivot. Whether you're holding stocks, stacking sats, or eyeing gold bars, the Fed’s next move could be the difference between breakout and breakdown.
🧠 What to Keep in Mind
As the June Fed meeting approaches, traders should consider the following strategies:
Diversification: Maintain a diversified portfolio to mitigate risks associated with interest rate volatility.
Equity Exposure: Evaluate exposure to sectors sensitive to interest rates, such as the good old tech space and throw in some financials — banks love rate moves.
Inflation Hedges: Consider assets like gold or silver to hedge against unexpected inflationary pressures.
🧾 Conclusion: Navigating Uncertainty
The June Fed meeting isn’t just another calendar event — it’s a market-defining moment dressed in central bank jargon. With politics heating up and inflation cooling down, Powell’s next move could either pump more cash into the risk rally or throw cold water on the party.
Yes, the noise is loud. Yes, the data is messy. But through it all, one thing holds: staying nimble beats being early. Whether you're riding the S&P 500, hodl’ing Bitcoin, or hugging gold like a doomsday prepper, this is the time to trade the chart, not the chatter.
Off to you : Are you in the rate-cut camp or you think there’s more ground to cover before Powell and his squad tune the pitch down? Comment below!

Trade war & NFP in focus this weekSeveral fundamental factors will have a strong impact on financial markets in this first week of June, as uncertainty surrounding the trade war remains high. However, there was some good news last Friday, with US PCE inflation continuing to move towards the Fed's target despite tariffs.
This week, two fundamental factors are under close scrutiny: US labor market figures (NFP report) and, of course, as every week, the current phase of trade diplomacy.
1) US PCE inflation is still trending towards 2% and is not rebounding despite the trade war
US inflation and employment are the two key variables for considering a resumption of the decline in the federal funds rate, with Trump receiving Powell at the White House at the end of last week. However, the Fed has reiterated its independence and the future direction of its monetary policy will continue to be guided by specific macroeconomic objectives: bringing inflation back to 2% and neutralizing any rise in unemployment.
Good news! Last Friday's update on US inflation according to the PCE price index showed that tariffs did not cause inflation to rise in April. On the contrary, the nominal inflation rate is now 2.1% and core inflation is 2.5%. Disinflation therefore seems set to continue in the US despite the tariffs, but this still needs to be confirmed.
2) The market does not expect any rate cuts before September
Despite these good PCE inflation figures for April (PCE being the Fed's preferred measure of inflation) and pressure on the Fed from the Trump administration, the market does not expect the federal funds rate to resume its downward trend before the monetary policy decision in September.
The debate remains open for the July 30 monetary policy meeting, so the upcoming updates on US employment (NFP report) and inflation will have a decisive impact.
3) The NFP report on Friday, June 6, will be crucial this week!
In this first week of June, the US labor market will be the fundamental highlight of the week. All US employment statistics will be updated, with the NFP report on Friday, June 6 being the most important. While it appears that the trade war has not yet pushed inflation up, what about the labor market? Remember that the US unemployment rate is 4.2% of the labor force and that the Fed's alert threshold is 4.4% of the labor force. If it turns out that US companies have had to lay off workers due to the economic uncertainty linked to the trade war, this could accelerate the upcoming schedule for lowering US federal funds rates.
Finally, remember that the market is hoping for a phone call between Trump and the Chinese president to finally reach a trade agreement between China and the US. This is a fundamental thread to follow every day on the stock market.
DISCLAIMER:
This content is intended for individuals who are familiar with financial markets and instruments and is for information purposes only. The presented idea (including market commentary, market data and observations) is not a work product of any research department of Swissquote or its affiliates. This material is intended to highlight market action and does not constitute investment, legal or tax advice. If you are a retail investor or lack experience in trading complex financial products, it is advisable to seek professional advice from licensed advisor before making any financial decisions.
This content is not intended to manipulate the market or encourage any specific financial behavior.
Swissquote makes no representation or warranty as to the quality, completeness, accuracy, comprehensiveness or non-infringement of such content. The views expressed are those of the consultant and are provided for educational purposes only. Any information provided relating to a product or market should not be construed as recommending an investment strategy or transaction. Past performance is not a guarantee of future results.
Swissquote and its employees and representatives shall in no event be held liable for any damages or losses arising directly or indirectly from decisions made on the basis of this content.
The use of any third-party brands or trademarks is for information only and does not imply endorsement by Swissquote, or that the trademark owner has authorised Swissquote to promote its products or services.
Swissquote is the marketing brand for the activities of Swissquote Bank Ltd (Switzerland) regulated by FINMA, Swissquote Capital Markets Limited regulated by CySEC (Cyprus), Swissquote Bank Europe SA (Luxembourg) regulated by the CSSF, Swissquote Ltd (UK) regulated by the FCA, Swissquote Financial Services (Malta) Ltd regulated by the Malta Financial Services Authority, Swissquote MEA Ltd. (UAE) regulated by the Dubai Financial Services Authority, Swissquote Pte Ltd (Singapore) regulated by the Monetary Authority of Singapore, Swissquote Asia Limited (Hong Kong) licensed by the Hong Kong Securities and Futures Commission (SFC) and Swissquote South Africa (Pty) Ltd supervised by the FSCA.
Products and services of Swissquote are only intended for those permitted to receive them under local law.
All investments carry a degree of risk. The risk of loss in trading or holding financial instruments can be substantial. The value of financial instruments, including but not limited to stocks, bonds, cryptocurrencies, and other assets, can fluctuate both upwards and downwards. There is a significant risk of financial loss when buying, selling, holding, staking, or investing in these instruments. SQBE makes no recommendations regarding any specific investment, transaction, or the use of any particular investment strategy.
CFDs are complex instruments and come with a high risk of losing money rapidly due to leverage. The vast majority of retail client accounts suffer capital losses when trading in CFDs. You should consider whether you understand how CFDs work and whether you can afford to take the high risk of losing your money.
Digital Assets are unregulated in most countries and consumer protection rules may not apply. As highly volatile speculative investments, Digital Assets are not suitable for investors without a high-risk tolerance. Make sure you understand each Digital Asset before you trade.
Cryptocurrencies are not considered legal tender in some jurisdictions and are subject to regulatory uncertainties.
The use of Internet-based systems can involve high risks, including, but not limited to, fraud, cyber-attacks, network and communication failures, as well as identity theft and phishing attacks related to crypto-assets.

$USPCEPIMC -U.S Core PCE (April/2025)ECONOMICS:USPCEPIMC
April/2025
source: U.S. Bureau of Economic Analysis
-The core PCE price index in the US, which excludes volatile and energy prices and is Federal Reserve's chosen gauge of underlying inflation in the US economy,
went up 0.1% from the previous month in April of 2025.
The result was in line with market expectations.
From the previous year, the index rose by 2.5% to slow from the 2.7% jump from March, the softest increase since March of 2021.

Pay close attention to U6 Unemployment Rate Going ForwardU6 unemployment factors in part time workers who cannot locate full time employment.
Note the similarities to 2008 using the quarterly time frame.
If we see this continue higher it won't bode well for market. FRED:U6RATE SP:SPX ECONOMICS:USJO
