$GBIRYY - U.K Inflation Rate Accelerates (April/2025)ECONOMICS:GBIRYY
April/2025
source: Office for National Statistics
- The annual inflation rate in the UK jumped to 3.5% in April, the highest since January 2024, from 2.6% in March and above forecasts of 3.3%.
The main upward pressure came from higher electricity and gas prices after the Ofgem price cap increase, while new Vehicle Excise Duty on electric cars lifted transport costs, and food inflation also picked up.
Meanwhile, core inflation accelerated to 3.8%, the highest in a year.
Economy

European fiscal opportunityThe major European economies have tied up too much money in welfare spending and social policies making them unable to benefit from the renewed interest in European fiscal stimulus or more accurately unable to provide fiscal stimulus.
However a few of Europes economies are in a healthy fiscal situation. Germany, Sweden, Norway, Iceland, Denmark, Netherlands, Switzerland and Poland are all at a debt to GDP ratio of below 70%. Ireland is as well however the GDP figures in the country is a bit irregular.
Could we see a long short opportunity here with low debt to gdp countries outperforming as a result of more room for fiscal stimulus?

Deposits All Commercial Banks & US DebtWhen a politician and their buddy start spouting nonsense about the US debt spiraling out of control, but then insist that tax cuts are great because they’ll create jobs, and all that money will somehow trickle down to the rest of us, magically boosting tax revenue to "make up" for the lost funds.
Especially when that same politician was re-elected bc inflation & the economy were just so horrible, promising he would come in and save the day bringing prices down again with more tax cuts because they worked so great the first time around.
That's the extreme right. What about the extreme left #MMT?
#MMT is just as bad as MAGAs! They will tell you deficits are great! Deficits add to our savings! Deficits make us all richer! It's accounting, they say! it has to be that way! Except for the little fact that it's not based on empirical evidence.
So the next time some B.S. Artist tells you their little version of a fictional money story, you will know what reality is since 2018. You will have seen this chart with your own eyes and cannot unsee it! No matter what you do, no matter what side you lean politically, it's irrelevant.
Public debt since the tax cuts have grown exponentially, while the private sector deposits have lagged to the point they have stagnated completely since 2021. Barely rising 6%.
Defunding CIA, FBI, USAID, Dept of Education etc.. will do absolutely nothing to make up for all the lost tax revenue since 2018 and the next tax cuts to follow. In fact, when we enter a recession, the deficits will explode even higher as tax revenues collapse and social and economic stabilizers (if there are any left) kick in. Then what?
Don't shoot the messenger!

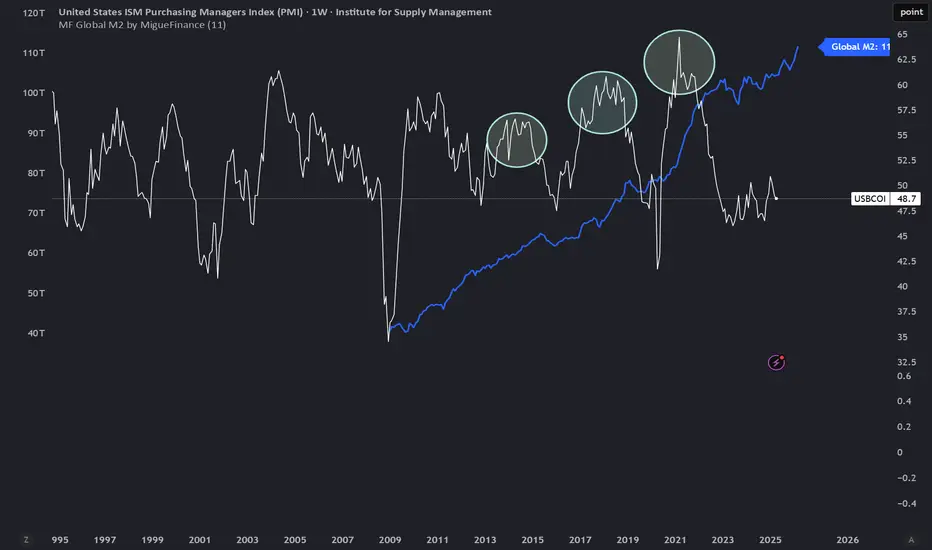
The ISM chart tracks the business cycle.Every crypto peak aligns with the expansion phase & the top of the business cycle.
Every expansion also aligns with the central bank’s debt refinancing cycle.
This is your altcoin season road map.
Wood Raw Material Price Outlook & Its Impact on Pellet Prices🔍 Chart Highlights:
Historical pellet price references:
2000: €200/ton
2014: €273/ton
2016: €217/ton
Recent upward trend since COVID-19 dip, known as the “Coronadip”, reflects increasing demand and market correction.
Forecasted pellet price levels based on raw material trends:
Minimum projection: €291/ton
Expected projection: €328/ton
Maximum projection: €352/ton
Producer Price Index (PPI) data suggests a return to long-term growth after a temporary peak and correction in 2021–2023.
📈 Outlook:
Pellet prices have shown a consistent upward trend over the past four years. However, this pace is likely unsustainable. A further price increase is expected in the short term, driven by raw material costs and market sentiment.
Depending on market conditions, an average increase between 10% and 42% is projected — a range typically anticipated by institutional investors in commodity sectors.
📌 Note: This chart reflects raw material price trends. Final product prices may differ due to manufacturing, logistics, and retail markups.

$JPGDBQQ -Japan's GDP Shrinks More than Expected (Q1/2025)$JPGDBQQ
Q1/2025
source: Cabinet Office, Japan
- Japan's GDP shrank 0.2% qoq in Q1 of 2025, compared with forecasts of a 0.1% fall and after a 0.6% growth in Q4, flash data showed.
It was the first GDP contraction in a year, amid worries over the impact of US trade policy under President Donald Trump.
On an annualized basis, the economy contracted 0.7%, worse than consensus of a 0.2% drop and a reversal from an upwardly revised 2.4% gain in Q4.

$GBGDPQQ -UK GDP Growth Above Expectations (Q1/2025)ECONOMICS:GBGDPQQ
Q1/2025
source: Office for National Statistics
- The British economy expanded 0.7% on quarter in Q1 2025, compared to 0.1% in Q4 and forecasts of 0.6%, preliminary figures showed. It is the strongest growth rate in 3 quarters, with the largest contribution coming from the services sector, gross fixed capital formation and net trade. Year-on-year, the GDP expanded 1.3%.

$USIRYY - U.S Inflation Rate Unexpectedly Slows (April/2025)ECONOMICS:USIRYY
April/2025
source: U.S. Bureau of Labor Statistics
- The annual inflation rate in the US eased to 2.3% in April, the lowest since February 2021, from 2.4% in March and below forecasts of 2.4%.
Prices of gasoline fell at a faster pace and inflation also slowed for food and transportation.
Compared to the previous month, the CPI rose 0.2%, rebounding from a 0.1% fall in March but below forecasts of 0.3%.
Meanwhile, annual core inflation rate steadied at 2.8% as expected, holding at 2021-lows.

Rising M2 does not always equate markets going upHistory has shown us that using liquidity (m2) to anticipate stock market reaction is a dangerous game.
It can work, until it doesn't.
What always works is analyzing the price chart based on its own merits.

US CPI inflation is the fundamental highlight of the weekIntroduction: The US Federal Reserve (FED) spoke last week, and the US federal funds rate was left unchanged at its level since last December. Unlike the European Central Bank (ECB) and other major central banks, the FED has yet to resume cutting its interest rate, despite intense verbal pressure from Donald Trump.
This week (May 12), it's the CPI US inflation update that is the fundamental highlight of the week. Indeed, Jerome Powell is demanding more confirmation of disinflation to consider resuming rate cuts.
1) US inflation rate resumed its decline this spring according to the CPI and PCE inflation indices
High-finance circles are astonished by the FED's slowness to match the ECB's rate cuts, when the downward trend in inflation curves has been confirmed in the US by the latest updates of the PCE (the FED's favorite inflation index) and the CPI.
But it seems that Jerome Powell's FED is waiting to see the outcome of the trade diplomacy to be sure that the tariff war will not push inflation back up.
The chart below shows the curves for nominal US inflation and underlying US inflation, and their update on Tuesday May 13 is the dominant fundamental factor of the week. If the fall in the inflation rate is confirmed, the likelihood of the FED cutting its interest rate in June or July will increase, and vice versa.
2) Real-time inflation indicators are optimistic
There are a number of real-time inflation indicators, most of which are ahead of official inflation. This is particularly true of TRUFLATION, the real-time measure of true US inflation, which is already below the FED's 2% target, thanks in large part to the fall in oil prices and the decline in real estate inflation.
3) But fears of a rebound in inflation are strong, especially among US consumers.
But we must remain cautious, as there is a risk of inflation rebounding in the coming months. This risk is present as long as the United States has not signed trade agreements with its main trading partners, notably China and the European Union. It is essential to limit tariffs as much as possible to neutralize any risk of a rebound in inflation, a real risk if US consumer inflation expectations are anything to go by.
Conclusion: US CPI inflation on Tuesday 13th should therefore be kept under very close watch. Confirmation of a fall in the inflation rate would be good news for the equity market, as it would bring the next FED rate cut closer in time.
DISCLAIMER:
This content is intended for individuals who are familiar with financial markets and instruments and is for information purposes only. The presented idea (including market commentary, market data and observations) is not a work product of any research department of Swissquote or its affiliates. This material is intended to highlight market action and does not constitute investment, legal or tax advice. If you are a retail investor or lack experience in trading complex financial products, it is advisable to seek professional advice from licensed advisor before making any financial decisions.
This content is not intended to manipulate the market or encourage any specific financial behavior.
Swissquote makes no representation or warranty as to the quality, completeness, accuracy, comprehensiveness or non-infringement of such content. The views expressed are those of the consultant and are provided for educational purposes only. Any information provided relating to a product or market should not be construed as recommending an investment strategy or transaction. Past performance is not a guarantee of future results.
Swissquote and its employees and representatives shall in no event be held liable for any damages or losses arising directly or indirectly from decisions made on the basis of this content.
The use of any third-party brands or trademarks is for information only and does not imply endorsement by Swissquote, or that the trademark owner has authorised Swissquote to promote its products or services.
Swissquote is the marketing brand for the activities of Swissquote Bank Ltd (Switzerland) regulated by FINMA, Swissquote Capital Markets Limited regulated by CySEC (Cyprus), Swissquote Bank Europe SA (Luxembourg) regulated by the CSSF, Swissquote Ltd (UK) regulated by the FCA, Swissquote Financial Services (Malta) Ltd regulated by the Malta Financial Services Authority, Swissquote MEA Ltd. (UAE) regulated by the Dubai Financial Services Authority, Swissquote Pte Ltd (Singapore) regulated by the Monetary Authority of Singapore, Swissquote Asia Limited (Hong Kong) licensed by the Hong Kong Securities and Futures Commission (SFC) and Swissquote South Africa (Pty) Ltd supervised by the FSCA.
Products and services of Swissquote are only intended for those permitted to receive them under local law.
All investments carry a degree of risk. The risk of loss in trading or holding financial instruments can be substantial. The value of financial instruments, including but not limited to stocks, bonds, cryptocurrencies, and other assets, can fluctuate both upwards and downwards. There is a significant risk of financial loss when buying, selling, holding, staking, or investing in these instruments. SQBE makes no recommendations regarding any specific investment, transaction, or the use of any particular investment strategy.
CFDs are complex instruments and come with a high risk of losing money rapidly due to leverage. The vast majority of retail client accounts suffer capital losses when trading in CFDs. You should consider whether you understand how CFDs work and whether you can afford to take the high risk of losing your money.
Digital Assets are unregulated in most countries and consumer protection rules may not apply. As highly volatile speculative investments, Digital Assets are not suitable for investors without a high-risk tolerance. Make sure you understand each Digital Asset before you trade.
Cryptocurrencies are not considered legal tender in some jurisdictions and are subject to regulatory uncertainties.
The use of Internet-based systems can involve high risks, including, but not limited to, fraud, cyber-attacks, network and communication failures, as well as identity theft and phishing attacks related to crypto-assets.

Euro GDP growth likely contributor to underperformanceEuro GDP as a percentage of world GDP has been declining as the euro growth rate has been lower than the world growth rate. This trend has been correlated with euro underperformance against the S&P

$GBINTR -BoE Cuts Rates as Expected (May/2025)ECONOMICS:GBINTR
May/2025
source: Bank of England
- The Bank of England cut the Bank Rate by 25 basis points to 4.25%,
matching expectations but revealing a split 5–4 vote.
Two policymakers favored a deeper 50 bps cut, while two others wanted to hold at 4.5%.
It was the fourth cut since August 2024, amid concerns over slowing growth linked to Trump-era tariffs.

New York All Transaction House Price Relative Strength IndexAdding a relative strength index calculator to FRED's Quarterly New York All Transaction House Price index reveals similarity between the state of the current housing market to periods preceding previous housing bear markets.

Bitcoin has been dietingWhen is Bitcoin going to gobble up all the money central banks have been printing? Look at the pie getting bigger! C'mon BTC, doing your thing beeetch. HAHA. Look at this meme!
pbs.twimg.com

For the last 5 times out of 6.For the last 5 times out of 6.
Gold bottomed when the inflation rate lost a rising support line.

JAPAN IS DOOMED!It's been 30 years since the Central Bank of Japan has maintained ECONOMICS:JPINTR near or even below 0% - WTF!
In combination with weak (or negative) GDP growth rates in the same period, the Japanese Government seems to be in a debt death spiral which will likely come to an end soon. See ECONOMICS:JPGDP and ECONOMICS:JPGDG
Default is inevitable!

FED FUNDS Rate Inflation Adjusted Remains TightFED FUNDS Rate Inflation Adjusted for core inflation remains in the tightening area. As inflation rises over the next few months, thanks to Trump's liberating all Americans with higher taxes and less discretionary income to spend.
I expect this chart to drop as inflation rises and Fed holds rates steady. Alternatively, FED lowers rates bc we will be in a recession, and it is trying to make private money creation cheaper to pump the economy.
Which of the two will occur first, I could not tell you. However, it is important to keep a close eye on this chart in the months ahead.
Click like, follow, subscribe.

$USINTR -Fed Keeps Rates Unchanged (May/2025)ECONOMICS:USINTR
May/2025
source: Federal Reserve
- The Federal Reserve kept the funds rate at 4.25%–4.50% range for a third consecutive meeting as officials adopt a wait-and-see approach amid concerns about the effects of President Trump’s tariffs.
Policymakers noted that uncertainty about the economic outlook has increased further and that the risks of higher unemployment and higher inflation have risen.

one of the most underrated charts : M2(money supply)When it comes to forex and macro trading, it's easy to get lost in charts, indicators, and economic calendars. But one of the most overlooked—and incredibly powerful—macro indicators is the M2 Money Supply. In this post, we’ll break down what M2 really is, why it matters, and how traders like you can use it to get an edge.
💰 What Is M2 Money Supply?
M2 represents the total amount of money in circulation in an economy, including:
M1 (physical cash + checking deposits)
Savings deposits
Money market securities
Time deposits (under $100,000)
In simple terms: M2 tracks how much money is sloshing around in the system.
🧠 Why Traders Should Care About M2
When M2 goes up significantly, it often signals that a central bank is easing monetary policy—i.e., printing more money, keeping interest rates low, or using QE (quantitative easing). Conversely, when M2 contracts or slows, it suggests tightening, and could signal reduced liquidity, higher rates, or a slower economy.
M2 = Macro Liquidity Meter
And liquidity drives markets—especially currencies.
⚙️ How to Use M2 in Your Trading Strategy
Here are 3 ways you can incorporate M2 into your macro trading toolkit:
1. Gauge Inflation & Currency Value
When a country expands its money supply rapidly (like the U.S. did during COVID), the purchasing power of its currency often declines, especially against currencies with tighter monetary policy.
✅ Watch for divergences: If M2 is growing fast in one country and flat in another, that’s a potential FX opportunity.
📉 Example: USD weakened sharply post-COVID when M2 surged.
2. Confirm Trends in Interest Rates
M2 often leads or confirms central bank policy.
Shrinking M2 → Tighter conditions → Rising rates → Currency bullish
Expanding M2 → Easier policy → Lower rates → Currency bearish
Use it alongside yield curve analysis and central bank projections.
3. Identify Risk-On/Risk-Off Regimes
A rising M2 usually supports risk assets like equities and EM currencies. Falling M2 can trigger liquidity squeezes, flight to safety, and stronger demand for USD or JPY.
Use M2 as a macro filter for your risk appetite.
Watch for turning points in M2 to anticipate market regime shifts.
🔎 How to Track M2 on @TradingView
Open a new chart and search for:
🔍 FRED:M2SL – U.S. M2 Money Stock (seasonally adjusted)
You can also compare this against:
DXY (US Dollar Index)
USDJPY, EURUSD, or other major FX pairs
U.S. 10-Year Yields (US10Y) or Fed Funds Rate (FEDFUNDS)
Add M2 as an overlay or sub-chart for macro context.
Use the "Compare" tool to visualize divergences with currency pairs.
📌 Final Thoughts
M2 might not give you minute-by-minute trade signals like an RSI or MACD, but it offers something far more powerful: macro context. When used with other indicators, it can help traders:
Anticipate currency trends
Understand shifts in monetary policy
Position for regime changes in risk appetite
Remember: the smartest traders aren’t just charting price—they’re charting liquidity. And M2 is the ultimate liquidity map.
put together by : @currencynerd

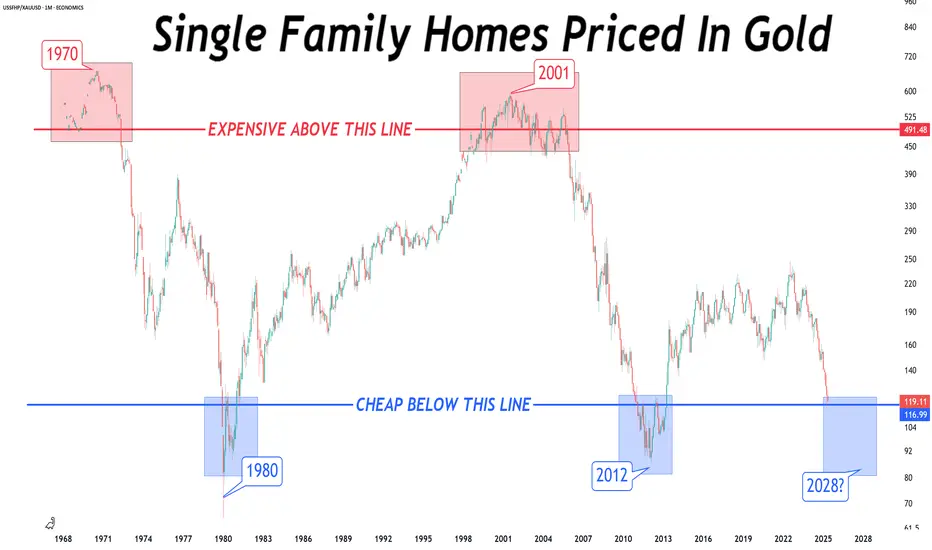
Rarely have single family homes been so cheap.For gold stackers...
Rarely have single family homes been so cheap.
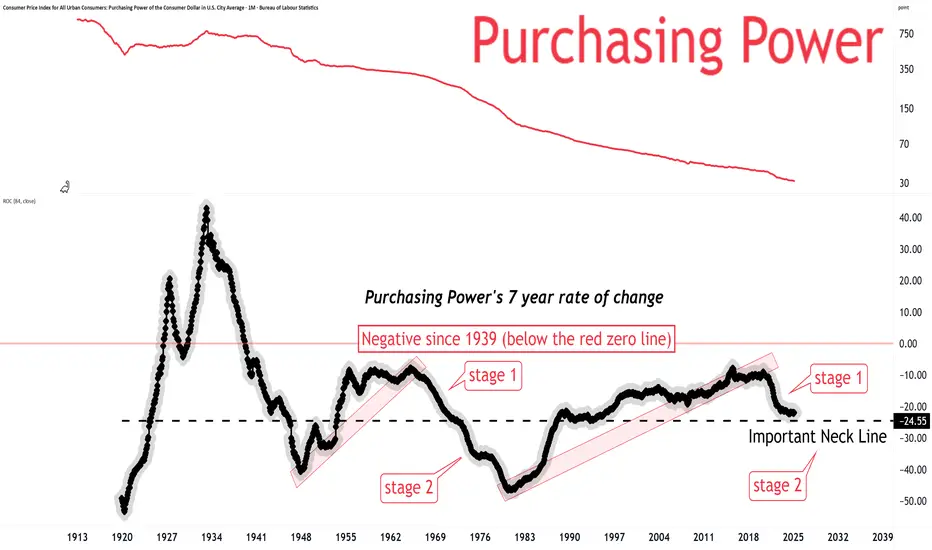
Are you ready?Purchasing power erosion is an important macro factor which helps carve out many charts we look at.
The initial "Stage 1" decline is now complete.
The next "Stage 2" decline is setting up right now.
Are you ready?
Will Jerome Powell give in on Wednesday May 7 by cutting rates?Introduction: As the US Federal Reserve (FED) approaches a new monetary policy decision, the central question is: Will Jerome Powell bow to political pressure and initiate a rate cut on May 7? To answer this question, it is essential to look back at the institutional framework of the FED and the historical precedents that shed light on the current stakes. Created by the Federal Reserve Act of 1913, the FED is founded on a fundamental principle: its independence from the executive branch. This principle ensures that its monetary decisions, particularly with regard to interest rates, are not dictated by political considerations, but by macro-economic factors.
1) The independence of the FED is enshrined in law
The independence of the FED is enshrined in law. Its Chairman, appointed for a four-year term, can only be removed by the President of the United States for "just cause", in other words, gross misconduct, a provision designed to prevent any attempt at direct political interference. This institutional bulwark was put to the test in the 1970s, when a landmark episode pitted Richard Nixon against Arthur Burns, then Chairman of the FED. In a bid to stimulate the economy before the 1972 presidential election, Nixon put intense pressure on Burns to lower interest rates, despite inflationary signals. Burns eventually relented. While this accommodating monetary policy initially bore electoral fruit, it also triggered a long period of inflation and a severe economic crisis. Today, this episode remains a historic lesson in the consequences of an FED subject to political will.
2) On the macroeconomic front, Powell should wait beyond May 7
In 2025, the FED finds itself under pressure again, this time from Donald Trump, but current economic conditions do not justify hasty action. Although inflation is slowing, with the PCE index close to the 2% target in nominal terms, several factors argue in favor of the status quo. Firstly, US household inflation expectations, as measured by the University of Michigan index, remain high. Secondly, U.S. companies face uncertainty about how to deal with the tariffs: should they pass on costs to consumers or cut their margins? Finally, despite existing economic room for manoeuvre, macroeconomic signals are not clear enough to justify an immediate rate cut.
Conclusion: History shows that giving in to political pressure can be costly for the US economy. Jerome Powell seems aware of this responsibility and should adopt a measured wait-and-see strategy. May 7 will probably not be the day of the long-awaited monetary turnaround, but more likely the monetary policy decisions of June or July if disinflation is confirmed and a trade agreement is reached between the USA, China and the EU.
DISCLAIMER:
This content is intended for individuals who are familiar with financial markets and instruments and is for information purposes only. The presented idea (including market commentary, market data and observations) is not a work product of any research department of Swissquote or its affiliates. This material is intended to highlight market action and does not constitute investment, legal or tax advice. If you are a retail investor or lack experience in trading complex financial products, it is advisable to seek professional advice from licensed advisor before making any financial decisions.
This content is not intended to manipulate the market or encourage any specific financial behavior.
Swissquote makes no representation or warranty as to the quality, completeness, accuracy, comprehensiveness or non-infringement of such content. The views expressed are those of the consultant and are provided for educational purposes only. Any information provided relating to a product or market should not be construed as recommending an investment strategy or transaction. Past performance is not a guarantee of future results.
Swissquote and its employees and representatives shall in no event be held liable for any damages or losses arising directly or indirectly from decisions made on the basis of this content.
The use of any third-party brands or trademarks is for information only and does not imply endorsement by Swissquote, or that the trademark owner has authorised Swissquote to promote its products or services.
Swissquote is the marketing brand for the activities of Swissquote Bank Ltd (Switzerland) regulated by FINMA, Swissquote Capital Markets Limited regulated by CySEC (Cyprus), Swissquote Bank Europe SA (Luxembourg) regulated by the CSSF, Swissquote Ltd (UK) regulated by the FCA, Swissquote Financial Services (Malta) Ltd regulated by the Malta Financial Services Authority, Swissquote MEA Ltd. (UAE) regulated by the Dubai Financial Services Authority, Swissquote Pte Ltd (Singapore) regulated by the Monetary Authority of Singapore, Swissquote Asia Limited (Hong Kong) licensed by the Hong Kong Securities and Futures Commission (SFC) and Swissquote South Africa (Pty) Ltd supervised by the FSCA.
Products and services of Swissquote are only intended for those permitted to receive them under local law.
All investments carry a degree of risk. The risk of loss in trading or holding financial instruments can be substantial. The value of financial instruments, including but not limited to stocks, bonds, cryptocurrencies, and other assets, can fluctuate both upwards and downwards. There is a significant risk of financial loss when buying, selling, holding, staking, or investing in these instruments. SQBE makes no recommendations regarding any specific investment, transaction, or the use of any particular investment strategy.
CFDs are complex instruments and come with a high risk of losing money rapidly due to leverage. The vast majority of retail client accounts suffer capital losses when trading in CFDs. You should consider whether you understand how CFDs work and whether you can afford to take the high risk of losing your money.
Digital Assets are unregulated in most countries and consumer protection rules may not apply. As highly volatile speculative investments, Digital Assets are not suitable for investors without a high-risk tolerance. Make sure you understand each Digital Asset before you trade.
Cryptocurrencies are not considered legal tender in some jurisdictions and are subject to regulatory uncertainties.
The use of Internet-based systems can involve high risks, including, but not limited to, fraud, cyber-attacks, network and communication failures, as well as identity theft and phishing attacks related to crypto-assets.

