Economy

Manipulation pushing higher inflation into the future. Inflation rate has been precisely manipulated to stay inside this triangle pushing the problem forward to the 2040's to 2050's.
Important market corrections are dated for references. Look at the dates and compare with economic issues, inflation and market trading.
There is a very narrow window moving forward into 2024 to 2025. The chart shows after 2025 the inflation rate will continue to creep up until the 2050's.
Government manipulation is just pushing the issues forward 20 years or so. That makes since considering most of the people in charge will not have to deal with
the fallout of their decisions. Almost everyone manipulating the us economy is over the age of 60 yrs old. Debt doesn't solve economic issues. US economy needs to
move out of this debt and generate a strong wealthy economy. This publication is just for research purposes. Use as a tool and guide for your research. Thanks
for reading.

Inflation will never stop...its time to short inflation 50%Inflation will never stop no matter how much money you make.
Right now the cost of living avg is 50% too high for the current wages to keep supporting too much longer.
homelessness and families moving in together to survive is already happening.
The signs are out there for everyone to see and the government is playing with your lives.
When wages increase so does the cost of living. Now the cost of living since the 1950's is too high to maintain in 2022 with current wages and 2023 will be worse.
Unsustainable economic breakdown is coming and depression in society is at the highest i have ever seen it in my life time.
Fuel shortages, Food shortages, high utility bills, taxes keep going up, government keeps overspending, times are tough for working families.
United States Statistics for inflation and cost of living
Year Median Home Value Median Rent Household Median Income Gas Prices vary by state this is the avg Avg wage per hour worked
1950 $7,400 $42 $2,990 $0.27 $0.75
1960 $11,900 $71 $4,970 $0.31 $1.15
1970 $17,000 $108 $8,734 $0.36 $1.50
1980 $47,200 $243 $17,710 $1.20 $3.10
1990 $79,100 $447 $29,943 $1.10 $4.25
2000 $119,600 $602 $55,030 $1.40 $5.15
2010 $221,800 $901 $49,445 $2.60 $7.25
2022 $428,700 $1295 - $2495 $78,075 $3.40 to $6.00 $7.25to $16.00 varies by state
Federal Minimum Wage Information
$5.15 - Sept. 1, 1997
$5.85 - July 24, 2007
$6.55 - July 24, 2008
$7.25 - July 24, 2009
Inflation and supply shortages keeps getting worse.
I hear so much everyday from people and this is what people say to me when i ask.
I don't make enough money to survive.
Bank won't give me a loan.
I don't make enough money this year to cover bills.
I need things and the store doesn't have it or its too expensive for my budget.
power bill too expensive.
gas is too expensive.
my car has been in shop for months and still not fixed.
my bank won't refinance my home.
i can't afford groceries because i no longer qualify for government "snap" benifits with my raise at work and i have 4 kids.
I am losing my farm to drought and excess cost of fuel and supplies.
Automated warehouses put my entire family out of business.
several people came forward with police not doing there job while communities are getting robbed
while they are at work.
the covid epidemic cost me everything my home and my business.
my health insurance went up and can no longer afford it.
so many people out there struggling to survive and the normal services that help these people
have exhausted there funding without any more support for the demand of help.
i don't see an end to this economic struggle people are facing and its only going to get worse.
Fed rates hikes, the covid pandemic and the countless defaulted loans and ongoing bankruptcies with inflation
has banks refusing personal loans and refinancing to alot of people without collateral. All i can say is stick with the job you have and
try to manage your finances carefully.
resources are stretched thin and customer service everywhere has a high turnover rate with people that
don't really know what they are doing.
People are taking any job they can to survive and when they lose or find another job they move on and don't really care about the service
they are providing. They are basically a third party for the companies and some have reported security
violations that resulted in fraud to access individual finances.
I'm not writing a book here so i will leave this info here for you reading to digest and research on your own. Maybe a post from you on social
media or here with some resources to help others find the help they need.
thx for reading

The US Treasury cash rebuild; volmageddon or a nothing burger
While Congress still needs to pass the debt limit agreement, the debate in the market has shifted to the need for the US Treasury Department (UST) to rapidly rebuild its depleted cash levels.
We have no understanding of the timetable, but already the debate is whether the significant level of Treasury bill issuance will result in a major headwind for global financial markets, while others believe this is pure hype.
Some are contrasting what lies ahead as a massive liquidity withdrawal from financial markets – Quantitative Tightening (QT) on steroids – where we will essentially see USD liquidity sucked out of the system.
The process of raising cash levels
To raise and rebuild its now low cash balances, the US Treasury Department (UST) will look to issue around $1.3t of US T-bills over the following 12 months. Around $700b of this T-bill issuance will be fast-tracked, tapping up the market within a matter of months, with the private sector expected to buy what the Treasury is selling.
US Treasury bills (‘T-bills’) are high-quality debt instruments which have a maturity of less than 12 months.
With the US Treasury replenishing its cash balances it would be able to make ongoing payments and meet its obligations. Plus they will keep its additional capital on the Fed’s balance sheet (under the Treasury General Account or ‘TGA’) for future payments.
The effect on markets
The concern in the market is around the notion of a “liquidity drain” – whereby the UST remove such staggering levels of liquidity out of the system, in a short period, that we see bank funding costs heading markedly higher and USD rates rising to highly concerning levels. Could this dynamic cause renewed concerns in the US regional banks?
Drilling into the theme - the potential stress in markets really comes down to who exactly absorbs the issuance, as this is key in determining the potential impact on system liquidity.
A drawdown in RRP balances
US money market funds (MMF) have historically been the big buyers of T-bill issuance and could again play a key role in supporting the USTs quest to recapitalize. Money funds currently have near-exclusive access to the Fed’s Reverse Repo facility or ‘RRP’ (TradingView code – RRPONTSYD), and have around $2.2t parked there, where they get 5.05% (annualized) risk-free.
If US T-bills are issued to the public at a yield close to the RRP rate (of 5.05%), then there’s a case that we see money funds withdrawing a sizeable level of holdings from the RRP facility and supporting the US T-bill issuance.
It is widely considered that risk assets (e.g. equities) would not be impacted when a large percentage of the USTs issuance is funded by RRP balances. In fact, some are saying this could be a net positive given there has been a scarcity of high-quality T-bills in the system of late.
A drain in bank reserves would be more problematic for markets
Banks are required to hold a level of reserves as a percentage of their deposit base. However, banks/depository institutions often hold reserves in excess of their regulatory requirements - this can be highly advantageous should they have to meet increasing deposit withdrawals.
Instead of keeping these excess reserves (cash equivalent) on their balance sheet, they can be offered to the Fed, where since 2008 they will receive interest paid at 5.15% (annualized) through the Fed’s IORB facility (Interest on Reserve Balances - TV code: WRBWFRBL).
The RRP and IORB spread guides overnight lending rates
With the RRP rate currently at 5.05% and IORB paid at 5.15% this spread represents the corridor by which the fed funds effective rate (EFFR) – the rate at which banks will borrow/lend cash overnight – trades. This is the fundamentals of how the Fed sets monetary policy and to date, it has been very effective.
The concern from some is where money funds have less involvement in supporting UST T-bill issuance - resulting in a comparatively low RRP drawdown – with a large percentage of the issuance supported by a drain of bank reserves.
Some strategists estimate that of this potential $700b in near-term T-bill issuance around $400b to $500b of this will be funded by the liquidation of bank reserves balances. That could the scenario where we could – in theory - see higher market volatility.
It’s really about a scarcity of reserves
There are currently $3.28t of excess bank reserves parked on the Fed’s balance sheet - so if we were to see a $500b drawdown in reserves then this balance would fall quite rapidly to around $2.8t. This is important because many feel the Lowest Comfortable Level of Reserve (LCLoR) that must be in the financial system is between $2.5t and $2.2t.
Interestingly, some feel an aggressive decline in reserves would be a headwind for risk assets – if we look at the regression between reserves and S&P500 futures, we can see an R^2 of 0.79. In effect, 79% of the variance in US equity futures can be explained by reserves – statistically, it’s very meaningful.
So this injects some credence to the idea that reserve drawdown could be a short-term headwind for risk. However, where this becomes interesting, and where we would see true stress in the system is through monitoring the spread between the Fed’s effective rate (TradingView Code: EFFR) and upper bound of the rates channel and Interest paid on Reserve Balances (on TradingView code: IORB).
Currently, this spread sits at -7bp, but if we were to see the fed funds effective rate (EFFR) moving to the top of this corridor and even trading at a premium to IORB, it’s at this point where the market is telling us that we’re moving closer to a scarcity of reserves in the system.
This is where things would be far more prone to breaking, and the Fed will need to act swiftly.
When EFFR trades at a premium to IORB it essentially portrays that the money market channels are breaking and demand for short-term loans is becoming increasingly inelastic – subsequently, those in need of short-term loans will continue to pay ever higher prices.
Of course, this may not play out. We may see reserves falling precipitously and risk assets and the USD show no relationship at all to this dynamic. However, it is a risk, and we need to recognise the triggers and be open to the possibility it does cause a higher volatility regime, especially given it comes at a time when EU banks are having to pay back E500b of TLRO loans to the ECB.
Price is true, but I will be the moves in the KRE ETF (US regional bank ETF), as well as watching the EFFR- IORB spread as this could be far more important for the USD and signs of increased risks in the financial system.

US Industrial Production Quarterly Log ChartWhat happens to precious metals when industrial production MOMENTUM breaks down?
#Gold and #Silver are in process of carving out GENERATIONAL bottoms.

The Debt Ceiling AgreementThe debt ceiling is a limit set by the U.S. Congress on the amount of debt that the federal government can have outstanding. This debt is primarily made up of two components: debt held by the public (like U.S. Treasury bonds held by investors) and intragovernmental holdings (like those in the Social Security Trust Fund).
From a financial perspective, the debt ceiling is significant for several reasons:
1. Creditworthiness of the United States: The U.S. government is seen worldwide as an issuer of risk-free assets, primarily because it has never defaulted on its debt. If the debt ceiling is not raised in time, it could potentially lead to a default, shaking the world's confidence in U.S. government securities. This could increase the interest rates that the U.S. has to pay to borrow money in the future.
2. Global Financial Markets Stability: U.S. Treasury securities are used as a benchmark for many other types of credit and are widely held by financial institutions around the world. A default could cause significant upheaval in these markets and potentially lead to a financial crisis.
3. Economic Recession : A default could lead to severe economic consequences. It could cause a sharp decrease in government spending (since the government couldn't borrow to finance its operations), which could in turn lead to job losses and potentially a recession. Treasury Secretary Janet Yellen warned of this risk in the case of the 2023 debt ceiling negotiations.
4. Budgeting and Planning: The debt ceiling also has implications for how the government budgets and plans its finances. When the debt ceiling is reached, the Treasury Department has to use "extraordinary measures" to keep the government funded, which can create uncertainty and inefficiency.
5. Political Tool: While not strictly a financial point, it's worth noting that the debt ceiling has often been used as a political tool. Lawmakers may refuse to increase the debt ceiling without certain concessions, such as spending cuts or policy changes. This can lead to financial uncertainty, as was the case during the 2023 debt ceiling negotiations.
The negotiations that led to the agreement were marked by considerable compromise. President Biden, for instance, noted that the agreement represented a compromise where not everyone got what they wanted but was nonetheless an important step forward1. House Speaker Kevin McCarthy, despite opposition within his own party, committed to passing the bill within 72 hours of its introduction on the House floor. This commitment was a testament to the urgency felt by lawmakers due to the looming threat of a potential default on the U.S. debt obligations.
The agreement was a product of compromise and necessity, driven by the urgent need to avoid a default on U.S. debt obligations. It included a two-year budget deal holding spending flat for 2024 and imposing limits for 2025, effectively reducing spending as Republicans had insisted. This was in exchange for raising the debt limit for two years, until after the next election. The deal would boost spending on the military and veterans' care and cap spending for many discretionary domestic programs. However, the specifics of these spending caps remained subject to further debate between Republicans and Democrats.
Conclusion
The 2023 U.S. debt ceiling negotiations showcase the intricate dynamics of American politics and its intersection with economic policy. They underscore the importance of compromise in a divided government and the challenges that ideological divergences within parties can pose to such compromise. These negotiations and their outcome also highlight the potential economic implications, such as the risk of default, that can arise when political disagreements hinder prompt fiscal decisions.

Data error Japan Tokyo CPI Ex Food And Energy (JPTCPIEFA) & JapHello good morning & good day to all! There seems to be an error for these 2 Japan econ data when we chart on Trading View, Japan Tokyo CPI Ex Food And Energy (JPTCPIEFA) & Japan Tokyo Core CPI (JPTCCPI).
Previously, these 2 data have been presented in index values but it seems that yesterday, their format has been changed to y/y % for the last 2 months but does not adjust prior historical data points to y/y.
Thus, right now, I cannot do any meaningful analysis of these charts. Wrote in about these errors and sent a ticket to Hep Centre but no reply.
Can anyone help over here? or is there a rep from Trading View here? Much appreciated. Thank you

The Overnight Reverse Repo Facility Looks to be Breaking DownMoney that is being parked at the Feds Reverse Repo Facility due to attractively high interest rates the fed has set for money parked at the facility has been on a steady decline since late 2022 and we have now confirmed a lower high and are looking to break down below a Bearish Dragon trend line that could be the initial trigger that gets it started to going down all the way to an 88.6% retrace or lower even. One can only speculate that the money exiting this facility will lead to more trading of short term debt on the open market, which could eventually lead to yields coming down overall and for all of this excess liquidity to chase Equities instead as the value of the US Dollar declines due to the shock of all this newly added supply of liquid cash to the open market thereby causing a loosening of market conditions.

W2 Monetary retraction model FED is rapidly pulling cash out of the system
leading up too the debt ceiling default date on the 5th of June
This big pull should of happend way earlier
You see the covid massive melt up and now we are pulling cash out
I doubt we hit COVID lows
Just want to post my model at mid price and see how much cash we pull out before
We inventively print again

Bitcoin has ouptaced every other asset over the last decadeIf you zoom out further - Bitcoin cant be overlayed as the other indices appear as horizontal lines; go figure!

🔥 Is The Bitcoin Halving Causing Bull Markets? New Theory!The classical Bitcoin theory about halvings is that they "cause" bull-markets because the supply mined gets halved, leading to a negative supply shock and therefore increasing the value per Bitcoin.
This is not a surprising theory since it makes a lot of sense and has worked in the past. But, is the halving really that important for the Bitcoin price?
I've plotted the balance sheets of the largest central banks in white. If this line goes up, it indicates an expansion of the balance sheet (Quantitative Easing / QE), which can roughly be interpreted as printing money. It appears that Bitcoin bull- and bear-markets are highly correlated with central banks expanding their balance sheets. White line goes up, BTC goes up, white line goes down (or sideways) BTC goes down.
I've marked two previous occurrences where the central banks started QE in purple. Bitcoin arguably started the bull-market from those points, and not once the halving (yellow) took place.
From this chart we can conclude that the Central Banks are a decisive factor in the start and end of Bitcoin bull markets. Sure, the halving is a highly anticipated event among retail investors and manages to revive the interest into crypto, but I'd argue that QE (= a better investing climate) is the main reason why Bitcoin goes up and down in cycles.
In other words, we can have a BTC bull-market during a period of QE without the halving taking place. We can't have a bull-market after the halving without QE.
If you enjoyed this analysis, please give it a like. Share your thoughts below 🙏

U.S. National Debt U.S. default
A topic that has been stirring people's minds in recent months is the U.S. debt ceiling. The general public is asking the question:
"Will the national debt ceiling be raised or will the U.S. default?"
The national debt is the result of the government's financial borrowing to cover the budget deficit. And, as you might have guessed, these borrowings must be paid for.
For the last ~100 years, the U.S. has existed on borrowed capital by placing Treasury bonds. And there is a purely nominal borrowing limit, which in fact America has raised 45 times in the last 40 years so that it can borrow more and more and more. And if they don't, the Treasury will no longer be able to issue debt securities and will only have to cover their expenses with cash balances from their balance sheet.
Spoiler: no money to pay off your own debt
💡Logical conclusion.
The national debt ceiling will be raised anyway, and all the current discussions have only political overtones and have nothing to do with the real economic model of the states. Consequently, no teeth-grinding default and collapse of the global financial system should be expected
How will the increase in state debt affect the cryptocurrency market?
-If you're interested, put +
www.usdebtclock.org
Best regards EXCAVO

Tim's Guess for Mortgage Rates for 2023I thought I would publish this "guess" for the sheer entertainment value to show the dramatic increase in mortgage rates and to put in perspective the damage that has likely been done to the purchasing power of home buyers.
The Fed has engineered an attempt to shut down an excessive spending to cool the economy down and we are all waiting for reverberations to indicate that they have been successful.
M2 money supply, which I will add on a follow-on chart, is declining at a sharp rate which is indicative of recession ahead. I believe this M2 money supply contraction is a sign that mortgage rates will fall and here is a "guess" just to put a guess out there.
There is 1 datapoint per week for this series and you can see the box that represents a week as shown with a gray box around the blue line.
I added the 2008 contraction for reference.
Let's see what happens.
I hope this is wrong because it will mean that the economy is falling sharply, but also it would imply that the Fed believes it will have conquered inflation.
Tim West
April 26, 2023 9:54AM

GDP and yieldsGDP to accelerate MUCH faster.
Yields to accelerate MUCH faster.
#gdp #gold #inflation #yields
paradigm shift breakout line
GDP's 5 year rate of change track 10 year yields

Prediction of Copper prices till 2028Using data from 2001 I identified 3 distinct commodity cycles. After measuring the length and amplitude of the cycles I averaged them to get average cycle length, average cycle difference in high to low price, and average cycle difference in low1 to low2 price. Using this data I created ratios for difference in high to low price/Time and the difference in Low1 to Low2 price/Time and vice versa. Using these ratios I then predicted the next cycle low which came out to be around march of 2026 and falling to $6,237.24 per metric ton of copper. I then used the ratio of the difference in high to low price/Time to determine where prices will be in 2028 which would be 692 days from the previous cycle's end. This came out to be $7879.74 per metric ton of copper.
This was for a school project in regards to Barrick Gold's mining endeavor in Pakistan

M2 inflationUse rate of change on instruments that generally trend in only one direction over long periods.
Markets react and price-in accelerations or decelerations in that change.
#inflation #moneysupply #gold #spx

US banking crisis affects more than just banksIn the high-end dialogue session of the Tsinghua Wudaokou Global Financial Forum, Zhu Min, former vice president of the International Monetary Fund and former vice governor of the People's Bank of China, had a conversation with Ray Dalio, founder of Bridgewater Associates, on the US banking crisis, the Fed's policy path choices and Hot topics such as the impact of inflation and the causes of inflation will be discussed. Regarding the U.S. banking crisis, Ray Dalio said it is important to realize that this is a pervasive problem that affects more than just the banking industry and that it is currently affecting many banks because many of them have bought government bonds . But many entities actually bought government bonds. And, it's not just US entities that buy US government bonds, but also European entities that buy European bonds because of monetary policy, etc.

$WM2NS -And Always Remember ...
And Always Remember NOT TO :
- LIVE for it
- DIE for it
- Turn yourself in to a SLAVE for it
- Sell the most precious Asset owned, Your TIME
- Fall in LOVE with it
- Get BLINDED by it
- Be GREEDY for it
- Do others WRONG to own it
- Betray OTHERS TRUST to own it
- Put others DOWN if in abundance you own it
- FORGET your LOVED ONES for it
You and I BOTH Got to be CAREFUL,
this is a mutual reminder to my self and you.
I love you !
Don't be Miserable !
DO NOT ALLOW THE EVIL of the Money TRAP You
Dearly take all these advices and hold them close in to your heart .
Have seen people act upon all upmentioned criterieas !
People who let THE EVIL OF MONEY take the best of them.
Don't be like them people ,
I LOVE YOU
NEVER FORGET :
THEIR MONOPOLY OF MONEY IT'S A BIG FACADE !
IT'S A VERY WELL DESIGNED GAME TO KEEP US IN CHECK , TRAPPED AND MISERABLE
TO ENSLAVE US AND MAKE OUR LIFES GO IN VAIN IN ORDER TO OWN IT IN ABUNDANCE OF WHAT THEY SIMPLY PRINT CREATING INFLATION HURTING US

total public debt * fed fund rate / goldEven priced in gold, total public debt * fed fund rate is in at CRITICAL historical levels.
GENERATIONAL BOTTOMS for gold are forged at these levels.
#Gold #Silver

Minimum Wages priced in OilWhile minimum wages have gone up over the years, they are not out pacing energy costs right now.
Minimum Wages priced in Crude Oil.
Breakdowns coincide with #Spx stagnation & bull era for #CrudeOil, #Gold, #Silver, #Uranium, #Copper and #Platinum.

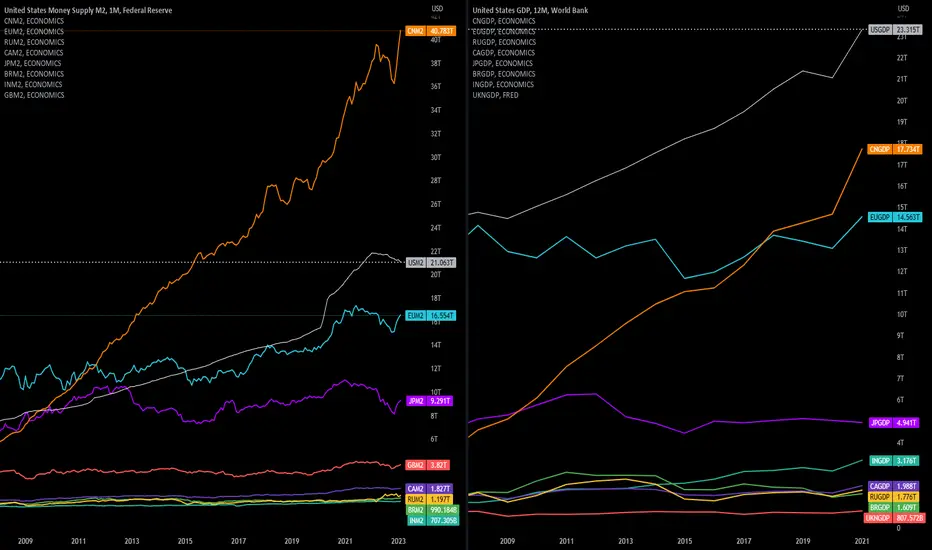
GDP & Money SupplyThe trajectory of global GDP & Money Supply keeps going up. The World's GDP was 103.86 trillion in 2022 and is forecasted for 112.6 trillion in 2023. As of Nov. 28, 2022, the total global value of the M2 money supply is $82.6 trillion.
Gross domestic product (GDP), is an estimate of the total value of goods and services produced in a country during a specified period, it is currently calculated yearly to understand the growth metrics of the country. The calculation is based on nominal GDP, also called GDP at current prices or in value. Countries by GDP is the single most indicator to capture economic activity of all the countries.
The largest economies and top 10 countries by GDP in the world are United States, China, Japan, Germany, India, United Kingdom, France, Canada, Russia & Brazil. The United States economy is the largest in the world, measured by nominal GDP, followed by China, the world's second largest with annual growth that consistently outpaces the United States. Below is the latest top 20 list of Countries by GDP, ranked as per the economic activity of each country in 2023.
Rank 2022 2023 2024
1 USA 25,035.164 26,185.210 27,057.202
2 China 18,321.197 19,243.974 20,699.148
3 Japan 4,300.621 4,365.976 4,568.729
4 Germany 4,031.149 4,120.242 4,337.385
5 India 3,468.566 3,820.573 4,170.220
6 UK 3,198.470 3,479.468 3,757.403
7 France 2,778.090 2,806.690 2,932.363
8 Canada 2,200.352 2,326.620 2,420.683
9 Russia 2,133.092 2,136.222 2,146.696
10 Brazil 1,894.708 2,059.443 2,200.916
11 Iran 1,973.738 2,044.152 2,135.731
12 Italy 1,996.934 1,991.008 2,059.410
13 South Korea 1,734.207 1,792.467 1,879.043
14 Australia 1,724.787 1,787.948 1,837.686
15 Mexico 1,424.533 1,476.407 1,527.077
16 Spain 1,389.927 1,421.012 1,508.902
17 Indonesia 1,289.429 1,388.683 1,506.988
18 Netherlands 990.583 1,019.762 1,076.955
19 Saudi Arabia 1,010.588 996.390 1,016.690
20 Turkey 853.487 941.551 1,037.858
(Source "populationu GDP List Updated Jan 2023 IMF gdp data in Oct 2022")
How Money Supply Is Measured:
M0: Referred to as the monetary base, M0 includes all the money in circulation, including money banks hold in reserve. According to the Federal Reserve, there was about $2.3 trillion in circulation as of January 2023.
M1: It includes all the M0 money supply, adding the money held in travelers’ checks, demand deposits, other types of checkable deposits and negotiable orders of withdrawal. As of January 2023, the seasonally adjusted stock of M1 totaled $19.64 trillion.
M2: It includes all of the currency from the M1 money supply, and expands to include mutual funds, smaller time deposits, money market securities and other types of time deposits. M2 currencies are usually less liquid than M1, meaning you can’t convert M2 money into cash as easily. The total stock of M2 was $21.27 trillion in January.
M3: It includes all the elements of M2, plus institutional money market funds and large time deposits. As compared to M1 and M2, M3 assets have the lowest liquidity. The Fed no longer calculates M3.
How Much Money Is in the World?
The total amount of money in the world can be measured and expressed in many different ways, so it’s difficult to give a specific answer.
If you’re curious about the total value of notes and coins in circulation, the Bank for International Settlements estimated it to be 8,275,000,000,000, or $8.28 trillion U.S. dollars, across 20 major countries plus the euro area in 2021, its most recent estimate. Of course, there are nearly 200 countries in the world, so this is just a rough estimate of the most narrowly defined — and perhaps easiest to quantify — category of money.
The global M1 supply, which includes all the money in circulation plus travelers checks and demand deposits like checking and savings accounts, was $48.9 trillion as of Nov. 28, 2022, according to Visual Capitalist. That publication estimated the total value of the M2 supply to be $82.6 trillion.
Money is also present in the form of investments and derivatives. The total market capitalization of just the New York Stock Exchange and Nasdaq is over 48,000,000,000,000 USD as of December 2022, according to Statista. The sum of Market Capitalization of Shanghai Stock Exchange and Market Capitalization of Shenzhen Stock Exchange accounted for 12,360,284,655,000 USD in March 2023. The total market cap of cryptocurrency, as reported by CoinMarketCap, adds another $1.16 trillion to that figure.
(Source "gobankingrates, By Scott Jeffries March 16, 2023")
Central Bank Liquidity vs US MarketsThis chart presents central bank liquidity (credit: @DylanLeClair_ on Twitter for the calculation). It demonstrates a consistent pattern: when global liquidity decreases, the US markets also decline. The chart highlights the notable trend of the Relative Strength Index (RSI), particularly as the US markets attempt to push higher. This information provides insight for investors and analysts, enabling them to gauge market movements and understand the influence of global liquidity changes on the US markets.
AMEX:SPY SP:SPX TVC:RUT TVC:DJI NASDAQ:NDX

us house price indexInteresting Unknown Fact:
US house price index (priced in #gold) peaked in 2001.
Peak house price (in real terms) was over 20 years ago...
