Economy

$EUIRYY -Europe CPI (April/2025)ECONOMICS:EUIRYY
April/2025
source: EUROSTAT
- Consumer price inflation in the Euro Area remained steady at 2.2% in April 2025, slightly exceeding market expectations of 2.1% and hovering just above the European Central Bank’s 2.0% target midpoint, according to a preliminary estimate.
A sharper drop in energy prices (-3.5% vs. -1.0% in March) was offset by faster inflation in services (3.9% vs. 3.5%) and food, alcohol, and tobacco (3.0% vs. 2.9%). Prices for non-energy industrial goods rose by 0.6%, unchanged from March.
Meanwhile, core inflation, which excludes food and energy, climbed to 2.7%, up from March’s three-year low of 2.4% and above the forecast of 2.5%.
On a monthly basis, consumer prices increased by 0.6% in April, matching March’s rise.

JET FUEL & RecessionJet fuel has already pulled back significantly, which would normally be good for airlines. Not this time. Jet fuel pulling back with airlines signals a recession is on the horizon.
Keep an eye on this one.
Click boost, follow, and subscribe for more!


$JPINTR -BoJ Holds Rates but Cuts GDP Growth Outlook (May/2025)ECONOMICS:JPINTR
May/2025
source: Bank of Japan
-The Bank of Japan (BoJ) kept its key short-term interest rate at 0.5% during its May meeting, in line with expectations.
The unanimous decision came amid growing concerns over the impact of U.S. tariffs.
In its quarterly outlook, the BoJ slashed its FY 2025 GDP growth forecast to 0.5%, from January’s estimate of 1.0%.
The growth outlook for FY 2026 was also lowered to 0.7% from the prior forecast of 1.0%.

Jaws closingThe high yield (junk bond) spread against Treasuries, having earlier moved above the important 4% threshold, continues to advance higher. It has now eclipsed 5%. Accompanying this indicator is the $SPY decline which has caused these "jaws" to move closer to closure. Maintain risk management and stay aware for signs of reversal.

If the US unemployment rate closes above 4.2%..If the US unemployment rate closes above 4.2%..
Things could get real ugly, real fast.
See 2008 crisis.

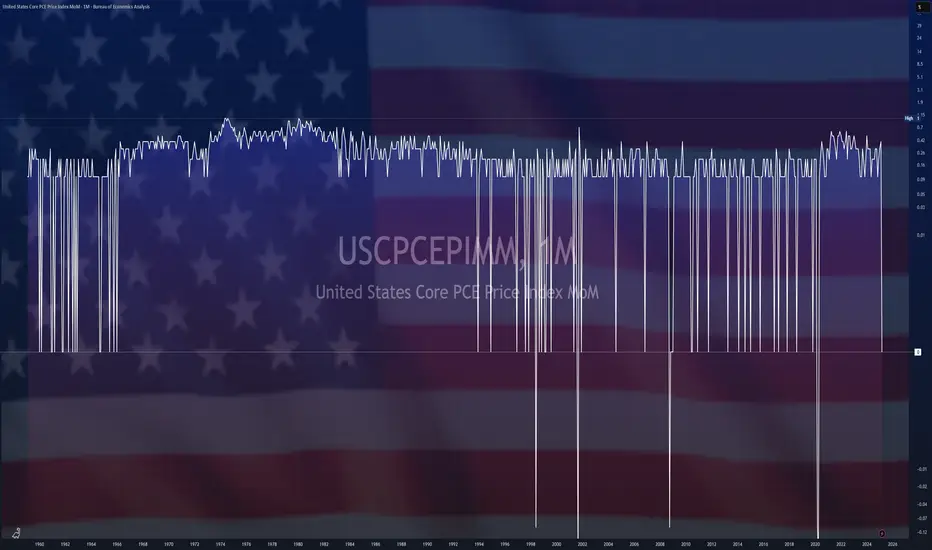
$USPCEPIMC -U.S PCE Inflation Slows as Expected (March/2025)ECONOMICS:USPCEPIMC -U.S PCE Inflation Slows as Expected (March/2025)
ECONOMICS:USPCEPIMC
March/2025
source: U.S. Bureau of Economic Analysis
-The personal consumption expenditure price index in the US was unchanged in March from February 2025, the least in ten months, and following a 0.4% rise in each of the previous two months, in line with expectations.
Prices for goods fell 0.5%, after a 0.2% increase in February and prices for services went up 0.2%, easing from a 0.5% rise.
Meanwhile, the core PCE index, which excludes volatile food and energy prices, was also unchanged, compared with forecasts for a 0.1% increase.
Separately, food prices rose 0.5% (vs a flat reading) while prices for energy goods and services dropped 2.7% (vs 0.1%).
Finally, the annual PCE rate decreased to 2.3%, the lowest in five months, and the annual core PCE inflation also eased to 2.6%.
$EUGDPQQ -Eurozone GDP Growth Rate Beats Forecasts (Q1/2025)ECONOMICS:EUGDPQQ
Q1/2025
source: EUROSTAT
-The Eurozone economy grew by 0.4% in the first quarter of 2025,
accelerating from 0.2% in the previous quarter and exceeding market expectations of 0.2%.

$USGDPQQ -U.S Economy Unexpectedly Contracts in Q1/2025ECONOMICS:USGDPQQ
Q1/2025
source: U.S. Bureau of Economic Analysis
-U.S economy shrank 0.3% in Q1 2025, the first contraction since Q1 2022,
versus 2.4% growth in Q4 and expectations of 0.3% expansion, as rising trade tensions weighed on the economy.
Net exports cut nearly 5 percentage points from GDP as imports jumped over 40%. Consumer spending rose just 1.8%,
the weakest since mid-2023, while federal government outlays fell 5.1%, the most since Q1 2022.

M2 Money Supply W/ Trix As M2 money supply breaks out here is an interesting look back. Since 1959 the Trix indicator has never crossed below the zero line until late 22 early 23 signaling the biggest contraction in money supply since the mid 90s after recording the largest expansion recorded post plandemic. Now with it back above the zero line and supply ticking above previous highs, will we see normal rate of expansion, or will these recent readings become the new norm? Regardless, the fiat printers will not stop as the chart clearly shows up and to the right. This is why Bitcoin exist and why governments cannot be trusted no matter who is charge, the printer is always warmed up and ready to go brrrr.

$CNGRES -China's Gold Reserve (Q4/2024)ECONOMICS:CNGRES
Q4/2024
2.280 Tonnes
source: World Gold Council
- Gold Reserves in China increased to 2279.56 Tonnes in the fourth quarter of 2024 from 2264.32 Tonnes in the third quarter of 2024.
Gold Reserves in China averaged 1216.76 Tonnes from 2000 until 2024,
reaching an all time high of 2279.56 Tonnes in the fourth quarter of 2024 and a record low of 395.01 Tonnes in the second quarter of 2000.

Relative Yield Curve InversionInstead of just measuring absolute Yield Curve inversion, we take the curve relative to current interest rates to understand just exactly how inverted we are proportionally to the era we are in.

$EUINTR - ECB Lowers Interest Rates by 25bps (April/2025)ECONOMICS:EUINTR - ECB Lowers Interest Rates by 25bps (April/2025)
ECONOMICS:EUINTR
April/2025
source: European Central Bank
- The European Central Bank lowered interest rates by 25 basis points on Thursday, as expected, marking the sixth consecutive cut since June and bringing the key deposit rate down to 2.25%.
Policymakers noted that the disinflation process is progressing well and dropped previous references to a "restrictive" policy stance, while cautioning that the growth outlook has worsened amid escalating trade tensions.

$GBIRYY - U.K CPI (March/2025)ECONOMICS:GBIRYY 2.6%
March/2025
source: Office for National Statistics
- The annual inflation rate in the UK slowed to 2.6% in March 2025 from 2.8% in February and below market and the BoE's forecasts of 2.7%.
The largest downward contributions came from recreation and culture (2.4% vs 3.4%), mainly games, toys and hobbies (-4.2%) and data processing equipment (-5.1%). Transport also contributed to the slowdown (1.2% vs 1.8%), largely due to a 5.3% fall in motor fuel prices.
In addition, prices rose less for restaurants and hotels (3%, the lowest since July 2021 vs 3.4%), mostly accommodation services (-0.6%); housing and utilities (1.8% vs 1.9%); and food and non-alcoholic beverages (3% vs 3.3%).
In contrast, the most significant upward contribution came from clothing and footwear (1.1% vs -0.6%), with prices usually rising in March as spring fashions continue to enter the shops.
Compared to the previous month, the CPI edged up 0.3%, slightly below both the previous month’s increase and expectations of 0.4%.
Annual core inflation slowed to 3.4% from 3.5%.

$CNGDPYY -China's GDP (Q1/2025)ECONOMICS:CNGDPYY 5.4%
Q1/2025
source: National Bureau of Statistics of China
- China’s economy grew 5.4% year-on-year in Q1 of 2025,
maintaining the same pace as in Q4 and exceeding market expectations of 5.1%.
It remained the strongest annual growth rate in 1-1/2 years amid Beijing's ongoing stimulus.
The latest GDP readings were also buoyed by robust March activity:
industrial output rose at its fastest pace since June 2021, retail sales posted the biggest gain in over a year, and the surveyed jobless rate eased from a two-year high.
Fixed asset investment also slightly surpassed expectations in the first quarter.
On the trade front, exports recorded their strongest growth since October as firms accelerated shipments ahead of looming tariffs, while a drop in imports narrowed.
The statistics bureau said the Chinese economy was “off to a good and steady start” and highlighted the growing role of innovation.
However, intensifying trade tensions with the U.S. have quickly darkened the outlook, increasing pressure on Beijing to roll out additional support measures.

Gold Skyrockets Like It's 2011: Are We There Yet?Gold has been on a powerful run since breaking above the 2100 resistance level in March 2024. After just one year of relentless gains and a return of over 60%, it has become one of the top-performing assets. But the big question now is: how far can this rally go? To the moon?
It's difficult to predict how far prices can climb during these kinds of parabolic moves. In 2011, the final green monthly bar alone rose 17% from open to high. These FOMO-fueled surges often lead to euphoric tops followed by painful bear markets. So, are we there yet?
Since Richard Nixon ended the dollar's gold backing and introduced the modern fiat system, gold's status as a safe haven has become even more prominent. Whenever there are heightened risks, whether geopolitical, fiscal, or related to the fiat money system, investors tend to flock to gold. The 2011 rally was a clear example of this. After the 2008 financial crisis and the quantitative easing that followed, gold became the go-to asset for both preserving value and speculative opportunity.
A similar pattern has unfolded following the COVID-19 shock. The Federal Reserve returned to aggressive quantitative easing, while both the Trump and Biden administrations increased fiscal spending, including direct payments to households. This surge in money supply and concerns about fiat stability, along with rising government debt, helped trigger another major gold rally. With the added risk of a trade war, the rally has accelerated further, pushing gold beyond 3300 and creating a situation that closely mirrors 2011.
Looking at the money supply-to-gold ratio and the US federal debt-to-gold ratio, gold now appears to be testing trendline levels. Its recent surge has made metrics like M2 and federal debt seem relatively smaller, which may be a sign that the rally is approaching exhaustion.
Still, history shows that final euphoric moves can stretch even higher before a true top is formed. Rather than trying to predict the peak, it's often better to wait for signs of price stabilization. Gold typically offers a second opportunity, often forming two peaks with the second lower than the first, before entering a bear phase.
In 1980, gold fell more than 60% within two years. After the 2011 top, it declined nearly 40%. Even if the retreat expected to be milder this time, gold could still offer a 20% or greater downside opportunity once the top is in.
Smart money has already started to take profits gradually. Net managed money positions in the COT report have decreased by 40% since January, as we discussed in our earlier post:

T10Y2Y 3M chart: Plotted US recessions since 1980US recessions since 1980 plotted on the T10Y2Y 3M chart.
Orange circles indicate value on the curve and the Stoch RSI value at the start of the first month and year of recession.
Red vertical bars are length of recessions.
Orange vertical lines on the Stoch RSI are the first month and year of the start of the recession.
Good luck traders.

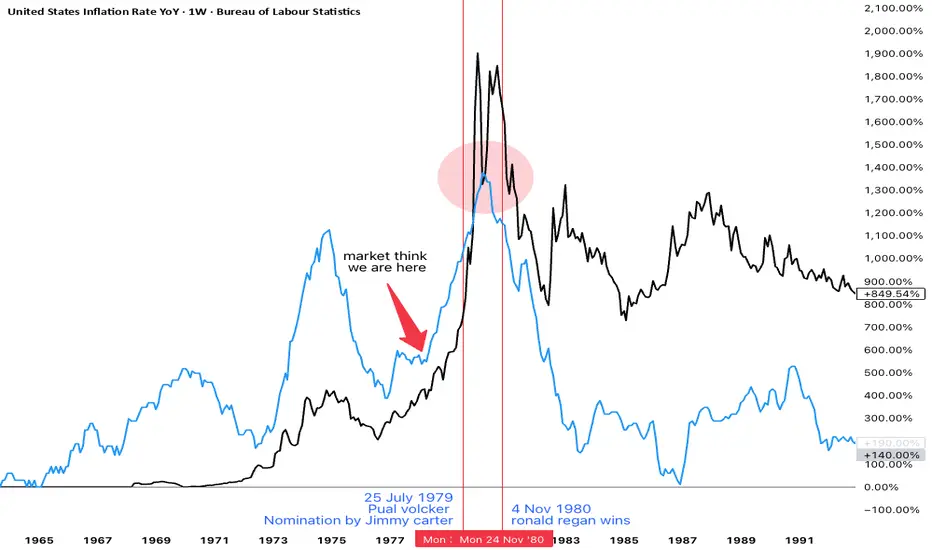
gold and inflation in 1970s stagflation fomc member repeatedly saying this is not stagflation like 1970s
but gold bug on social media constantly pump stagflation narrative after gold historic run from $2000 to $3000 in just one year
with usa cpi and gold chart in one image you can get idea
how gold moved in last stagflation crisis with big political news : when paul volcker comes into fed and when Ronald Reagan wins election
gold first makes double top before multi year bear market
inflation peaked after volcker get fed control but before election result.
is this is really replay of 1970s ?
we got same old president trump and same old fed chair powell
✅ biden forced fed to do big size 50bps cut pre election to choose inflation over higher unemployment which is stagflation
✅ in his first term trump in election year March 2020 use covid as excuse to cut 0% and do QE and trillion dollar fiscal policy stimulus check. choosing inflation over high employment which is stagflation but it was biden who has to face most of the inflation spike to 9%
✅trump raise tariff to 100 years high to choose high employment over inflation which is recession
✅ in next 4 years it will be clear is this replay of 70s or not.
in future we will have more inflation and gold price data to confirm
Gold & Silver miners can smell the recession.Gold & Silver miners can smell the recession.
Can you?
7 year rate of change for unemployment


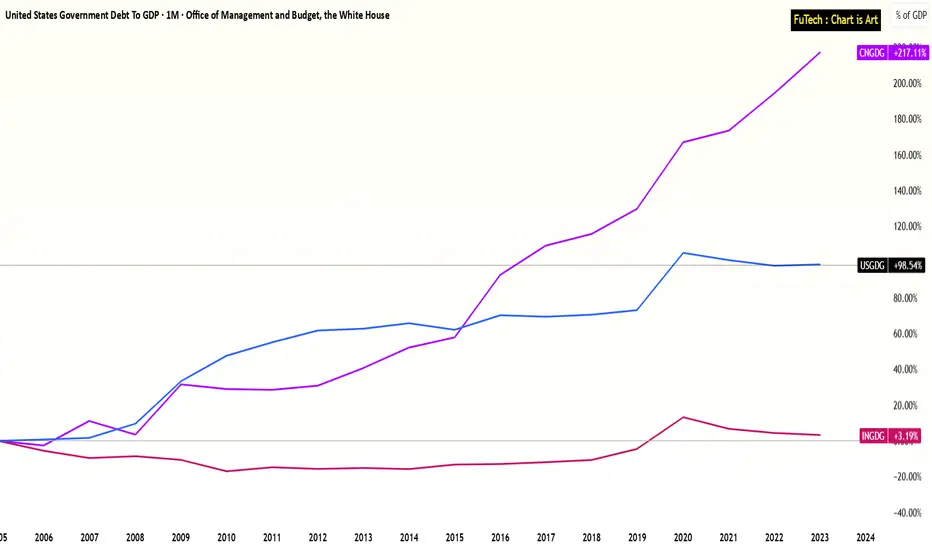
India, USA, China - Government Debt to GDP PerformanceIndia’s Fiscal Discipline Stands Out in a High-Debt Global Economy
Government Debt to GDP Performance Over the Last 20 Years:
China: +217%
USA: +99%
India: +3%
Over the last 2 decades, global economies have increasingly relied on debt to stimulate growth and manage crises.
However, a closer look at long-term Debt-to-GDP trends reveals a stark contrast in fiscal discipline among major economies:
-----------------------------------------------------------------------
India: A Beacon of Fiscal Stability
India has maintained remarkable fiscal discipline, with government debt increasing by just +3% relative to its GDP over the past 20 years.
This demonstrates India’s conservative borrowing strategy, especially notable given the country’s ambitious development goals, infrastructure push, and welfare programs.
This level of restraint positions India well in the face of rising global interest rates and inflation risks.
-----------------------------------------------------------------------
USA: Steady Climb Amid Stimulus Spending
The United States has seen a +99% increase in its debt-to-GDP ratio over the same period, driven by successive rounds of stimulus, defense spending, and entitlement obligations.
While the U.S. enjoys the unique advantage of issuing the world’s reserve currency, the long-term implications of rising debt—especially as interest payments rise—pose potential challenges to fiscal sustainability.
-----------------------------------------------------------------------
China: Debt-Fueled Expansion
China’s debt-to-GDP has surged +217% over the past two decades, reflecting its aggressive infrastructure-led growth model and significant off-balance-sheet local government borrowing.
While this has powered China's rapid urbanization and industrial growth, the mounting debt burden raises questions about long-term efficiency, default risks in the shadow banking sector, and the need for deleveraging.
-----------------------------------------------------------------------
🔍 Key Insights:
1) India’s 3% debt growth over 20 years highlights an underleveraged economy, offering headroom for targeted fiscal expansion if needed.
2) In a world where debt sustainability is becoming a key investment theme, India stands out as a relatively safer macro environment.
3) This fiscal prudence complements India’s improving trade metrics and strengthens its position in global economic leadership.
-----------------------------------------------------------------------
📈 Conclusion:
As the global economy grapples with inflation, rising interest rates, and debt concerns, India’s modest rise in government debt is a key macro strength.
While China and the USA have seen significant increases in their debt burdens, India’s fiscal balance provides confidence to both investors and policymakers for future growth cycles.
This makes India an attractive long-term investment destination in a world of rising uncertainty.
India, USA, China - Trade Deficit Performance after Covid PhaseIndia’s Trade Deficit Nearing a Turning Point – Strong Growth Amid Global Shifts
Trade Deficit Performance Over the Last 5 Years:
India: -10%
USA: -215%
China: +359%
Over the past five years, global trade dynamics have shifted significantly, with India showing promising signs of a turnaround in its trade performance.
India: A Rounding Bottom Pattern?
India’s trade deficit has improved by -10% over the last five years, hinting at a potential rounding bottom pattern that could transition into a trade surplus in the coming years.
This positive shift comes despite global economic headwinds, positioning India as a resilient and emerging export player.
USA: Longer Road to Recovery
In contrast, the United States has seen its trade deficit worsen by -215%, suggesting a deeper structural challenge in its trade balance.
While the U.S. economy remains strong in other metrics, its export-import imbalance will likely take more time and policy adjustments to stabilize.
China: The Export Powerhouse slowdown after Tariffs sanctions ?
China continues to dominate with a staggering +359% improvement in its trade surplus over the past five years, solidifying its position as the world’s top exporter.
However, rising global tariffs and geopolitical tensions could gradually redirect supply chains.
🌏 Macro Implications:
Tariff Realignment: As global companies look to diversify away from China amid escalating tariffs and political tensions, India is emerging as a key beneficiary.
This realignment could significantly bolster India’s export sector.
India’s Growth Story: With structural reforms, expanding manufacturing capabilities, and supportive government policies like PLI (Production-Linked Incentives), India is well-positioned to capture a larger share of global trade flows.
Global Slowdown, Local Resilience: Despite a global economic slowdown, India’s improving trade dynamics signal strong internal momentum and a maturing economy.
📈 Conclusion:
India is on the cusp of a major trade shift.
While China remains the global leader in exports and the USA faces growing imbalances, India’s improving trade performance, geopolitical advantage, and manufacturing push make it a compelling long-term trade and investment story.
Amid Tariffs war and global economy slowdown, India's growth story continues...
