Total Public Debt versus Debt Held by Foreign InvestorsGuys, if I may chime in. Whenever I see 2 instruments overlaid on a chart, my reflex is to see how they perform vs each other.
You'll often find out that ratio is the Rosetta Stone you were looking for!
#debt #dxy #usdollar #fintwit
Economy

Eggs priced in SilverEggs priced in silver breaking out.
Targeting all-time highs.
#EggShortage #Silver #Fintwit

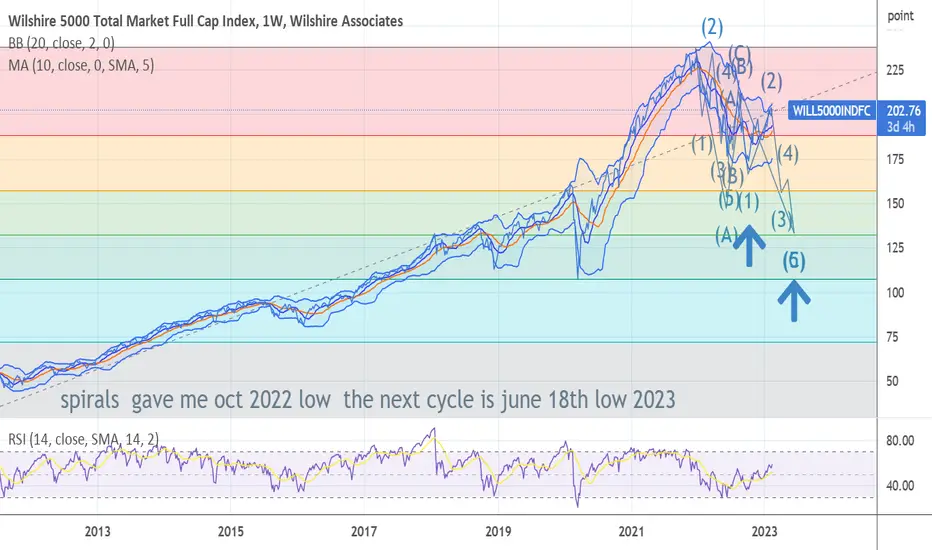
STILL 100 % of track NEXT LEG OF THE BEAR IS ABOUT TO START I am now getting another major sell model long term sp 500 to total Long term bonds is been given in my models I personally have moved into 6 month and 1 year till bills today I manage six large trusts And told my group to shift All funds into insured accounts I will be moving to 50 to 75 % % short on any rally into 4183 and 100 % at 4212/4222 or on a stop of 3988 . sp 500 to bonds ratio is near BELL RINGING now as of today I see the lows of dec and oct taken out I have two targets based on the cycle low projection 3510/3490 . . I came up with in dec 2021. target is 3390/ is the alt the main target is 2785/2985 the decline should be in time cycle march low 2024 and should unfold in another clear 5 waves .. BEST OF TRADES ! WAVETIMER
UK Inflation drop to 5 month low at 10.10% - Still crazy high!The UK inflation rate has dropped to a 5-month low of 10.1%.
This tells us that the peak inflation may be behind us.
The decrease in transport costs, as well as restaurants and hotels, were the main drivers of the lower inflation rate.
However, if we compare it to other developed nations like the US, France, and Germany - the UK's inflation rate is still quite a bit higher.
Now we need to see the Bank of England (BoE) to keep taking action to drop the inflation and interest rates.
I mean an inflation rate of 10% or higher is still crazy!

8 year rate of change for Shelter component of CPICPI "Shelter" Monthly Log Chart seemingly just keeps going up... but the rate of change gives better clues to what is actually happening.

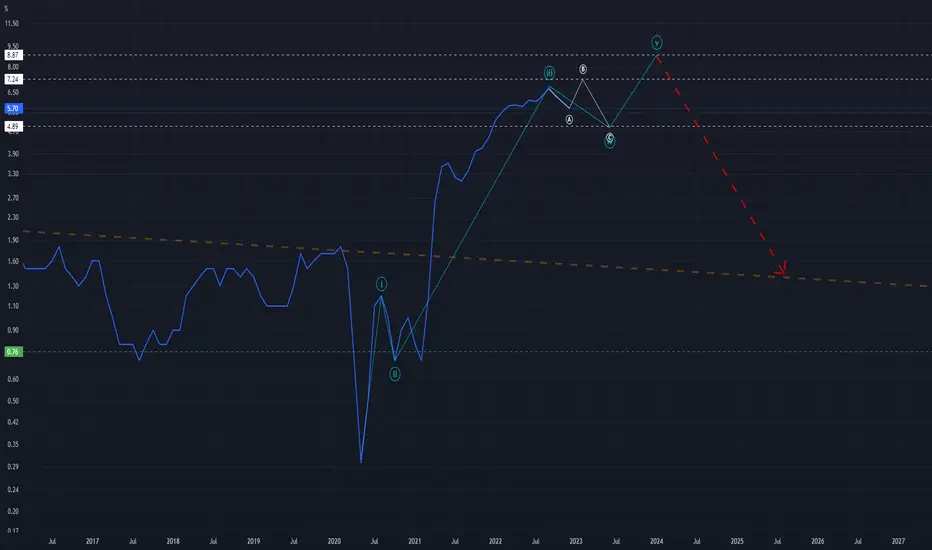
Elliott Wave Science Meets the Consumer Price IndexIt would be awesome if TradingView offered a candlestick chart for CPI but considering its only updated once per month, maybe the line graph/chart is the best option (not sure how that works). As for the data available to me, I've done a best effort markup using the science of Elliott Wave Theory. Considering the fluctuations seen on the M(onthly) chart, I believe its possible that CPI is sitting in the midst of a shallow Wave 4 correction. With this in mind, I find it possible that the number stretches into the low-mid 7.xx range between now and March. From there we may see a 2023 low within the 4.xx level.
I will share my thoughts here as I know there is much interest in "what will the CPI numbers be?"... Being that this CPI data is directly based on the actions of humans and the habits that we act on, it should work pretty well with Elliott Wave Theory. I will keep this post fluid and apply analytical updates as monthly results are publicly announced.
Remember these three important things: 1) trade the chart instead of the news and 2) stay safe /3) don't drown!
GDP to public debt is going higherI can see more financial easing coming. They have to. They broke something in 08 that can not be fixed. the can will be kicked down the road until the roast the dollar. Global depression coming, but before then, I expect a massive bull market. The global depression most likely wont come until late 2029-2032 time frame. Are these dates starting to make sense?
1907-bank failure
2007- bank failure
1919-spanish flu
2019- covid
1929- epic crash/ global depression
2029?????????????????????????????????????
BTC to 500k min until then, but do you sell then or hold after the world is in shambles??????? who knows>
scary times, lets make money until the chickens come home to roost tho

If there was ever a sign that says follow the fedI am watching this closely. This will tell me if I can remain bearish or if I should flip bullish. I can not express in words how important this is, especially if you understand what this chart means......

an update on central bank liquidities
central bank balance sheets
central bank rates
central bank - mandate - inflation
central bank - mandate - employment

USCIR may decrease soonAccording to TA I expect to see am inflation rate drop to 4.6 / 3.95 / 3.36 or anywhere in a green box I created. Hope I am right.

US Inflation rate YoYIt is amazingly hit the resistance just in time. Hope it is going back to the mean level asap.

Comparing 2008 US Bankruptcies to 2023 US BankruptciesComparing 2008 US Bankruptcies to 2023 US Bankruptcies
The fractals contain so many similarities. Buckle up buttercup!

Daily Analysis: Tech weak today, as capital rotates defensively.We discuss all the major indices and markets.
SPY
QQQ
DXY
Yields
Gold
Bitcoin
Inflation

When to Buy Real Estate Investing in 2023This video is my strategic analysis for when I will be looking to buy my next real estate investment property. I use the Cash-Shiller Index, CPI, and charting techniques of mean reversion to create indicators I will follow in the years ahead as real estate trends downward following the rise in mortgage rates and fall in home prices.

A SP500 low has NEVER happened before a recession. Since 1969, these events have happened in this order 100% of the time.
1) Unemployment bottoms and begins to rise
2) Recession
3) #SP500 makes a new low
Watch this video for a better explanation.

USINTR - still in a upside trend ( wth 30yr backtesting)
*High winning rate with backtesting by my strategy
Right now ECONOMICS:USINTR is still in the upside trend.
This means that it has been consistently performing poorly and may not be a good investment opportunity in the short term.
🔔 Be prepared for reversals.
It's advisable to be patient and wait for the downward trend to occur before the risk market confirms a bullish market again.
Good luck!

Where there is smoke there is 🔥 UK 🏠 prices continue to fallEveryone hates paying higher prices for the things they need, so Nationwide reporting that houses continue to get cheaper is welcome news.
Listen if you got shilled into overpaying for your 🏠 have a chat to your agent but it’s okay if you can afford it… However most can’t. The Bank of England's ZIRP and QE debt-fueled housing bubble Ponzi scheme of the last 13 years is over, and it isn't coming back.

Market bottom September 2024Putting on the same chart the S&P and fed rate the last three market bottoms happened a year and a half after the fed funds rate peaks. (589 days avg.) That would put the next one in September 2024

The correlation between US Interest Rates and The US Dollar (DXYInterest rates and USD strength are positively correlated.
An increase in US interest rates will typically result in a strengthening of the USD.
The reason is...
Foreign investors tend to flock to US assets, such as bonds and fixed bank rates for higher returns.
Higher demand for US assets drives up their price, and as a result, the USD strengthens.
As for the relationship between USD strength and US stock market prices, it is more complex and can have both positive and negative effects.
On one hand, a strong USD can make US exports less competitive, reducing demand and potentially leading to a decrease in corporate profits.
This can weigh on stock prices. On the other hand, a strong USD can attract foreign investment into US stocks, driving up demand and prices.
There are other reasons for the correlation such as:
Interest rate differentials
When interest rates in one country are higher than in another, capital tends to flow to the country with the higher interest rates.
This results in an increase in demand for the currency of the country with higher interest rates, strengthening its currency i.e US Dollar.
Inflation expectations
Interest rates are also closely linked to inflation expectations.
When interest rates rise, it is generally expected that inflation will rise too, which makes the currency more attractive to investors.
Trade flows
The USD is the currency used in most international trade transactions, and as a result, changes in trade flows can have a significant impact on the value of the USD.

Bottom has never occurred before a recession. 1) Recessions (Grey/Green rectangles) have always occurred after the unemployment rate reached a low and began to curve back up (Blue line).
2) The bottom has never been in before a recession (orange circle).
#SPX #NASDAQ #Crypto #Bitcoin #Recession #SPY

SPX Monthly Log Chart since 1967US initial jobless claims HISTORICALLY low.
Tops in US equities are forged at those levels.
FED will only "try" to save the day AFTER initial jobless claims breakout.
That is the "last nail in the coffin" for growth stocks.
#fintwit #spx #fed #fomc $arkk #meta


US inflation - US treasury Rate compared with the seventiesHi All
This fraction of seventies is already for 1 year identical.
US inflation rate minus US treasury rate
