WC: 29.80 Target: 1800-2400 MOASS: 47k-100K: Time to FOCUSAs I reminded everyone in the youtube video earlier this week we are dealing with a large Diagonal structure in GME
There is nothing unusual AT ALL about the decline we saw this week
That is the nature of diagonals
Now we seem to be bottoming again around 30 which if that continues should see price rise to the 38 level then ultimately the 45 region
I also gave you 2 days to watch leading up to and during the week of 06/09:
06/05 and 06/11
Expecting to again see strong volume after those dates
I have no idea obviously but I would also expect The Cat to make an appearance around 06/09..probably on 06/08 if his Sunday posting pattern continues..but who really knows
At the end of the day im just watching FIBS, VOLUME and Indicator Confluence/Divergence
I'll leave the hopium to someone else...i'm strictly business from here out
GOOD TRADING TO YOU ALL

TSLA Honey Ticking Bull Trap!TSLA has a beautiful big ars bear flag! While it should have broken down to trigger a short trade, it decided to Honey Tick people right into a Trap!
It formed a perfect MEGAPHONE in wave 3 up that has now CRACKED! This is a much juicer short setup with the potential of collapsing from here and taking out the entire bear flag and MORE!!
First, we need a lower low and then a lower high and off we GO BABY!!!
Don't Get HONEY TICKED!
As I always say, never EVER!! Invest in toxic people like Elona. They always blow themselves up in the end. It's in their nature!
Click boost and follow, let's get to 5,000 followers. ;)

Dark Pools Explained in Detail and answers to questions.In this discussion you will learn more about how Dark Pool Buy Side Institutions actually work and how they buy stocks in a slow steady accumulation mode based on where fundamentals are in relation to the stock price.
Dark Pools are the Alternative Trading System Venues that are unlit, meaning there are no Market Makers. It is a Peer to Peer Transaction mostly or a Buy Side purchasing stock directly from the corporation.
At times Dark Pools may buy on public exchanges but their orders are always delayed being sent to the National Clearing Houses until well after market close for the day.
This ensures that Dark Pools are never front runned by HFTs or others.
This ensures that the Dark Pools are able to buy vast quantities of stock without paying more than their Quantitative Analysis has determined is the range of price below current fundamentals.
Dark Pools seldom move price more than a few pennies and the TWAPs are spread to ping intermittently over many weeks to months. So huge volume spikes are NOT Dark Pools.
Dark Pools tend to accumulate hudrends of thousands to millions of shares of stock over time.
Dark Pools hold the largest quantities for most big name firms.
To trade with the Dark Pools you must understand their "foot print" on the stock chart as it is often hidden among Smaller Funds selling candle patterns.

$AI is setting up for a 30% move!C3.AI - NYSE:AI Trade Setup
Inverse H&S Breakout that is now retesting.
A bounce here would confirm the breakout and lead to a MM up to $32.59 for a 30% move!

AAPL: Key Levels to Watch for Price DevelopmentAAPL: Key Levels to Watch for Price Development
Apple's stock (AAPL) has been range-bound between $193 and $212.50 for the past two months, repeatedly testing support near $193 on three occasions.
Each time, the price has rebounded strongly, pushing back toward $212.50—the upper boundary of this trading range.
Given this pattern, the likelihood of another move toward $212.50 remains high.
If AAPL successfully breaches $212.50, it could signal a larger bullish breakout, with upside targets at $224.50 and $240, as highlighted in the chart.
You may find more details in the chart!
Thank you and Good Luck!
❤️PS: Please support with a like or comment if you find this analysis useful for your trading day❤️

PLTR 1D — When the tea is brewed and the handle’s in placePalantir’s daily chart is shaping up a textbook cup with handle pattern — one of the most reliable continuation setups in technical analysis. The cup base was formed over several months and transitioned into a consolidation phase, building a rectangle structure where smart money likely accumulated positions before a breakout.
Now here’s the key: price has not only broken out — it’s settled above all major moving averages, including EMA 20/50/100/200 and MA 50/200. The breakout candle was supported by surging volume, signaling strong participation from institutional buyers. When all the averages start bending upwards, it's usually not by accident.
The breakout above the $121 resistance zone unlocked a pathway toward a target at $187 , derived by projecting the height of the cup upward from the breakout level. This kind of structure, once confirmed, often fuels aggressive continuation — and this one’s got the setup locked in.
From a fundamental perspective, Palantir is holding solid ground: strong earnings reports, expanding government and commercial contracts, and aggressive development in AI services. Institutional interest is rising steadily, and that momentum is visibly reflected in price action.
To sum it up: price has launched cleanly out of the consolidation zone, pierced all critical MAs and EMAs, and continues to gain momentum. While the market sips its tea, this cup is boiling hot. Just don’t forget your stop loss — this is a trading desk, not a tea party.
If you enjoy posts like this, drop a like, share it around, and let’s hear your thoughts below. It keeps ideas moving and the content flowing — free, sharp, and relevant.

$ASTS Trade Alert Setup - 26% Upside🚨 NASDAQ:ASTS Trade Alert Setup 🚨
Falling Wedge Breakout at $24.37 =
🎯 $29.07 📏 $30.77
Trading Plan: July 11th $26 Calls on Breakout or shares

GME Repeating Pattern Reloaded - The 2025 GME Squeeze TrackerI believe that GME has a repeating pattern that occurs from time to time. In this case, it is very special because the pattern signals a squeeze. This project tracks this repeating pattern in an effort to predict the general date range of the next GME squeeze.
Three GME squeezes have occurred and we are about to see a 4th run up by early-to-mid August 2025. Here is my GME Squeeze Tracker:
Jan 2021 squeeze in green
May 2024 squeeze in gold
Dec 2024 squeeze in red
Using the title of this post you can search for a more detailed write up that explains this theory fully. I am not allowed to link those details here, and this website does not offer the tools I need to properly duplicate it here.
Get ready for an incredible August for GME!

nvo bullish long Long Setup Idea – Not Financial Advice - AH
This is a long trade setup based on my personal analysis.
The entry, stop-loss, and target levels are outlined for educational and illustrative purposes only.
📈 Entry:
🛑 Stop Loss:
🎯 Target(s):
Disclaimer:
I am not a financial advisor. This idea is shared for educational purposes only and should not be considered investment advice. Always do your own research and manage your risk accordingly. Trading involves significant risk and can result in the loss of your capital.
AH

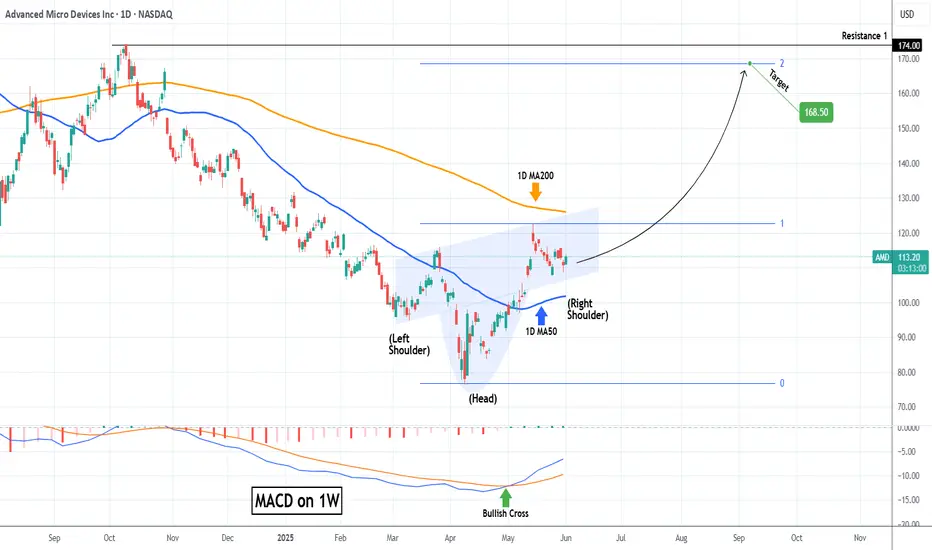
AMD Inverse Head and Shoulders waiting for massive break-out.Advanced Micro Devices (AMD) has entered a wide consolidation range within the 1D MA50 (blue trend-line) and 1D MA200 (orange trend-line) following the May 14 High. From a wider scale, this is technically seen as the Right Shoulder of an Inverse Head and Shoulders (IH&S) pattern.
This is generally a bullish reversal pattern and it is no coincidence that the Head was formed exactly on the market bottom (April 08). With the first long-term buy signal already given by the 1W MACD Bullish Cross, as long as the 1D MA50 holds, a break above the 1D MA200 would confirm the next rally phase.
Technically when the Right Shoulder break-outs take place, they target the pattern's 2.0 Fibonacci extension. That's now exactly at $168.50 and this is our medium-term Target.
-------------------------------------------------------------------------------
** Please LIKE 👍, FOLLOW ✅, SHARE 🙌 and COMMENT ✍ if you enjoy this idea! Also share your ideas and charts in the comments section below! This is best way to keep it relevant, support us, keep the content here free and allow the idea to reach as many people as possible. **
-------------------------------------------------------------------------------
💸💸💸💸💸💸
👇 👇 👇 👇 👇 👇
Trade of the week: $TSLA (Short)Trade of the week: NASDAQ:TSLA (Short)
Current price: $346
Entry Trigger:$339
Stoploss: $353
Call option: NASDAQ:TSLA $300 put expiry 06/20 at $4.45(*1 Contract only)
Thesis: NASDAQ:TSLA is in daily uprising channel aka building a wedge. NASDAQ:TSLA last week made a doji candle on weekly often that leads to reversal. You may take this trade at entry trigger point or You may find a cheaper entry or wait for trigger point (or me) to get into the trade. Contract price might vary depending on entry. Targeting sub $310 in upcoming weeks. Respect stoploss.

Review and plan for 3rd June 2025Nifty future and banknifty future analysis and intraday plan.
This video is for information/education purpose only. you are 100% responsible for any actions you take by reading/viewing this post.
please consult your financial advisor before taking any action.
----Vinaykumar hiremath, CMT

FEROZ LONG (SECOND STRIKE TRADE) 02-06-2025FEROZ LONG TRADE was shared here. ()
FEROZ has resumed its upward trajectory after a healthy correction from its December 2024 high of Rs. 393, retracing close to the 61.8% Fibonacci level — a key support zone.
Bullish technical confirmation:
• Price closed above the 20-Day EMA, signaling short-term strength.
• Higher Low formation, indicating potential trend reversal.
• Increased volumes on the recent up-move, suggesting strong accumulation.
With technical indicators aligning positively, a fresh uptrend appears to be in play. Buy on dips or at CMP for potential upside towards previous highs.
It Hit TP1 and took a pull back. We gave a rebuy call on group during live market hours. Its again in second Pull Back after Targeting 350 (TP1++).
Sharing Second Strike Call.
🚨 TECHNICAL BUY CALL – FEROZ🚨
BUY1: 330-335
BUY2: 322
BUY3: 311
📈 TP1 : Rs. 350
📈 TP2 : Rs. 380
🛑 STOP LOSS: BELOW Rs. 270 (Daily Close)
📊 RISK-REWARD: 1:1.8 (Medium)
Caution: Close at least 50% position size at TP1 and then trail SL to avoid losing incurred profits in case of unforeseen market conditions.
PLEASE BOOST AND SHARE THE IDEA IF YOU FIND IT HELPFUL.

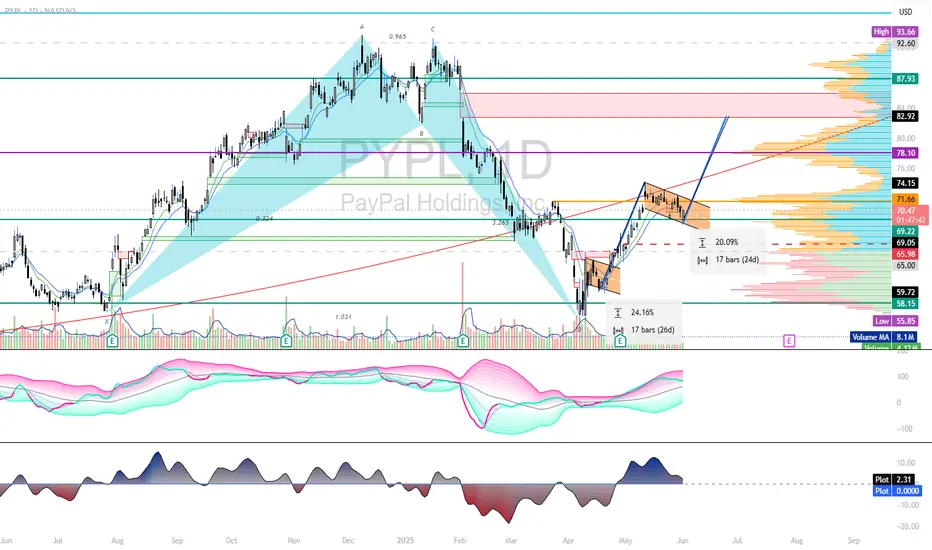
LONG (E-PAY)PAYPALHuge tail on this in larger frames, and another huge hmnc on daily. see flagging into gap...if info TL holds any weight ill find out. tossed coin at NASDAQ:PYPL $80 6-27-25 call @ 0.15; at that price...Why not.
Tesla Bearish Daily Reversal Harmonic Butterfly patternWaiting for the Formation of LHs and LLs
Divergence before the D point confirms Potential Reversal Zone
Hypothetical Calculation of Potential Target Points
A bit of Rare Pattern Bearish Butterfly

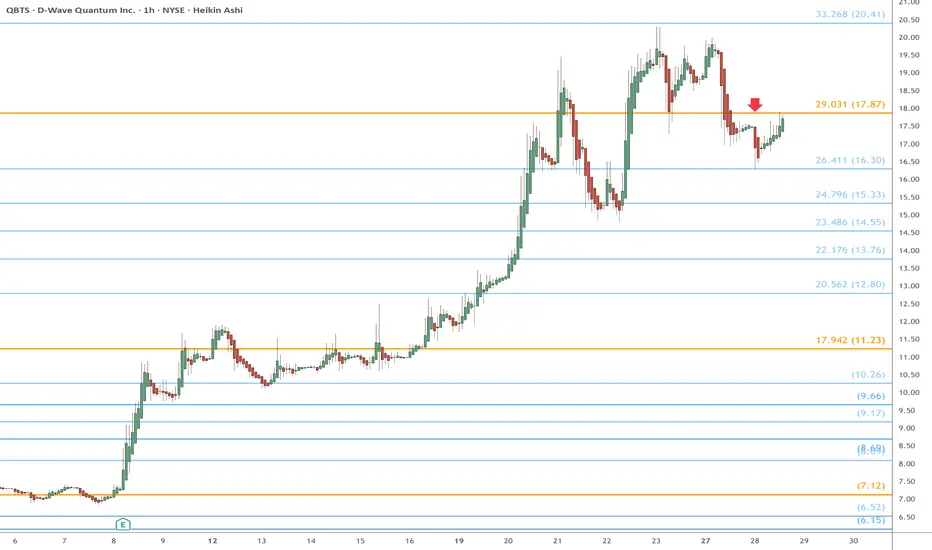
QBTS eyes on $17.86: Golden Genesis fib a "lower high" of top?QBTS and all quantums have been on the rampage.
This one is currently testing a Golden Genesis fib.
Rejection here could mark a "lower high" of the top.
Break-and-Retest would start the next leg of uptrend.
.
Previous Analysis that caught the Break Out:
=================================================
.
NVDA Waiting for the Right DipAfter posting record earnings and riding the AI momentum wave, NVIDIA has finally started to cool off a bit and honestly, it’s healthy. The stock had a massive run, and now we’re seeing some consolidation, which could set up the next solid entry for those of us who didn’t chase the highs.
Here’s how I’m planning to approach it:
📍 Entry levels I’m watching:
Around $130 if we see a quick bounce off that zone.
If it dips further, I’m eyeing the $125–$118 area—lots of previous interest there.
And if things get really spicy, $112-108 would be a gift level for a strong entry.
🎯 Profit targets on the bounce:
$140 – First take profit, solid and realistic.
$145 – Next key level where sellers could show up.
$150 – Full recovery and possible breakout if momentum kicks back in.
I’m not in a rush to jump in. Let it come to the levels, confirm the move, and then ride it up. NVDA remains a beast long-term, but short-term patience pays.
Disclaimer: This is not financial advice—just sharing my personal trading game plan. Always do your own research and manage risk accordingly.

$AMD $120 retest then $130 push through. R/R looks incredible..Hello, NASDAQ:AMD Advanced Micro Devices, INC looks TASTY. I'm almost salivating. NASDAQ:NVDA may take a backseat and NASDAQ:AMD could start seeing monster upside. Something in my gut is telling me this name wants to GO. I'm looking at $120c for 6/20 and $130c for 6/20. This thing can launch.. it's hanging on an upside trendline, it may break but this $110 area may represent local support. Earnings report were good and after an abysmal 2024 after having highs and totally wiping them out hitting lows of $80, I think this could be the time for NASDAQ:AMD longs. It has taken the 20 day EMA/SMA over and now could curl to the 200 day EMA/SMA. 200 SMA is $126. This seems like a really good setup especially R/R here. Very cheap calls for a name that can see a 10-15% week.
WSL.

TESLA: Short Trade with Entry/SL/TP
TESLA
- Classic bearish formation
- Our team expects pullback
SUGGESTED TRADE:
Swing Trade
Short TESLA
Entry - 345.78
Sl - 360.55
Tp - 309.96
Our Risk - 1%
Start protection of your profits from lower levels
Disclosure: I am part of Trade Nation's Influencer program and receive a monthly fee for using their TradingView charts in my analysis.
❤️ Please, support our work with like & comment! ❤️

Broadcom (AVGO) Stock Price Rose by Approximately 25% in MayBroadcom (AVGO) Stock Price Rose by Approximately 25% in May
According to available data:
→ AVGO's closing price on 30th April was $192.42
→ The closing price on 30th May was $241.59
The 25% increase in Broadcom (AVGO) stock price made it one of the leaders in the market. For comparison, the S&P 500 index (US SPX 500 mini on FXOpen) rose just over 6%.
Why is the AVGO stock price rising?
Among the bullish factors contributing to the growth of Broadcom (AVGO) stocks in May were:
→ Growing demand for AI infrastructure. This stimulates demand for Broadcom’s products—such as high-performance networking chips, which are critical for building and scaling data centres for AI.
→ Positive news related to the successful integration of the previously acquired company VMware into Broadcom's business.
→ Optimism ahead of Broadcom’s quarterly earnings report, scheduled for 5th June.
Technical Analysis of AVGO Stock Chart
Price movements in May formed an ascending channel (shown in blue).
From a bearish perspective: AVGO stock has risen to the psychological level of $250, which has acted as resistance since December 2024. Additionally, the strong rally in May may motivate some investors to sell previously purchased shares to lock in potential profits.
From a bullish perspective:
→ The price is in the upper half of the channel, which confirms strong demand.
→ A bullish gap highlighted a buyer-favoured imbalance around the $215 level.
Technically, it would be reasonable to expect a corrective move from the $250 resistance deeper into the ascending channel. However, considering the upcoming earnings report—which often triggers volatility—the bulls could attempt to break through the $250 level and set a new all-time high.
This article represents the opinion of the Companies operating under the FXOpen brand only. It is not to be construed as an offer, solicitation, or recommendation with respect to products and services provided by the Companies operating under the FXOpen brand, nor is it to be considered financial advice.

TSLA PRICE ACTION 1ST JUNE 2025This is the updated price action of Tesla. I have explained why I exited long positions. If you have any doubts, then feel free to leave a comment below.
NOTE: STAY AWAY FROM TSLA LONGS

SAMHIi Observed these Levels based on Price Action and Demand & Supply which is my own Concept "PENDAM CONCEPTS"... Please don't take any trades based on this chart/post... Because this chart is for educational purpose only not for Buy or Sell Recommendation... Thank Q

Brinker International (EAT) Brinker International (EAT) staged a strong rebound after testing the 50% Fibonacci retracement level of the move from 56 to 192.21. In Friday’s session, the stock broke through the key resistance zone between 165.34 - 168.90. Sustaining levels above 168.90 would confirm the breakout and reinforce bullish momentum, opening the door for further upside toward 177, 183, and the previous peak at 192.21.
A breakout above 192.21, which marks a major resistance level, would signal a continuation of the broader uptrend, paving the way for potential targets at 204.90, 211.29, 221, and possibly 235.
The stop loss is below the last higher bottom at $ 162.30.
Technical indicators, particularly the MACD, are trending positively and support the bullish outlook, adding further confidence to the upward scenario.
Disclaimer: This analysis is for informational purposes only and does not constitute financial, investment, or commercial advice or recommendations.
