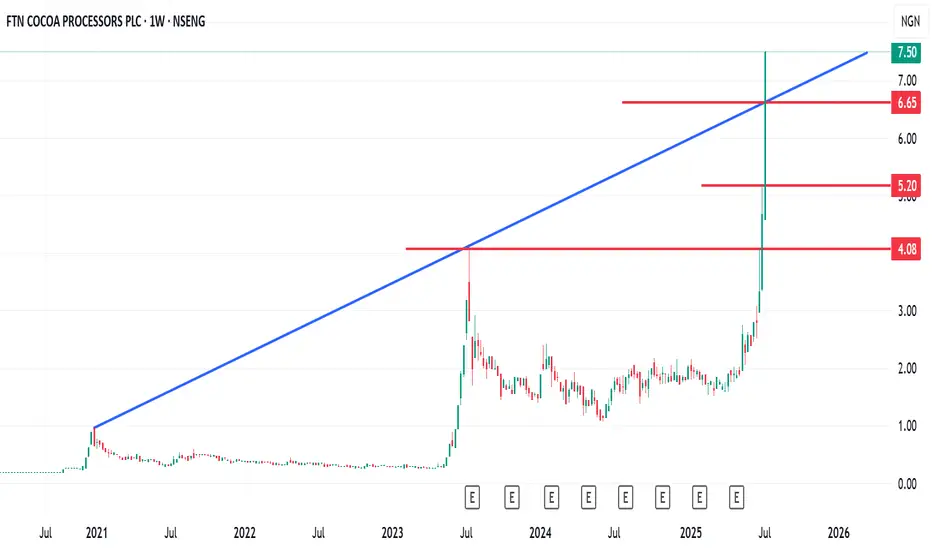
FTN Cocoa has more than doubled price in 3 weeksFTN Cocoa has more than doubled its price in 3 weeks.
The questions are
1. Is this sustainable
2. What is the catalyst for this accelerated rise
However, my thought is clear on the chart. A fall below those levels may push it lower. But if the momentum continues, we may see a continuous positive run.
Tradew ith care
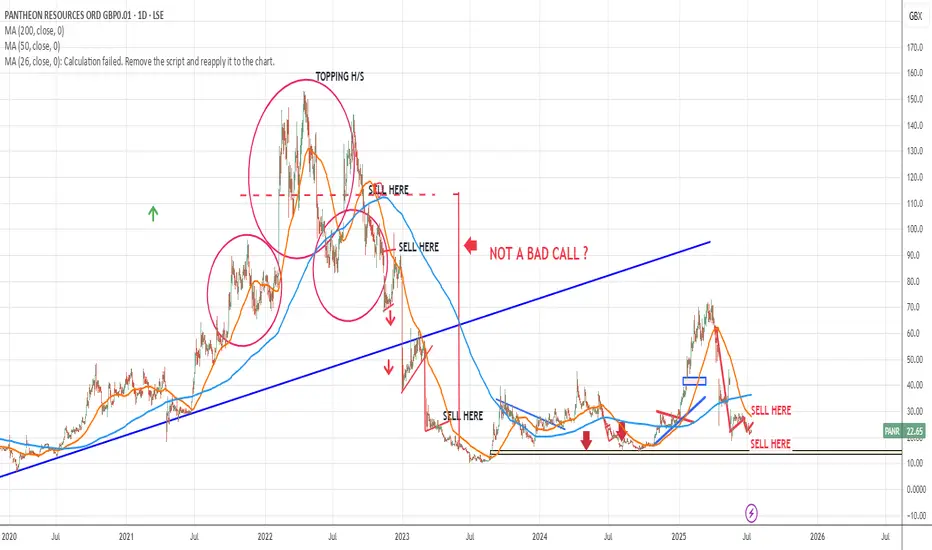
"PANR" shortI gave a sell signal around November 2022.
Look back..
No way this is a real share,,
BWTFDIK
SSB
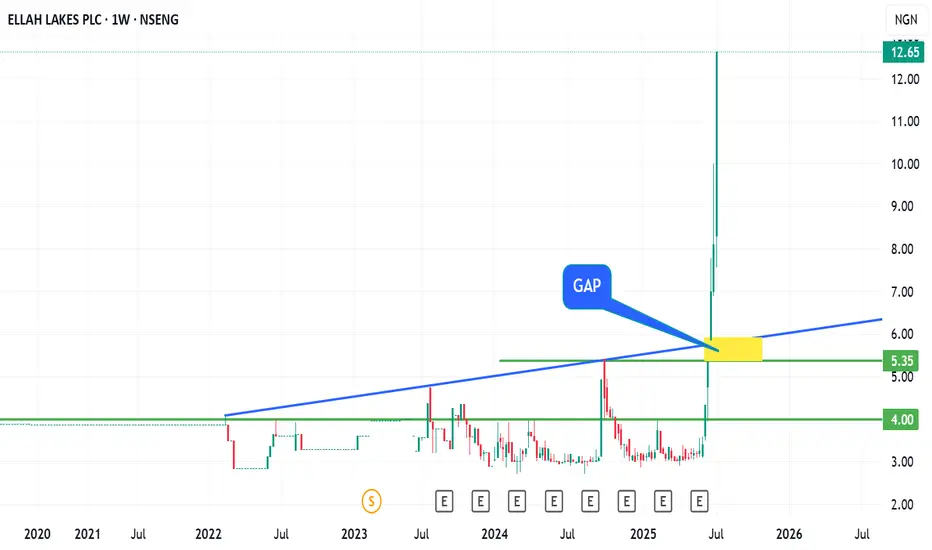
From Fish Farming to Agribusiness Giant: Ellah Lakes’ 304% Rise Ellah Lakes Plc is a Nigeria‑based agribusiness firm, once focused on fish farming but now primarily engaged in oil palm, cassava, maize, soya, and rice production and processing, operating plantations across Edo, Ondo, Enugu, Ekiti (Nigeria) and Ghana.
This asset has made roughly 304% gain since 2nd of June of this year.
The questions are:
1. Is this vertical growth sustainable?
2. Will price action be respected technically as shown on the chart?
3. Will Ellah Lake drop back to close the yellow gap? (N5.3 - N6 zone)
My final view:
After a 304% gain since June, I am now questioning the sustainability of this vertical move, key technical zones, and whether a price correction to the ₦5.3–₦6 gap is on the horizon
Trade with care
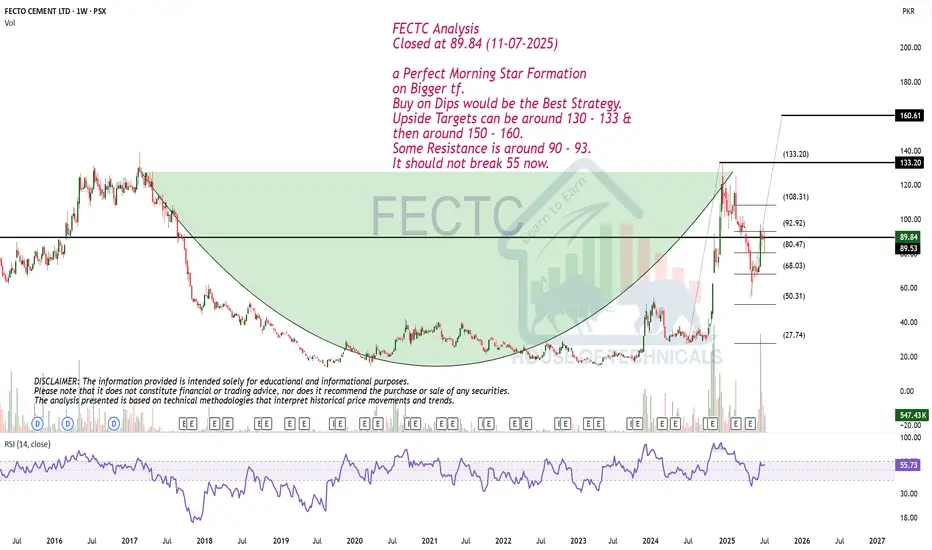
a Perfect Morning Star Formation on Bigger tf.FECTC Analysis
Closed at 89.84 (11-07-2025)
a Perfect Morning Star Formation
on Bigger tf.
Buy on Dips would be the Best Strategy.
Upside Targets can be around 130 - 133 &
then around 150 - 160.
Some Resistance is around 90 - 93.
It should not break 55 now.
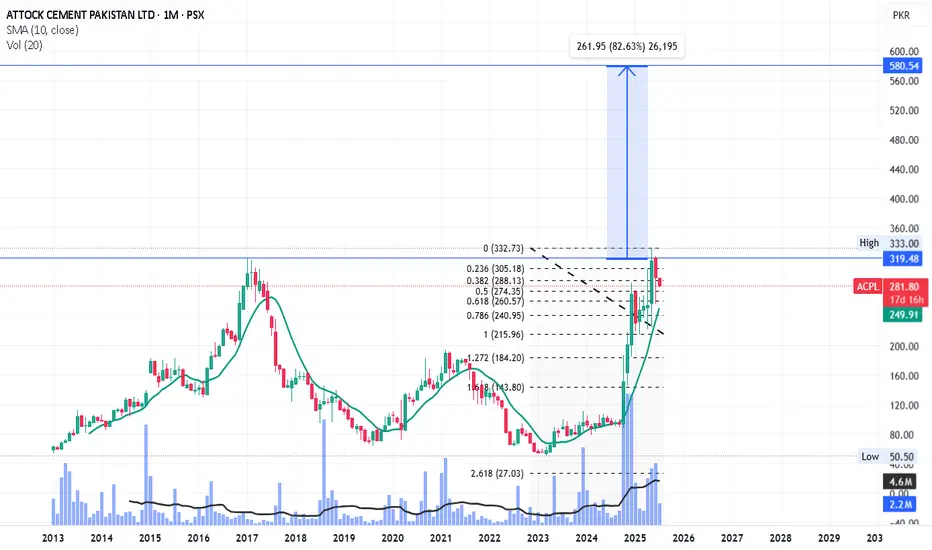
ACPL LongACPL tried to break its all-time high first time and failed. It may retrace to Fib-0.618 level (~260) where its SMA10 will push it upwards again. However, it may take some time that it breaks its all-time high and go for new highs. Ultimate target (580) is mentioned in chart.
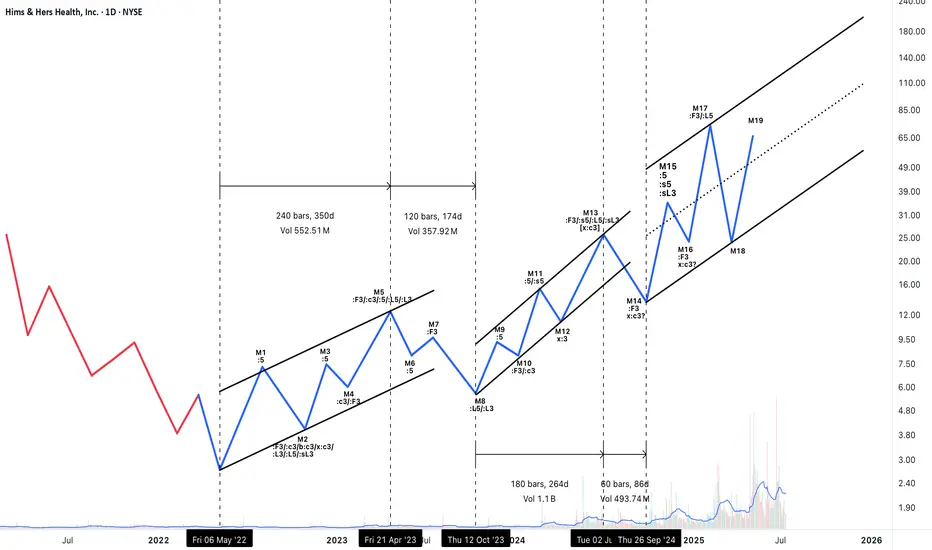
Neowave Structural Outlook – Complex Correction: W–X–Y–X–ZThis analysis interprets the ongoing structure as a Complex Correction in the form of a W–X–Y–X–Z pattern. Here's a breakdown of the logic behind the wave labeling and key observations:
Overall Structural Summary:
W wave (M1–M5): Though M1 is labeled as ":5", a closer examination of its internal structure reveals corrective characteristics. Therefore, the entire M1–M5 segment is best interpreted as a complex corrective structure, possibly a double three or flat.
X wave 1 (M6–M8): A clear Zigzag, fulfilling the requirements for a valid X. All relevant time and price criteria are met, forming a neat connector after W.
Y wave (M9–M13):
M9–M10: A Zigzag formation.
M11–M12–M13: M12 serves as an x-wave, and M13 unfolds as a simple corrective move in three waves, completing the Y wave. Though M13 is a single-leg visually, the internal structure confirms a three-part move.
The Y wave is longer in both time and complexity, appropriate for its position in the sequence.
X wave 2 (M14): Despite appearing as a short single move, it satisfies the X criteria in the context of the ongoing correction. The small size is acceptable as per rule allowances for connectors in Z formations.
Z wave (M15–ongoing):
M15–M17: Another Zigzag, forming the first leg of Z.
M18: Likely the X connector within Z.
M19: Assumed to be the beginning of the final leg of Z. The structure from here forward will determine whether Z completes as a triangle, zigzag, or another combination.
Supporting Rule Applications:
Several Neowave rules were cross-verified:
- Rule 2a and 5a were referenced to validate corrections that exceed the 61.8% retracement and duration benchmarks.
- Rule 7c and 4 supported impulse invalidations and corrections involving running structures.
Time symmetry across connectors and leg duration was considered to maintain wave consistency.
Visual Channels:
All W, Y, and Z legs are progressing within clearly defined channels.
The Z leg is currently within a steep rising channel. If Z completes as a non-triangular formation, a reversal might follow.
Conclusion & Risk Notes:
This structure, though corrective in nature, contains strong upward segments — especially within Z — making it tradable for bullish swings.
Given that Z is the final leg, caution is warranted. Once Z completes (especially if M19 develops into a three-wave structure), the larger correction may terminate, potentially leading to a larger trend reversal.
Position management (e.g., scaling out or using stop-losses) is advised as the structure evolves.
DPRO falling wedge breakoutDPRO has broken out of a falling wedge on the weekly. Ticker will respond well to Trump's "Big Beautiful Bill" which includes over $30 billion for defense/military spending. The drone company is already making progress with US military projects and is setting up for a strong rally.

Crypto in July 2025: A Financial Reset from Macromics GroupThe world of cryptocurrencies in July 2025 is experiencing more than just another growth cycle — it’s undergoing a fundamental transformation of the global financial system. Amid geopolitical instability, tighter control over digital assets, and growing interest from institutional investors, digital currencies are once again in the spotlight. Macromics Group shares its latest analytical insights on the key events and trends.
A New Bull Run: Ethereum 3.0 and Bitcoin Network Upgrade
Since the start of summer 2025, Ethereum has shown strong growth, largely due to the launch of Ethereum 3.0, which reduced transaction fees and made the network more scalable. Bitcoin, in turn, has undergone another major security upgrade, attracting new institutional investors, including funds from Japan and Saudi Arabia.
CBDCs and Regulation: Governments Shift Approach
Central banks are actively rolling out central bank digital currencies (CBDCs). China, India, Brazil, and the EU have expanded pilot programs for their national digital currencies. This has led to increased interest in stablecoins backed by fiat currencies and greater demands for transparency on DeFi platforms.
Macromics Group helps clients navigate these new dynamics, offering up-to-date analytical resources and capital protection strategies across both regulated and unregulated sectors of the crypto market.
NFTs Make a Comeback — In the Corporate World
A new wave of interest in NFTs is emerging, not from artists, but from the corporate sector. Companies are using tokens for intellectual property, document verification, and digital rights management. Macromics Group is investing in startups building infrastructure for business-focused NFTs — a clear sign of the technology’s long-term potential.
AI + Blockchain: A Union of Future Technologies
In 2025, two mega-trends are converging: artificial intelligence and blockchain. AI-powered protocols are automating trading, cybersecurity, and even smart contract audits. Macromics Group is already implementing these technologies into its analytical tools and services.
What’s Next? Macromics Group Forecast
According to our data, the crypto market has entered a phase of "conscious growth" — where technology, regulation, and real-world utility are evolving in harmony. In the coming months, we anticipate increased attention toward:
DePIN projects (decentralized physical infrastructure)
Tokenized real-world assets (real estate, gold)
ESG-focused cryptocurrencies
Conclusion: Don’t Just Invest — Understand
Macromics Group urges investors to go beyond participation — to become informed decision-makers. We provide deep analytics, access to unique tools, and expert support at every stage of crypto investing. July 2025 is the perfect time to rethink your strategy and take a step into the future.
Macromics Group — your expert in the world of digital assets.

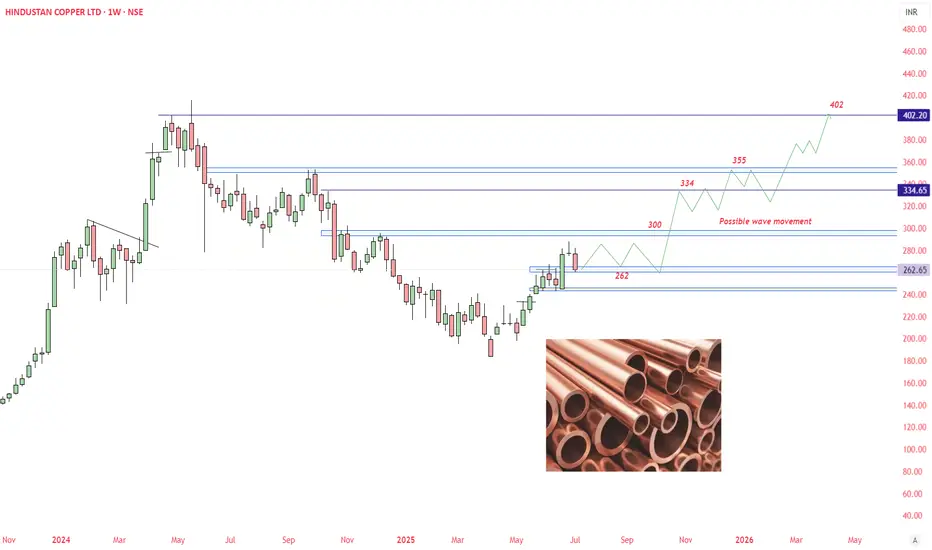
HINDUSTAN COPPER - A bullish viewLooking at copper demand in upcoming years, Bullish view are created for Hindustan copper. I have marked a wave movement that may happen during coming years.
This chart is only educational purpose. Do your own study before taking any trade or financial decisions.
Capri Global📈 Trade Plan
Action: ✅ BUY
Entry Point: ₹136
Stop Loss (SL): ₹119
Target (TGT): ₹437
Risk: ₹17
Reward: ₹301
Risk-Reward Ratio (RRR): 🔥 17.7 — Excellent
📊 Key Levels
Parameter Value
Last High ₹289
Last Low ₹141
Point Variation ₹148
🔍 Interpretation & Strategy
All trends align UP, showing strong bullishness across timeframes.
Demand zones are tightly packed (119–136) → Indicates strong institutional buying base.
Entry at demand base gives excellent RRR.
Target of ₹437 may seem far, but is structurally feasible if broader market supports and breakout holds post ₹289 (previous high).
SL at ₹119 protects capital well below the demand zone.
✅ Recommendation
A textbook HTF Demand Zone Buy Setup.
Can consider partial booking near previous high (₹289) and trail the rest toward final target.
Ensure to review volume confirmation at demand zone before entering.
🧾 Multi-Timeframe (MTF) Analysis Summary
Overall Trend: 🔼 Strong UPTREND across all timeframes
Demand Zone: Consistent at 136 (Proximal) to 119 (Distal) across HTF, MTF, and ITF
Logic Used:
HTF: Rally-Rally / Rally-Base-Rally
MTF & ITF: BUFL / DMIP (signs of strong continuation demand)

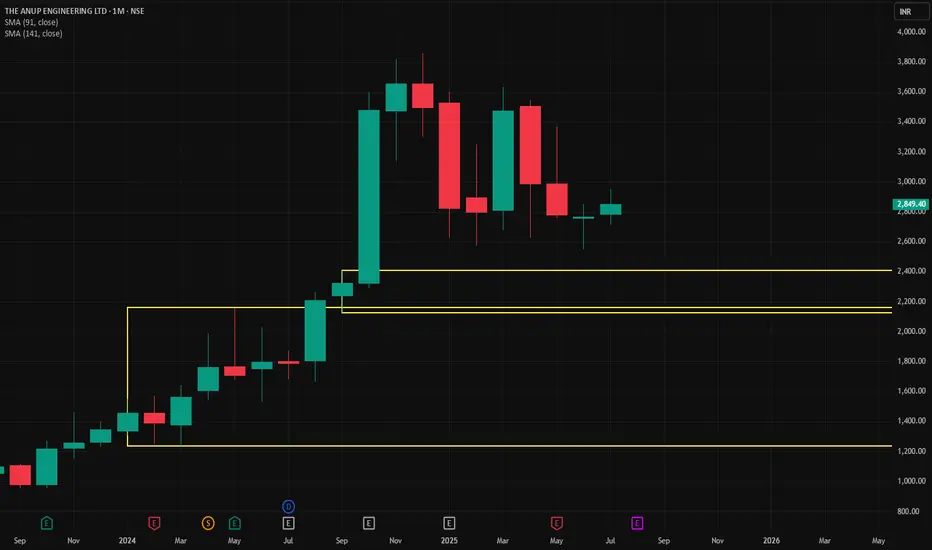
Anup Engg📈 Trade Plan:
Entry-1: ₹2408
Stop Loss: ₹2308
Risk: ₹100
Reward: ₹3017
Target: ₹5425
Risk:Reward (RR): 30.2 — extremely favorable if it plays out
Last High: ₹3859
Last Low: ₹2293
Point Variance: 1566
✅ Interpretation & Insights:
Trend Confirmation Across All Timeframes:
Every timeframe from yearly down to intraday (60M) shows an uptrend, indicating strong bullish momentum and confirmation across multiple investor classes.
Demand Zone Clustering:
The demand cluster around 2288–2408 is repeated across MTF & ITF zones. This tight range is a strong accumulation zone.
You are entering right at the upper edge of the demand, which is okay, but better RR existed slightly lower.
Trade Setup:
Entry: ₹2408 is aligned with the weekly/monthly proximal zone.
SL: ₹2308 is just below the demand zone, which is valid technically.
Target: ₹5425 seems based on projection logic (perhaps supply zone or fib extensions). It’s aggressive, but technically aligned with the broader HTF trend.
Risk-Reward:
RR of 30.2 is theoretically excellent, but practically it suggests your SL is very tight compared to the move expected. Monitor volatility closely.
🧠 Strategic Suggestions:
If price consolidates above ₹2408 and shows strength, consider pyramiding.
Watch for daily close above ₹2408 to confirm institutional interest.
Trail SL aggressively once above ₹3000 to protect profit.
🔍 Multi-Timeframe (MTF) Trend Summary:
Timeframe Trend Demand Zone (Proximal–Distal) Avg
Yearly UP 1459 – 1236 1348
Half-Yearly UP 2160 – 1665 1913
Quarterly UP 2160 – 1665 1913
HTF Avg UP 1926 – 1522 1724
| Monthly | UP | 2408 – 2125 | 2267 |
| Weekly | UP | 2408 – 2125 | 2267 |
| Daily | UP | 2395 – 2288 | 2342 |
| MTF Avg | UP | 2404 – 2179 | 2292 |
| 240M | UP | 2395 – 2288 | 2342 |
| 180M | UP | 2395 – 2288 | 2342 |
| 60M | UP | 2337 – 2308 | 2323 |
| ITF Avg | UP | 2376 – 2295 | 2335 |
Glenmark Pharma – Historic 16-Year Cup & Handle Breakout!Glenmark has completed a massive Cup and Handle pattern after nearly 16 years, breaking past its 2008 all-time high with a powerful volume spike. This is a textbook long-term breakout, potentially signaling the start of a major multi-year bullish trend in the pharma sector.

PARAS DEFENSE📈 Trade Setup
Parameter Value
Buy Entry ₹738
Stop Loss (SL) ₹670
Target ₹1,194
Risk ₹68
Reward ₹456
Risk:Reward 6.7 : 1
Last High: ₹797 — Once broken, can trigger fresh momentum.
Last Low: ₹400 — Previous strong base.
⚠️ Key Observations
Strong Weekly & Daily Demand just below current price (678–738) supports the buy zone.
Entry near BUFL zone → suggests breakout continuation.
High reward-to-risk ratio (6.7x) → Attractive setup.
If ₹797 (previous high) breaks with volume, the rally may accelerate toward ₹1,000+.
📌 Strategy
Entry: On price stability above ₹738 or on intraday retest with confirmation.
SL Discipline: Maintain tight SL at ₹670 (just below multiple demand zones).
Partial Booking: Consider at ₹900–950 before full target if volatility spikes.
🔍 Trend Overview
Timeframe Trend Demand Zone Avg Price
HTF (Yearly–Quarterly) UP 302–587 407
MTF (Daily–Monthly) UP 404–738 620
ITF (60M–240M) UP 670–698 686

SANM Long Trade Setup!
📊
⏱️ Timeframe:
30-minute chart
📍 Technical Highlights:
Ascending triangle breakout near $104.25 (confirmed)
Strong base forming above $103 (white and yellow support lines)
Price trying to break $105 resistance (red line) for further upside
🎯 Targets:
TP1: $105.81
TP2: $106.39
(Both marked in light blue — recent resistance zone)
🔐 Risk Management:
Entry: ~$104.30–104.50
Stop Loss: Below $103.80
Risk–Reward Ratio: Great setup — clear structure
📈 Trade Plan Summary:
Item Value
Entry ~$104.30
Stop Loss ~$103.80
Target 1 $105.81
Target 2 $106.39
Pattern Ascending Triangle Breakout ✅

BX Long Trade Setup!📊
⏱️ Timeframe:
30-minute chart
📍 Technical Highlights:
Bullish pennant breakout forming after a strong uptrend (continuation pattern ✅)
Breakout area: Around $163 (red resistance)
Support held near $162 zone (white/yellow lines)
🎯 Targets:
TP1: $164.15
TP2: $165.05
(Both resistance levels marked in light blue)
🔐 Risk Management:
Entry: ~$163 (after pennant breakout confirmation)
Stop Loss: Below $161.80 (tight risk)
Risk–Reward Ratio: Excellent (>2:1)

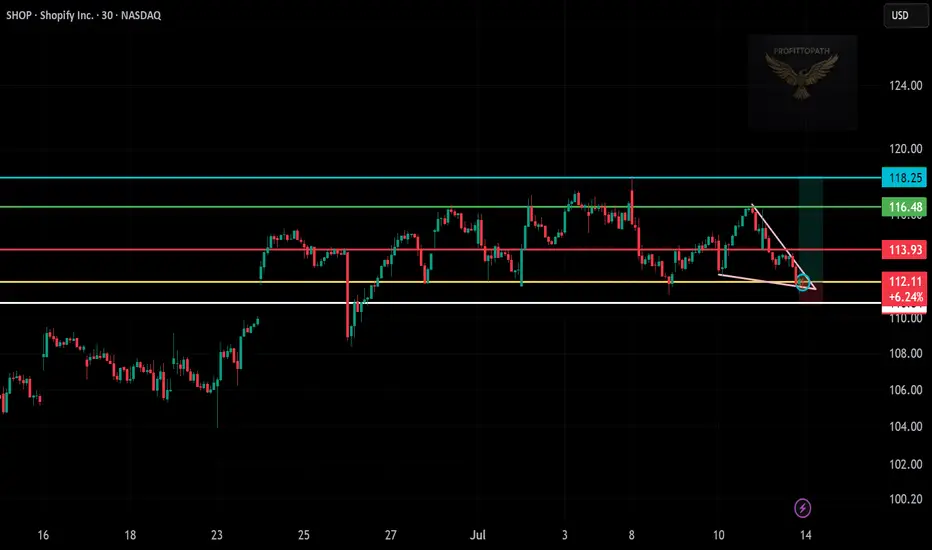
Trade Setup: Long on SHOP!📊
🕒 Timeframe:
30-minute chart
📍 Technical Overview:
Falling wedge breakout detected ✅
Support zone: $111.50–$112 (held well)
Breakout confirmation near $113
Target zones:
TP1 🎯: $116.48 (green resistance)
TP2 🎯: $118.25 (major resistance)
🔐 Risk Management:
Stop loss: Below $111.50 (white support)
Risk–Reward Ratio: Over 2:1 ✅
📈 Trade Plan Summary:
Entry: $113.00–$113.50 (breakout zone)
Target: $116.48 → $118.25
Stop loss: Below $111.50
Pondy Oxide, Kindly do your own studyThis stock is in momentum in weekly time frame.
Monthly time frame- stock has completed 4 wave structure and looks like its in 5th wave.
Weekly-stock has challenged upper bollinger band
Weekly MACD -PCO stat
Weekly RSI is in momentum
Weekly ADX is strong
Daily price is in momentum and volume has increased

It looks like a good support is forming3.25-3.40 is starting to built support. I seems like Bngo is in accumulation phase.
Just waiting.

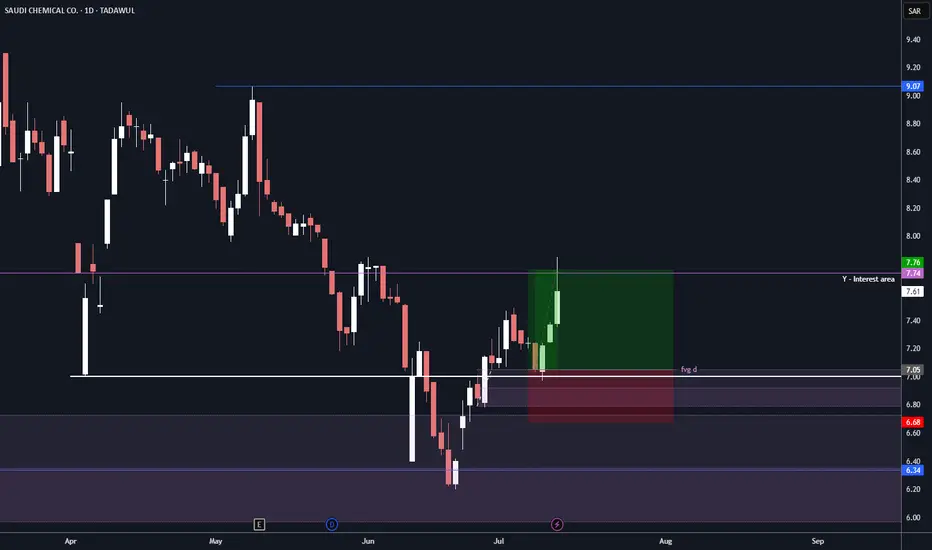
Bullish Signs on 2230 TASI Trade was on 2230 reason to enter:
Bounce from Monthly level blue line which also MONTH FVG.
Fake breakout white line in Monthly.
Entry in Daily FVG.
Target 2RR
KALA BIO (KALA) Bullish Channel Breakout Setup – Eyes on $13 KALA BIO (KALA) is forming a bullish ascending channel after a prolonged base, with price consistently making higher lows and higher highs. The current setup suggests strong accumulation, and the stock is now approaching a potential breakout point.
A clear uptrend channel is visible, and a breakout from this pattern could trigger a powerful move towards the analyst target at $13.00, as marked on the chart. The green arrow highlights the expected bullish momentum if the breakout materializes.
Trade Idea:
Entry: On breakout above the upper channel line, confirming momentum
Target: $13.00 (analyst target)
Stop: Below the channel support or recent swing low to manage risk
Volume confirmation and overall market sentiment will be key. As always, use proper risk management and do your own research before entering any trade.

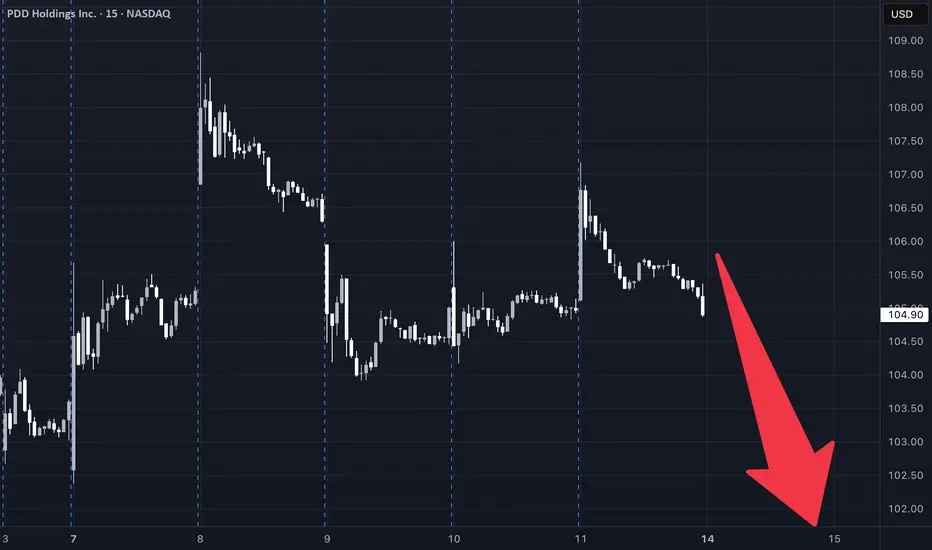
PDD Stock Trading Plan (2025-07-12)PDD Stock Trading Plan (2025-07-12)
Final Trading Decision
1. Comprehensive Summary of Each Model's Key Points
DS Report
Technical Analysis: Price: Currently at $104.91, facing short-term bearish pressures with significant support at $104.83. Indicators: Short-term indicators (30-min) show bearish signals, while daily indicators hint at a potential bullish reversal (e.g., MACD bullish divergence). Sentiment: Mixed headlines with a stable VIX suggest a favorable but cautious entry environment. Trade Strategy: Long with a target of $108.70 and stop loss at $104.10 based on recent support levels.
LM Report
Technical Analysis: Price: Above the long-term bullish trend but facing near-term resistance. Indicators: Neutral RSI levels do not suggest a clear direction. MACD shows some signs of hesitance. Sentiment: Slightly bullish due to institutional flows and a falling VIX but lacks strong conviction. Trade Strategy: Suggests a long position at $105.50, with a profit target of $113.64.
GK Report
Technical Analysis: Describes a neutral situation with prices around key EMAs and exhibiting consolidation. Weak momentum signals indicate uncertainty regarding outright positions. Sentiment: Highlights mixed news with both bullish and bearish implications. Trade Strategy: Recommends not to trade due to the unclear directional bias.
CD Report
Technical Analysis: Confirms short-term bearish momentum with price below moving averages and mixed momentum indicators. Suggests a moderately bearish sentiment based on resistance levels. Sentiment: Slightly positive VIX implies stability; however, recent call volumes show mixed institutional sentiment. Trade Strategy: Strong short position recommended to profit from resistance at $105.70.
2. Areas of Agreement and Disagreement
Agreement:
Most models agree on near-term bearish indicators (e.g., weak momentum, mixed MACD signals across timeframes). Multiple reports note the importance of the $104.30-$106.20 price range as critical support/resistance.
Disagreement:
Long vs. Short Positions: DS and LM suggest potential long positions based on technical rebounds, while CD firmly recommends a short position anticipating downward movement. Market Sentiment: Some models see potential bullish opportunities in VIX stability and call volume, while others express caution due to mixed signals.
3. Conclusion and Recommendations
Overall Market Direction Consensus
The market is in a neutral to moderately bearish state based on the conflicting signals from the models. The current indicators do not suggest a strong bullish trend, while technical analysis indicates possible downward momentum.
Recommended Trade
Direction: Short Position Entry Price: $104.90 at market open. Stop Loss: $106.20 (1.2% loss). Take Profit: $102.50 (2.3% gain). Position Sizing: Based on a $10,000 account with a 2-3% risk tolerance, risking approximately $100-$120 total. Holding Period: 3-4 weeks maximum. Confidence Level: 65% based on resistance rejection and mixed sentiment.
Key Risks and Considerations
Risk of a market reversal if bullish news arrives or a strong institutional buying momentum occurs. Close monitoring of technical indicators is required, particularly the MACD and RSI, as conditions shift either direction could warrant position adjustments.
TRADE_DETAILS (JSON Format)
{ "instrument": "PDD", "direction": "short", "entry_price": 104.90, "stop_loss": 106.20, "take_profit": 102.50, "size": 200, "confidence": 0.65, "entry_timing": "open" }
📊 TRADE DETAILS 📊 🎯 Instrument: PDD 📉 Direction: SHORT 💰 Entry Price: 104.9 🛑 Stop Loss: 106.2 🎯 Take Profit: 102.5 📊 Size: 200 💪 Confidence: 65% ⏰ Entry Timing: open
Disclaimer: This newsletter is not trading or investment advice but for general informational purposes only. This newsletter represents my personal opinions based on proprietary research which I am sharing publicly as my personal blog. Futures, stocks, and options trading of any kind involves a lot of risk. No guarantee of any profit whatsoever is made. In fact, you may lose everything you have. So be very careful. I guarantee no profit whatsoever, You assume the entire cost and risk of any trading or investing activities you choose to undertake. You are solely responsible for making your own investment decisions. Owners/authors of this newsletter, its representatives, its principals, its moderators, and its members, are NOT registered as securities broker-dealers or investment advisors either with the U.S. Securities and Exchange Commission, CFTC, or with any other securities/regulatory authority. Consult with a registered investment advisor, broker-dealer, and/or financial advisor. By reading and using this newsletter or any of my publications, you are agreeing to these terms. Any screenshots used here are courtesy of TradingView. I am just an end user with no affiliations with them. Information and quotes shared in this blog can be 100% wrong. Markets are risky and can go to 0 at any time. Furthermore, you will not share or copy any content in this blog as it is the authors' IP. By reading this blog, you accept these terms of conditions and acknowledge I am sharing this blog as my personal trading journal, nothing more.
XOM 125 PT Leader of its sector XLE and showing relative strength.
Technical analysis is consistent with pattern formation and breakout
BTM Triangle Squeeze: Watching for Breakout Above TrendlineBitcoin Depot Inc. (BTM) is setting up for a potentially explosive move as price action consolidates within a tightening triangle pattern. After a strong rally from mid-May, BTM found consistent support along an ascending trendline, recently bouncing and holding above this key area.
Currently, price is pressing up against a well-defined descending breakout line. A clear break and close above this trendline could signal the start of a new bullish leg, especially with analyst price targets near $7.00 suggesting further upside potential.
My Trade Plan:
Entry: Watching for a confirmed breakout above the descending trendline, ideally on higher volume.
Target: Analyst price target at $7.00, with potential for further extension.
Stop: Below the ascending support line or recent swing low to manage risk.
This setup shows strong momentum and a classic technical pattern. As always, I will wait for confirmation before entering, and will manage risk accordingly. This is not financial advice—please do your own research before trading.
