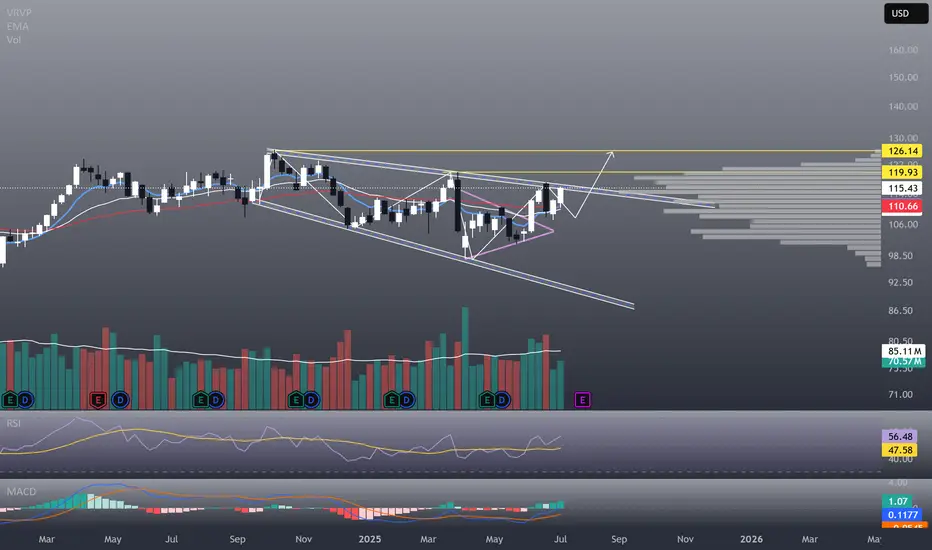
XOM 125 PT Leader of its sector XLE and showing relative strength.
Technical analysis is consistent with pattern formation and breakout
BTM Triangle Squeeze: Watching for Breakout Above TrendlineBitcoin Depot Inc. (BTM) is setting up for a potentially explosive move as price action consolidates within a tightening triangle pattern. After a strong rally from mid-May, BTM found consistent support along an ascending trendline, recently bouncing and holding above this key area.
Currently, price is pressing up against a well-defined descending breakout line. A clear break and close above this trendline could signal the start of a new bullish leg, especially with analyst price targets near $7.00 suggesting further upside potential.
My Trade Plan:
Entry: Watching for a confirmed breakout above the descending trendline, ideally on higher volume.
Target: Analyst price target at $7.00, with potential for further extension.
Stop: Below the ascending support line or recent swing low to manage risk.
This setup shows strong momentum and a classic technical pattern. As always, I will wait for confirmation before entering, and will manage risk accordingly. This is not financial advice—please do your own research before trading.

SUNDARAM FINANCE Near at Support Zone | Keep an eye on it ||There are two charts of Sundaram Finance —on the Weekly timeframe and Daily timeframe.
On the weekly timeframe, the stock is moving within an ascending parallel channel, with the support zone between 4650-4550.
On the daily timeframe, the stock is moving within a descending channel, with the support boundary near 4600-4650.
If this level is sustain then we may see higher prices in SUNDARMFIN
Thank You...

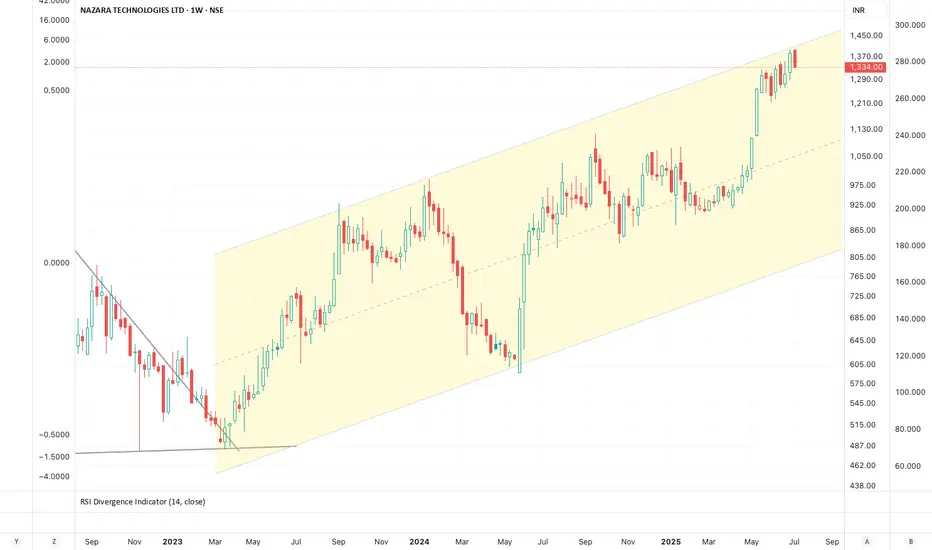
Nazara: na zaraNazara
PER 141
Rising Channel
Insiders selling
Volumes falling
Momentum Indicators overbought
Target
3 figures !!
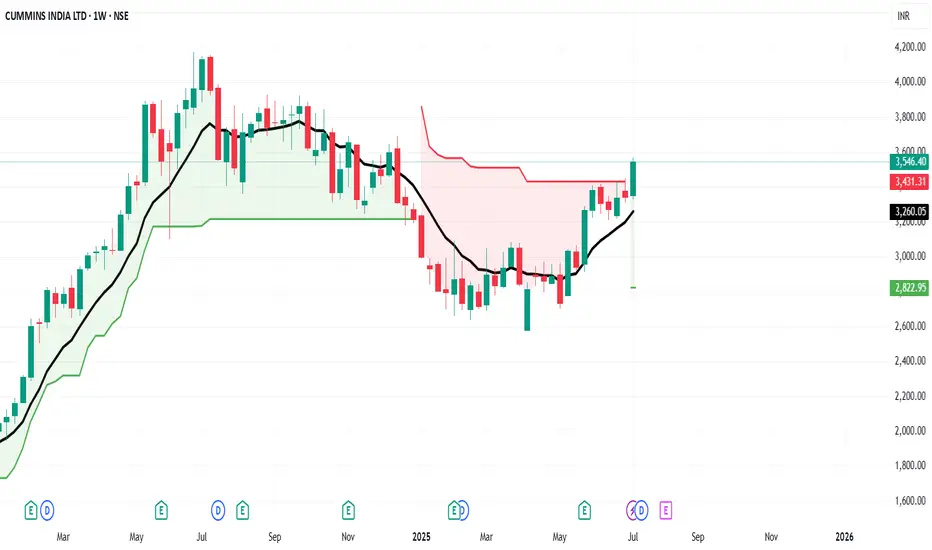
Long CUMMINSINDSuperTrend has turned positive on the weekly chart, with the recent closing price trading above the 10 EMA
BUY CUMMINSIND
Entry - 3570
SL - 3260
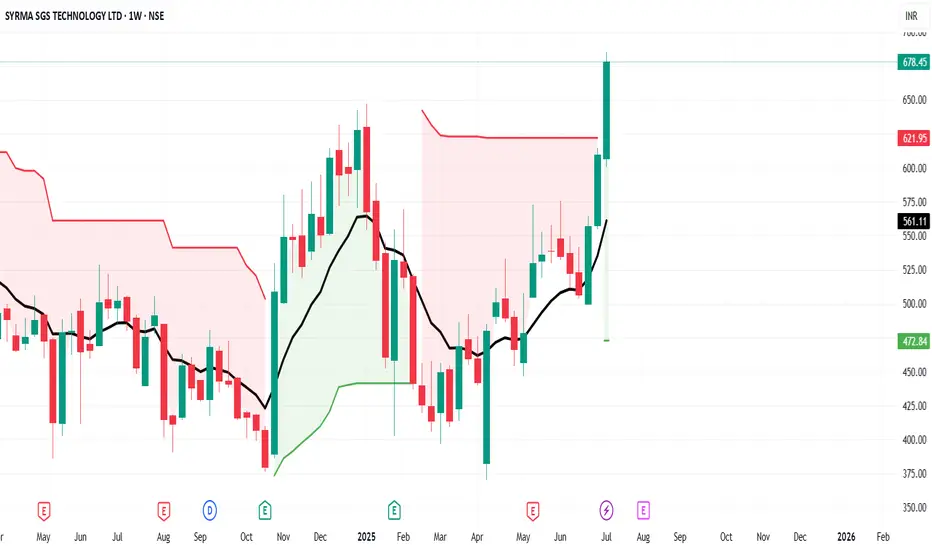
Long SYRMASuperTrend has turned positive on the weekly chart, with the recent closing price trading above the 10 EMA
BUY SYRMA
Entry - 686
SL - 560
Long ACMESOLARSuperTrend has turned positive on the weekly chart, with the recent closing price trading above the 10 EMA
BUY ACMESOLAR
Entry - 304
SL - 250

Long ANANDRATHISuperTrend has turned positive on the weekly chart, with the recent closing price trading above the 10 EMA
BUY ANANDRATHI
Entry - 2250
SL - 2015

Microsoft from 2000 to 2017 - Ranging Moments - 13/07/2025A lot of patience is required by Investors.
Stakeholders' Trust and good faith are required in company products & services. Also Board of Directors and Company Management play a big role in growing the company.
An amazing point I can notice,
During this period, Steve Ballmer was from 2000 to 2014.
The CEO plays a crucial role in determining the company's hard pocket returns for investors or the highest risk for investors.
After Stever Ballmer left his position, Microsoft did 10X in stock price.
From approx $50 to $500 within the period of 8 years only.
So What made Microsoft in ranging price points for that period?
Innovation?
Bad Choices of Acquisition?
If you have any good points to connect, comment down on this post?
Happy trading.

High Wave Candle on the weeklyWe have a High Wave Candle on the Weekly chart.
The candle is at the support of the upward parallel channel.
The candle is also under the 50 EMA.
The candle is at the vicinity of the 0.618 Fibonacci level.
Bears want to see the close of the next candle below 12.45, then the next price target at 11.82; bears ideally would like to see a complete break of structure to the downside and a candle close below 10.38 for a complete bearish takeover.
Bulls want the structure to maintain intact and a close above the Fibonacci Golden Zone 13.75.

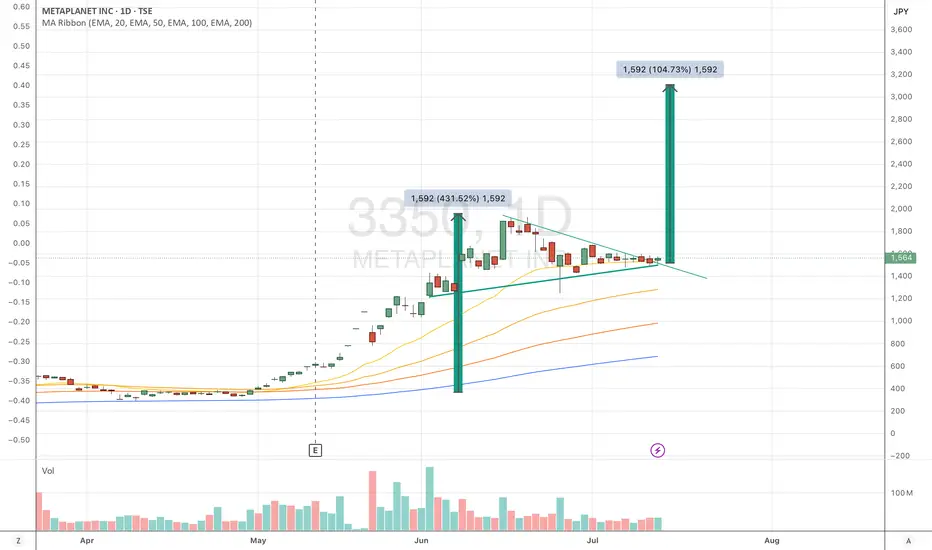
MTPLF, DN3, 3350 : End of week breakoutnice little pennant with a 3200 target this summer. without taking coming bitcoin surge into account.
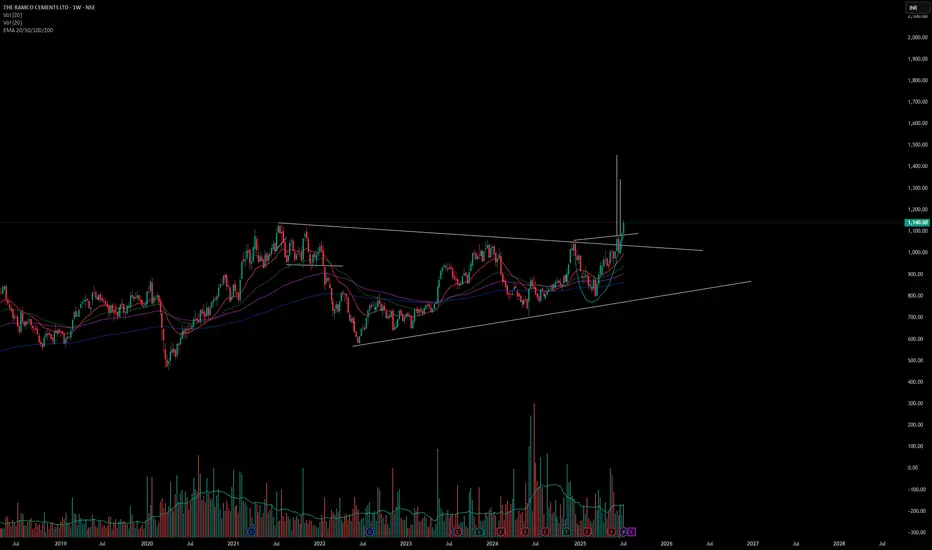
Long The Ramco Cements LTD . On 9/07/2025 I have shared this stock with all of you but very few people have seen this publish idea but today on 13/07/2025 I am sharing this stock with all of guys with weekely analysis of this stock. Its new target is 1450.
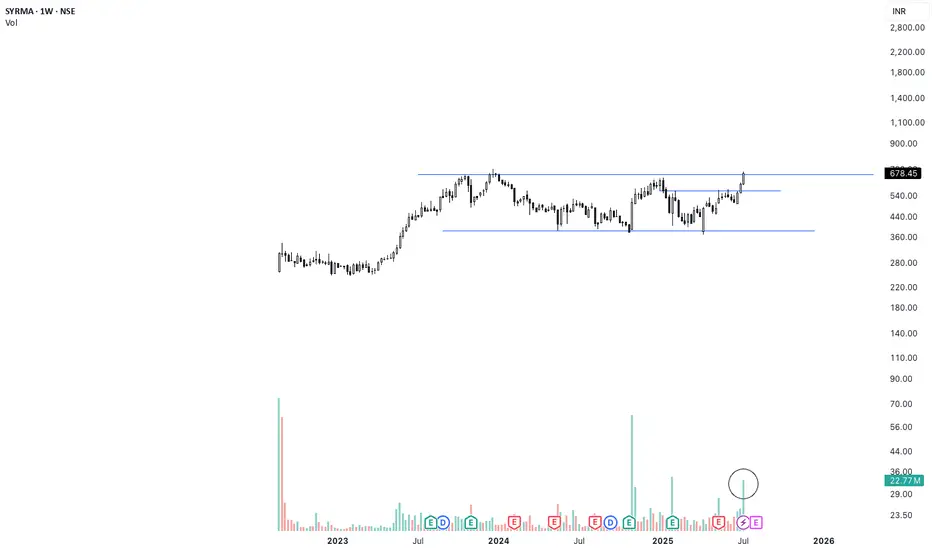
SYRMA Weekly Breakout | High Volume + 1.5-Year Base Structure🚨 Breakout Alert on SYRMA (Weekly)
After 1.5 years of sideways consolidation, SYRMA has finally broken out with strong conviction. The breakout is supported by the highest weekly volume seen in months — signaling smart money accumulation.
📊 Technical Setup:
🔹 1.5-year base formation now broken
🔹 Breakout candle closed above resistance with strength
🔹 Volume spike confirms breakout validity (HVE)
🔹 Structure resembles classic Stage 2 breakout
🟢 Ideal retest zone: ₹670–₹680
🛑 Support zone: ₹635–₹645
Fundamental Snapshot:
✅ Revenue: ₹2,000 Cr → ₹3,800 Cr in 2 years
✅ Net Profit up 50% YoY
✅ EPS (TTM): ₹9.57
✅ Promoter holding: ~46%
✅ Dominant player in EMS & IoT hardware
⚡Macro trend supports domestic electronics manufacturing — still early in the cycle.
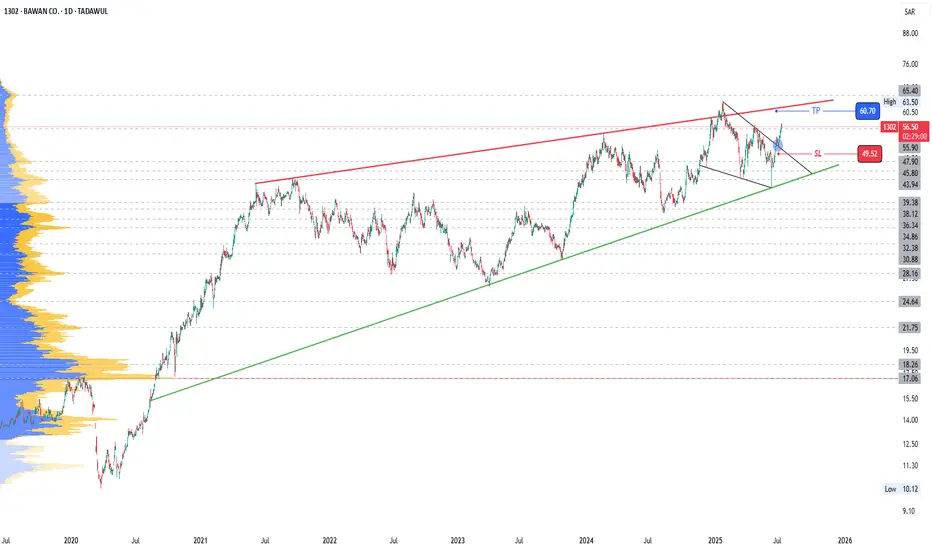
1302: Breakout of trendline resistance1302
Moving within a Rising Wedge
Price has just broken a short term resistance.
Short trade up to the top of rising wedge can be taken
Levels are marked
Trail SL accordingly.
Do proper risk management.
Watch for breakout of Rising Wedge top (Resistance)
Zydus Lifesciences Long_Support at 20 Daily EMAZydus Lifesciences Long:
- Clean Price action
- price takes support near 20 DEMA
- price test 20 DEMA for first time after Golden Crossover (50 > 200 DEMA)
- Hidden Bullish Divergence in action.
- Enter long when the prices are favorable
- SL: close below 20 DEMA

ICICI GI Long_Support at 20 Daily EMAICICI GI Long:
- Price takes support at 20 DEMA
- 2 days before the Earnings call (Caution)
- Enter long when the prices favorable in the lower timeframe
- SL: CLose below 20 DEMA

Nuvama Wealth 📈 Trade Setup:
Parameter Value
Entry Price ₹6,905
Stop Loss ₹6,643
Target ₹10,274
Risk ₹262
Reward ₹3,369
Risk:Reward 12.9x
Last High ₹8,551
Last Low ₹6,828
Point Variation ₹1,723
🧠 Interpretation:
Perfect Trend Alignment: UP across all HTFs, MTFs, and ITFs.
Entry is within weekly demand zone (6905–6374), giving a low-risk setup.
High R:R (12.9x) makes this a compelling swing trade opportunity.
Target of ₹10,274 implies a breakout beyond the previous high (₹8,551), anticipating new ATHs.
SL of ₹6,643 is below recent lows and strong demand zones—well positioned.
⚠️ Watchouts:
If 6828 breaks, revalidate strength — this is the last key support across multiple timeframes.
Monitor volumes and candle formations around 6900–7200 zone to confirm breakout momentum.
✅ Overall Trend: STRONG UPTREND
All timeframes — High Time Frame (HTF), Medium Time Frame (MTF), and Intraday Time Frame (ITF) — show consistent upward demand zones.
📊 Zone Summary:
Timeframe Trend Zone Type Proximal Distal Avg Zone
Yearly UP Support 5326 4454 4890
Half-Yearly UP Rally → Rally 5326 4454 4890
Quarterly UP Rally-Base-Rally 5326 4454 4890
Monthly UP BUFL 7241 6805 7023
Weekly UP BUFL 6905 6374 6640
Daily UP BUFL (DMIP) 7194 7034 7114
240M / 180M / 60M UP DMIP ~6882 ~6828 ~6941
Support zones are tightening as we move from higher to lower timeframes — showing strong buyer interest across levels.

EIEL Potential big winner? Monster candle, 12% up on heavy higher than avg volume, clean breakout from box.

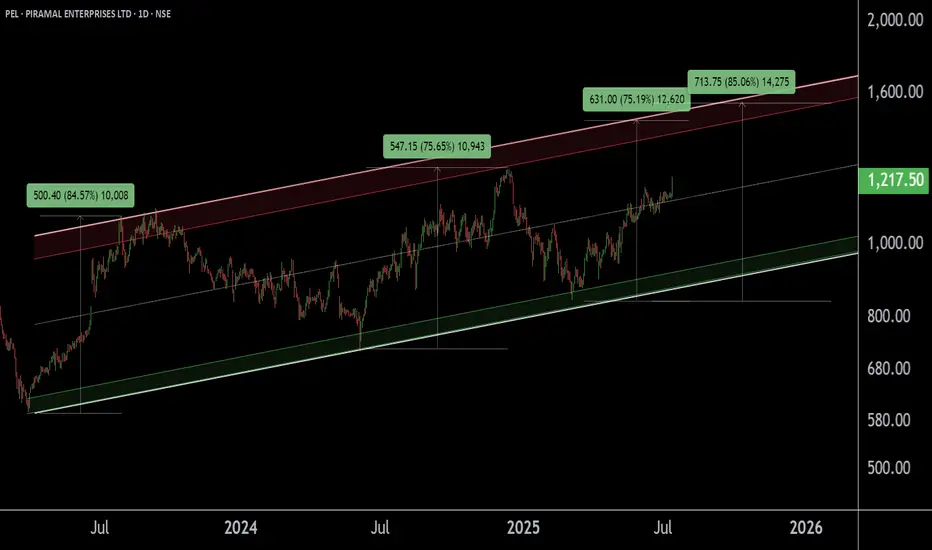
PEL !! PIRAMAL ENTERPRISES LTD appear to be in a Breakout phase This is the Daily Chart of PIRAMAL ENTERPRISES LTD.
PEL is trading above the midline of its ascending parallel channel, with strong support in the ₹1080–₹1150 zone. Historically, whenever it sustains above the midline, it tends to retest the upper boundary resistance of the channel near at 1500 -1540.
If this level is sustain then we may see higher prices in PEL.
Thank You !!

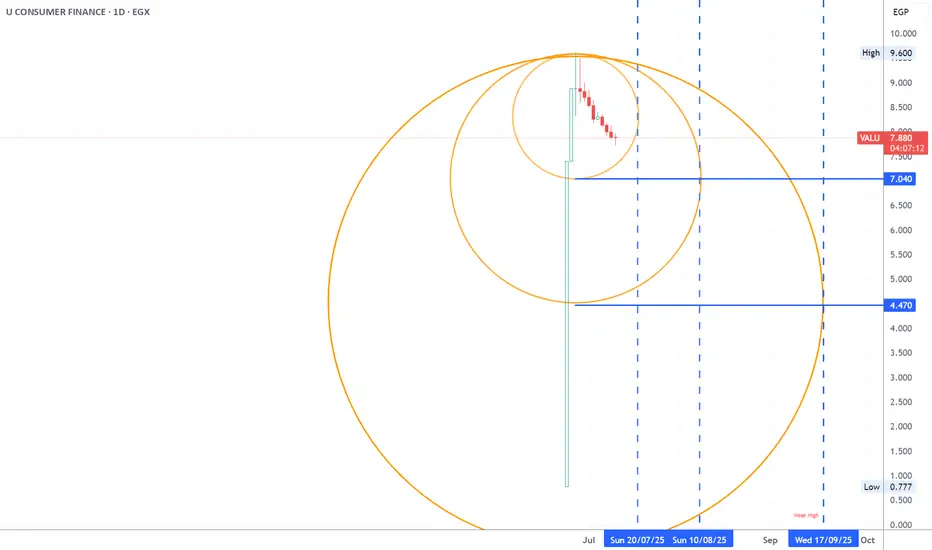
valu suport level and time lines this is a possible support level and time line of the new stock VALU using W.D Gann method
WAAREE PULLBACKAfter a series of higher lows, now punching above recent resistance ₹3,116 & pulling back slightly which is a typical strong breakout action and sector is linked to renewable energy/equipment; explosive EPS growth backs technical breakout.

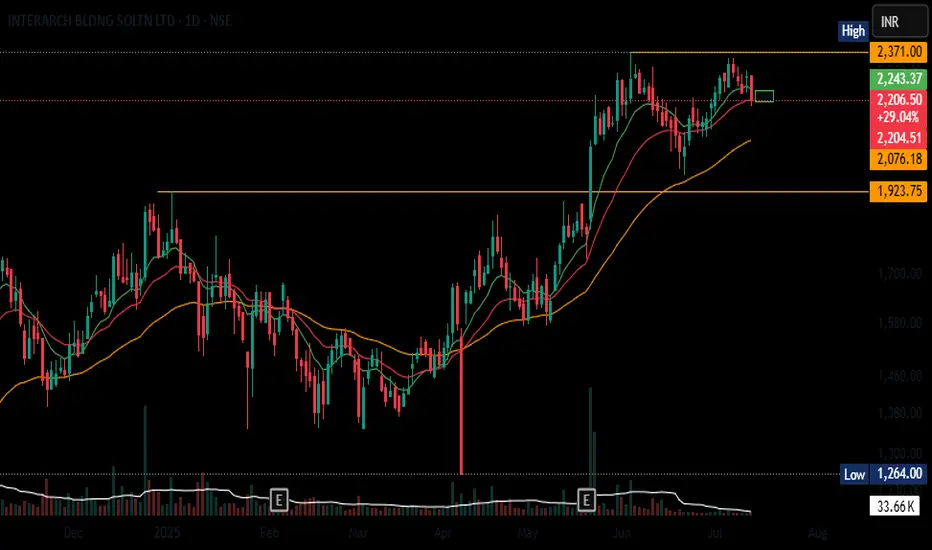
INTERARCH PULLBACK Clean break above prior resistance (₹2,371), now consolidating - A typical retest zone around breakout. Uptrend remains intact