EIEL Potential big winner? Monster candle, 12% up on heavy higher than avg volume, clean breakout from box.

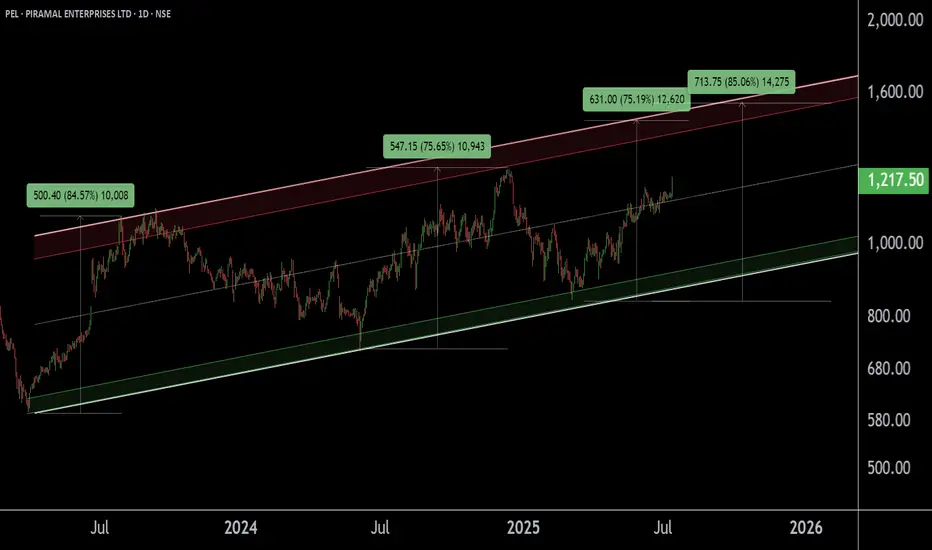
PEL !! PIRAMAL ENTERPRISES LTD appear to be in a Breakout phase This is the Daily Chart of PIRAMAL ENTERPRISES LTD.
PEL is trading above the midline of its ascending parallel channel, with strong support in the ₹1080–₹1150 zone. Historically, whenever it sustains above the midline, it tends to retest the upper boundary resistance of the channel near at 1500 -1540.
If this level is sustain then we may see higher prices in PEL.
Thank You !!

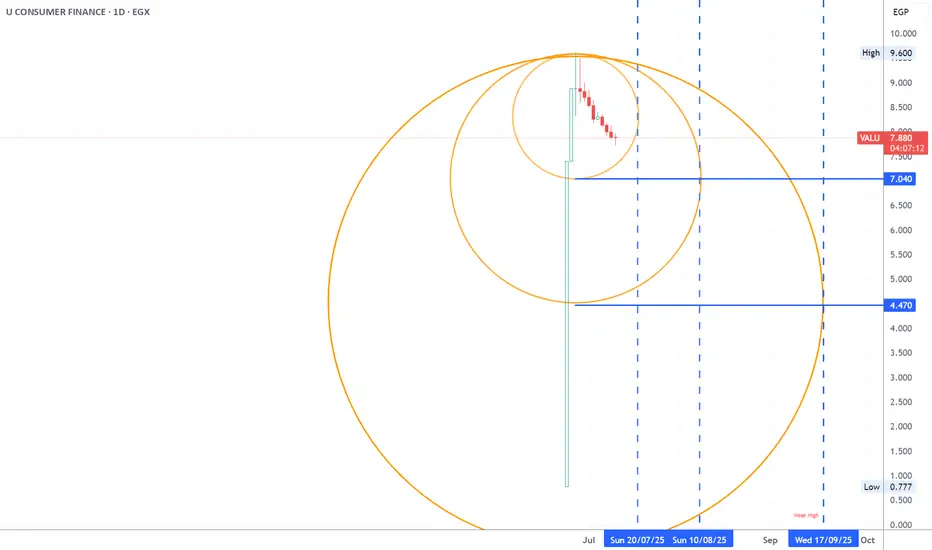
valu suport level and time lines this is a possible support level and time line of the new stock VALU using W.D Gann method
WAAREE PULLBACKAfter a series of higher lows, now punching above recent resistance ₹3,116 & pulling back slightly which is a typical strong breakout action and sector is linked to renewable energy/equipment; explosive EPS growth backs technical breakout.

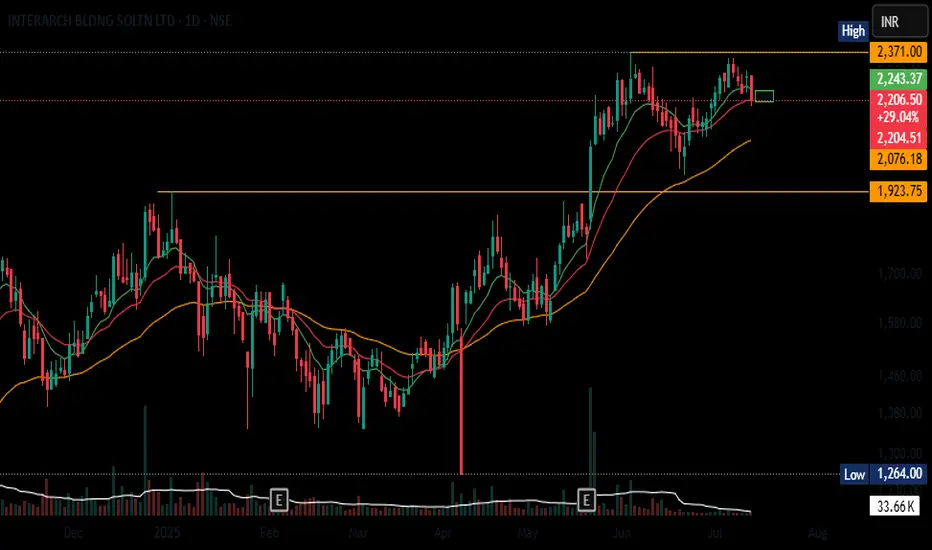
INTERARCH PULLBACK Clean break above prior resistance (₹2,371), now consolidating - A typical retest zone around breakout. Uptrend remains intact
TRANSRAIL PULLBACKBroke out near ₹787 (52-week high), now pulling back slightly — a typical consolidation above breakout. EMAs (50/200) trending up, Structurally strong and profitable; consolidation is natural, watch ₹718–724 zone for possible support.

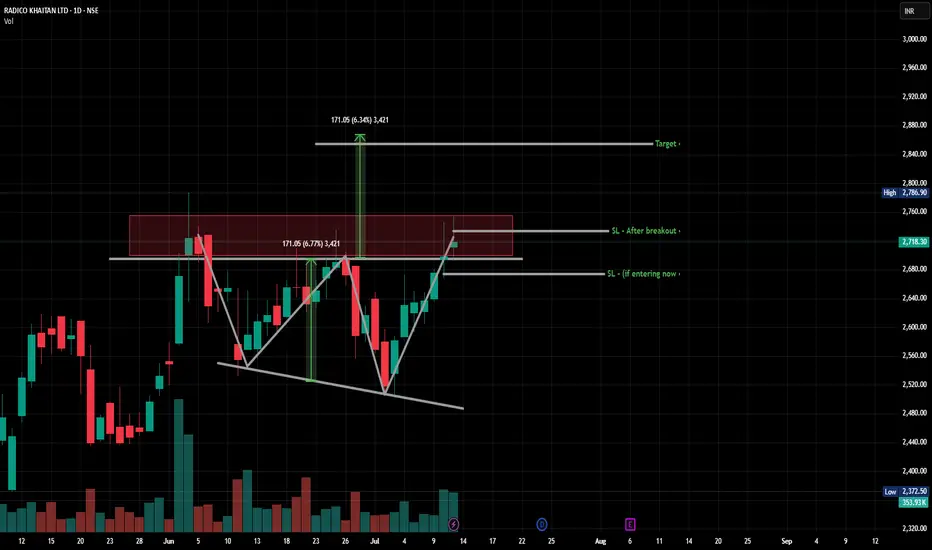
RADICO: Clean W patternNSE:RADICO : A clean W Pattern has formed. But it is kind of screwing up on the resistance. I am waiting till it maybe breaks out of that range because:
High volume
Not looking good :(
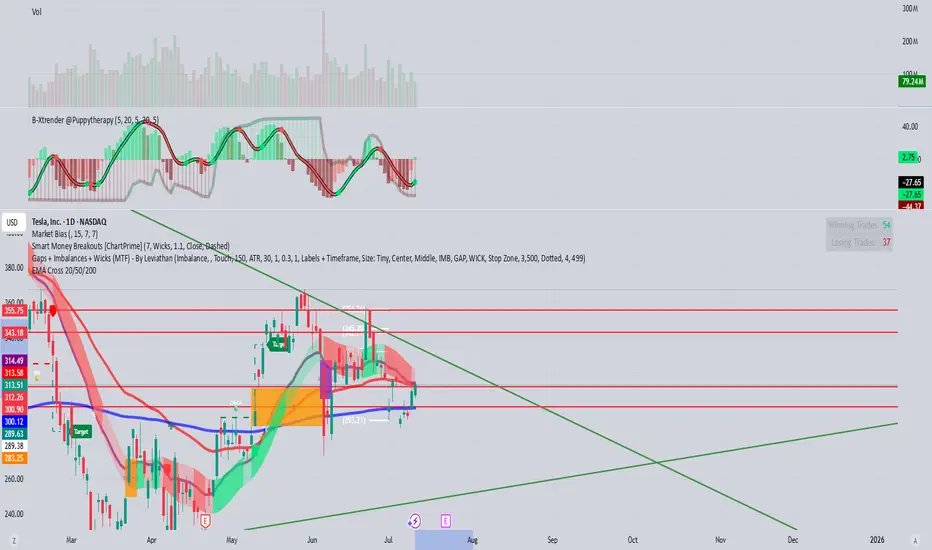
$Tsla $350 looks promisingNASDAQ:TSLA $350 looks promising in the upcoming weeks.
AMEX:SPY NASDAQ:QQQ NFA
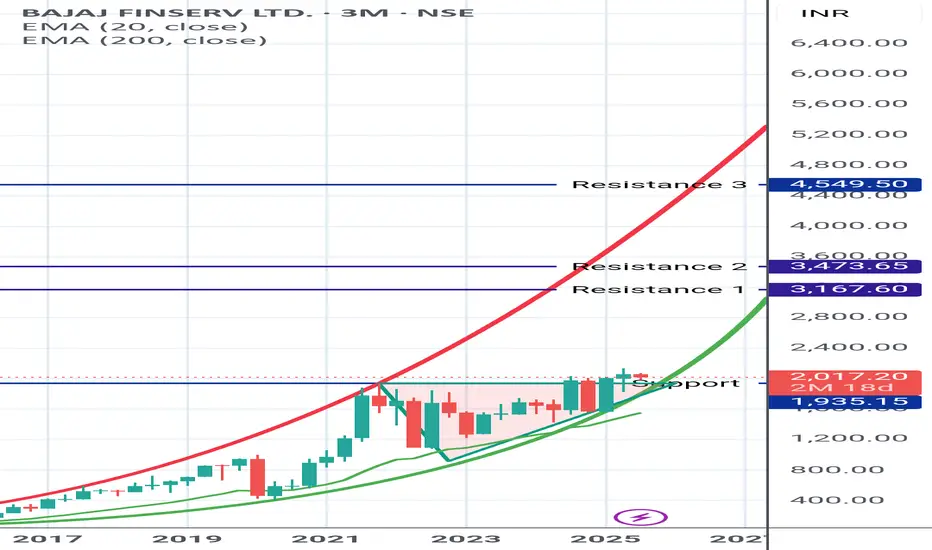
Baj Finserv Bajaj Finserv
looks good in Parabolic uptrend. Recently closed above the triangular marked zone and retesting it.
Can expect fresh rally.
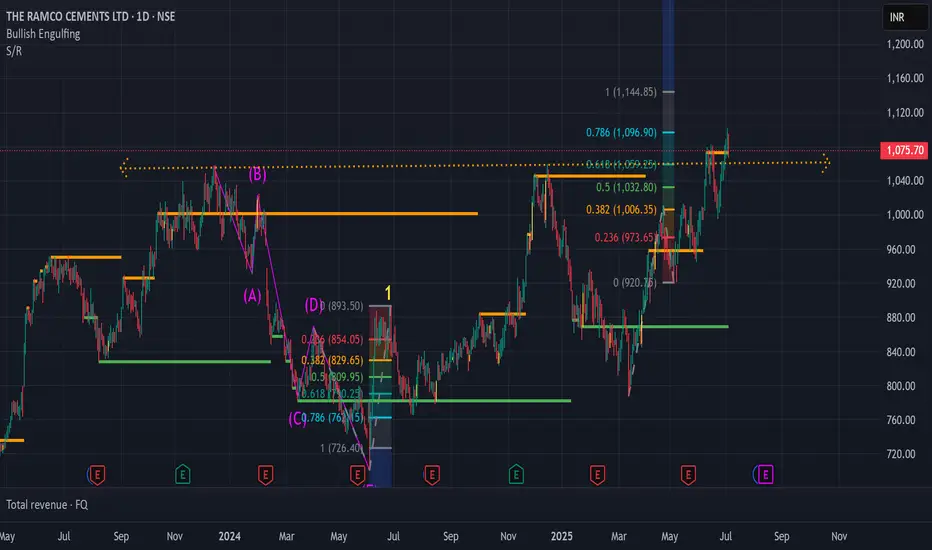
Ramco Cements in BreakoutNSE:RAMCOCEM in breakout. You can buy at 1072 and Target for 1140. Keep the Stop loss at 1050
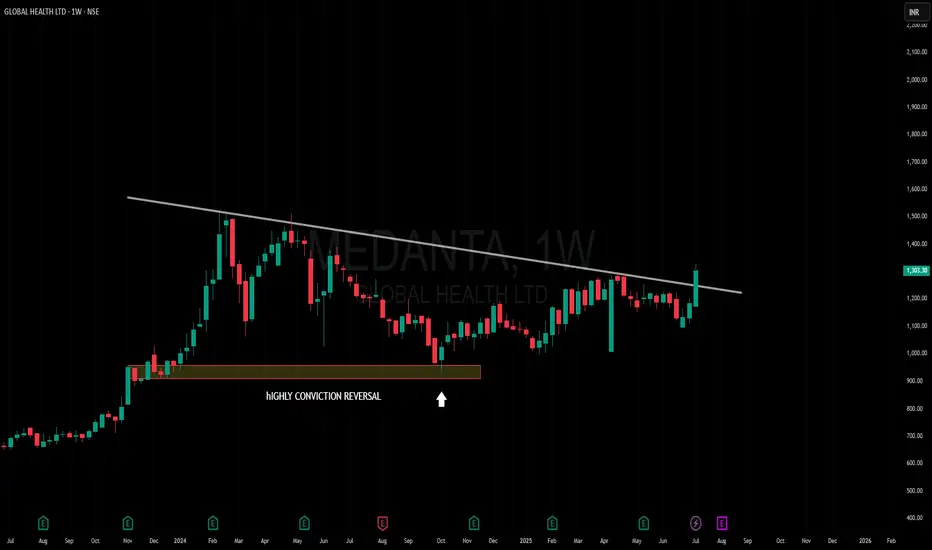
Amazing breakout on WEEKLY Timeframe - MEDANTACheckout an amazing breakout happened in the stock in Weekly timeframe, macroscopically seen in Daily timeframe. Having a great favor that the stock might be bullish expecting a staggering returns of minimum 25% TGT. IMPORTANT BREAKOUT LEVELS ARE ALWAYS RESPECTED!
NOTE for learners: Place the breakout levels as per the chart shared and track it yourself to get amazed!!
#No complicated chart patterns
#No big big indicators
#No Excel sheet or number magics
TRADE IDEA: WAIT FOR THE STOCK TO BREAKOUT IN WEEKLY TIMEFRAME ABOVE THIS LEVEL.
Checkout an amazing breakout happened in the stock in Weekly timeframe.
Breakouts happening in longer timeframe is way more powerful than the breakouts seen in Daily timeframe. You can blindly invest once the weekly candle closes above the breakout line and stay invested forever. Also these stocks breakouts are lifelong predictions, it means technically these breakouts happen giving more returns in the longer runs. Hence, even when the scrip makes a loss of 10% / 20% / 30% / 50%, the stock will regain and turn around. Once they again enter the same breakout level, they will flyyyyyyyyyyyy like a ROCKET if held in the portfolio in the longer run.
Time makes money, GREEDY & EGO will not make money.
Also, magically these breakouts tend to prove that the companies turn around and fundamentally becoming strong. Also the magic happens when more diversification is done in various sectors under various scripts with equal money invested in each N500 scripts.
The real deal is when to purchase and where to purchase the stock. That is where Breakout study comes into play.
Check this stock which has made an all time low and high chances that it makes a "V" shaped recovery.
> Taking support at last years support or breakout level
> High chances that it reverses from this point.
> Volume dried up badly in last few months / days.
> Very high suspicion based analysis and not based on chart patterns / candle patterns deeply.
> VALUABLE STOCK AVAILABLE AT A DISCOUNTED PRICE
> OPPURTUNITY TO ACCUMULATE ADEQUATE QUANTITY
> MARKET AFTER A CORRECTION / PANIC FALL TO MAKE GOOD INVESTMENT
DISCLAIMER : This is just for educational purpose. This type of analysis is equivalent to catching a falling knife. If you are a warrior, you throw all the knives back else you will be sorrow if it hits SL. Make sure to do your analysis well. This type of analysis only suits high risks investor and whose is willing to throw all the knives above irrespective of any sectoral rotation. BE VERY CAUTIOUS AS IT IS EXTREME BOTTOM FISHING.
HOWEVER, THIS IS HOW MULTIBAGGERS ARE CAUGHT !
STOCK IS AT RIGHT PE / RIGHT EVALUATION / MORE ROAD TO GROW / CORRECTED IV / EXCELLENT BOOKS / USING MARKET CRASH AS AN OPPURTUNITY / EPS AT SKY.
LET'S PUMP IN SOME MONEY AND REVOLUTIONIZE THE NATION'S ECONOMY!
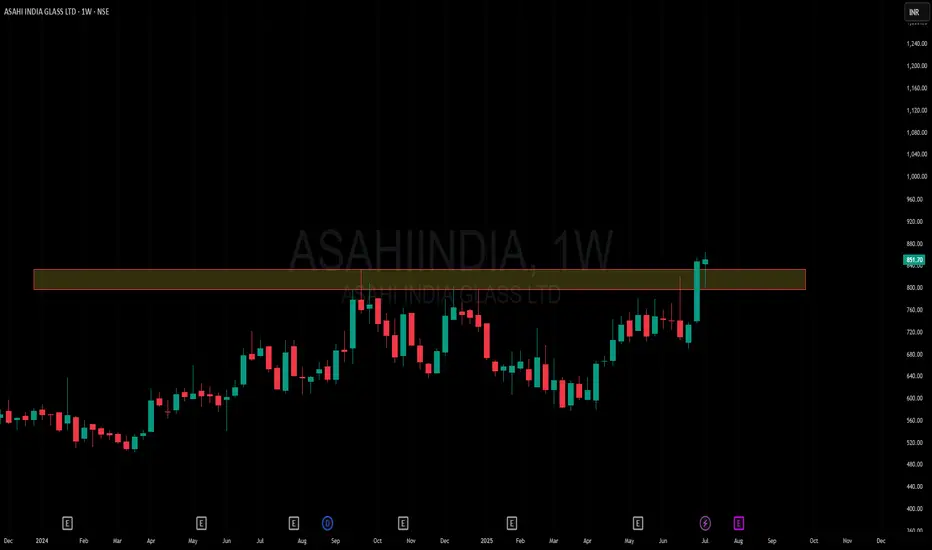
Amazing breakout on WEEKLY Timeframe - ASAHIINDIACheckout an amazing breakout happened in the stock in Weekly timeframe, macroscopically seen in Daily timeframe. Having a great favor that the stock might be bullish expecting a staggering returns of minimum 25% TGT. IMPORTANT BREAKOUT LEVELS ARE ALWAYS RESPECTED!
NOTE for learners: Place the breakout levels as per the chart shared and track it yourself to get amazed!!
#No complicated chart patterns
#No big big indicators
#No Excel sheet or number magics
TRADE IDEA: WAIT FOR THE STOCK TO BREAKOUT IN WEEKLY TIMEFRAME ABOVE THIS LEVEL.
Checkout an amazing breakout happened in the stock in Weekly timeframe.
Breakouts happening in longer timeframe is way more powerful than the breakouts seen in Daily timeframe. You can blindly invest once the weekly candle closes above the breakout line and stay invested forever. Also these stocks breakouts are lifelong predictions, it means technically these breakouts happen giving more returns in the longer runs. Hence, even when the scrip makes a loss of 10% / 20% / 30% / 50%, the stock will regain and turn around. Once they again enter the same breakout level, they will flyyyyyyyyyyyy like a ROCKET if held in the portfolio in the longer run.
Time makes money, GREEDY & EGO will not make money.
Also, magically these breakouts tend to prove that the companies turn around and fundamentally becoming strong. Also the magic happens when more diversification is done in various sectors under various scripts with equal money invested in each N500 scripts.
The real deal is when to purchase and where to purchase the stock. That is where Breakout study comes into play.
Check this stock which has made an all time low and high chances that it makes a "V" shaped recovery.
> Taking support at last years support or breakout level
> High chances that it reverses from this point.
> Volume dried up badly in last few months / days.
> Very high suspicion based analysis and not based on chart patterns / candle patterns deeply.
> VALUABLE STOCK AVAILABLE AT A DISCOUNTED PRICE
> OPPURTUNITY TO ACCUMULATE ADEQUATE QUANTITY
> MARKET AFTER A CORRECTION / PANIC FALL TO MAKE GOOD INVESTMENT
DISCLAIMER : This is just for educational purpose. This type of analysis is equivalent to catching a falling knife. If you are a warrior, you throw all the knives back else you will be sorrow if it hits SL. Make sure to do your analysis well. This type of analysis only suits high risks investor and whose is willing to throw all the knives above irrespective of any sectoral rotation. BE VERY CAUTIOUS AS IT IS EXTREME BOTTOM FISHING.
HOWEVER, THIS IS HOW MULTIBAGGERS ARE CAUGHT !
STOCK IS AT RIGHT PE / RIGHT EVALUATION / MORE ROAD TO GROW / CORRECTED IV / EXCELLENT BOOKS / USING MARKET CRASH AS AN OPPURTUNITY / EPS AT SKY.
LET'S PUMP IN SOME MONEY AND REVOLUTIONIZE THE NATION'S ECONOMY!
Will ITC go further down to 342 As per Harmonic PRZ pattern, if support level at 390 breaks, ITC can go further down to 362 and 342 in few weeks

AAPL - Weekly HV/IV PerspectiveGood evening —
I wanted to do one more write up with that being on NASDAQ:AAPL as we enter the week with futures just opening.
HV10 (16.58%) is trending -11.56% below IV (28.14%) showing a weekly price gap differential of -$2.89 on the stated implied move to what trending markets are doing. This current IV value entering the week sits 69% within the sliding year spectrum.
Now, with Apple consolidating in range for almost eight weeks after selling off when it reached its 4T milestone in December of 2024, has now begun advancing back upwards in price. The strength here is obvious and the quality of company is well, Apple.
My price targets on the week is first the upper band of stated IV ($220.58) then moving on towards the upper implied range of HV63 ($225.87). I believe the markets are going to push apple higher while balancing the indices out selling off in other areas. This would start to accelerate HV10, as it is now 91.23% coiled to its yearly lows and needs to unwind. Hopefully with a few short-term trending days increasing we find our regression.
Please come back next week and see how our position and volatility progressed forward.

Trading Thesis: Frozen M&A Firestarter– Is LW the Next Takeover 🧠 Trading Thesis: “Frozen M&A Firestarter – Is LW the Next Takeover Pop?”
📉 Ticker: NYSE:LW
🗓️ Timeframe: Daily (1D)
📍 Current Price: $51.32
📈 Fibonacci Extension Target: $136.62 – $170.88
📉 Downside Risk: ~$47.90 if activist push fails
🔭 Time Horizon: 2–6 months
🔍 WaverVanir Thesis
Lamb Weston ( NYSE:LW ) is sitting at the intersection of activist disruption, undervalued fundamentals, and surging options flow. Our proprietary scanner is flashing multiple option sweeps — particularly short-dated call activity — signaling that institutional players may be positioning for a near-term event.
⚡ Catalysts in Focus
📢 Activist Campaign: Jana Partners is pushing hard for a strategic overhaul. With six new executive recruits and a potential board shakeup, institutional change is now not just possible — it's probable.
🔄 CEO Exit & Earnings Reset: The company recently ousted its CEO following a soft Q2 and issued a major guidance cut. These events often precede strategic restructuring or M&A.
🤝 Takeover Chatter: Both Reuters and Seeking Alpha confirm that Lamb Weston is a prime M&A candidate, with rumors swirling around Post Holdings and other potential bidders.
🌐 Macro Environment
🥔 Weak global demand in frozen potato products & foodservice channel.
📉 High OpEx + shrinking restaurant traffic = near-term pressure.
🧊 But with supply chain normalization and margins likely bottoming, the risk/reward starts favoring the upside — especially under new leadership.
📐 Technical Levels
📉 Demand Zone: $47.90–$50.79 (Previous support, 0% Fib)
📊 Target 1: $76.80 (38.2% retracement)
📊 Target 2: $136.62 (127.2% Fib extension – full revaluation)
🎯 Long-term Target: $170.88 (institutional re-pricing scenario)
⛓️ Stop-Loss: Daily close below $47.00 (invalidates structure)
🧠 WaverVanir DSS Signal
Our Decision Support System (DSS) is generating a bullish reversion setup with macro catalysts. Volume Profile confirms accumulation at $50–52 range. Watch for breakout from this base as institutional call flows build pressure.
🧭 Strategic Outlook
Base Case: Gradual recovery toward $76–90 range (re-rating after activist news).
Bull Case: Activist success + M&A = sharp revaluation toward $136–171.
Bear Case: Weak guidance persists, potential fade toward $40.
⚠️ Disclaimer: This is not financial advice. WaverVanir posts are for informational and educational purposes only. Trade with caution, manage your risk.
🧩 #Tags:
#WaverVanir #LambWeston #ActivistInvesting #OptionsFlow #MergersAndAcquisitions #TradingThesis #DSS #InstitutionalTrading #FrozenFoods #EarningsPlay #SmartMoney #TechnicalAnalysis #VolumeProfile #OptionsAlert #ValueSetup #MBO

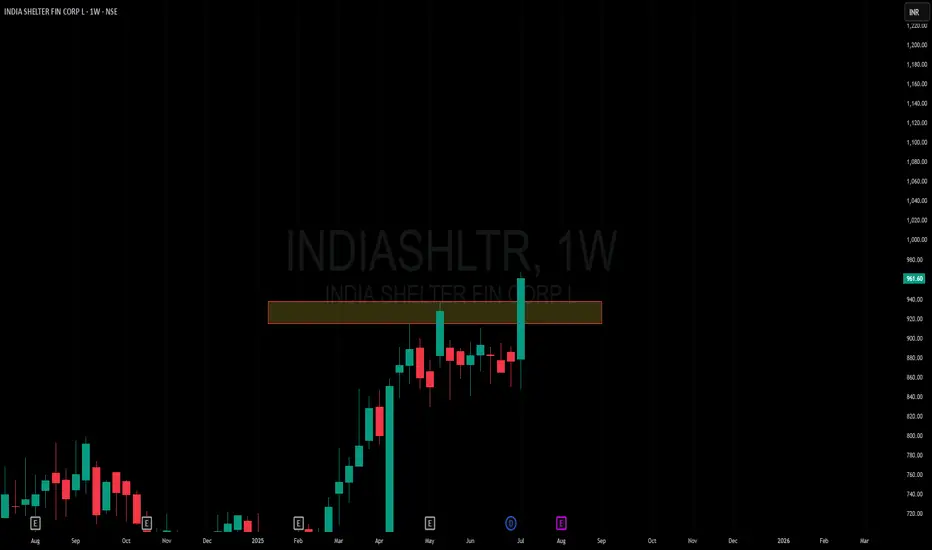
Amazing breakout on WEEKLY Timeframe - INDIASHLTRCheckout an amazing breakout happened in the stock in Weekly timeframe, macroscopically seen in Daily timeframe. Having a great favor that the stock might be bullish expecting a staggering returns of minimum 25% TGT. IMPORTANT BREAKOUT LEVELS ARE ALWAYS RESPECTED!
NOTE for learners: Place the breakout levels as per the chart shared and track it yourself to get amazed!!
#No complicated chart patterns
#No big big indicators
#No Excel sheet or number magics
TRADE IDEA: WAIT FOR THE STOCK TO BREAKOUT IN WEEKLY TIMEFRAME ABOVE THIS LEVEL.
Checkout an amazing breakout happened in the stock in Weekly timeframe.
Breakouts happening in longer timeframe is way more powerful than the breakouts seen in Daily timeframe. You can blindly invest once the weekly candle closes above the breakout line and stay invested forever. Also these stocks breakouts are lifelong predictions, it means technically these breakouts happen giving more returns in the longer runs. Hence, even when the scrip makes a loss of 10% / 20% / 30% / 50%, the stock will regain and turn around. Once they again enter the same breakout level, they will flyyyyyyyyyyyy like a ROCKET if held in the portfolio in the longer run.
Time makes money, GREEDY & EGO will not make money.
Also, magically these breakouts tend to prove that the companies turn around and fundamentally becoming strong. Also the magic happens when more diversification is done in various sectors under various scripts with equal money invested in each N500 scripts.
The real deal is when to purchase and where to purchase the stock. That is where Breakout study comes into play.
Check this stock which has made an all time low and high chances that it makes a "V" shaped recovery.
> Taking support at last years support or breakout level
> High chances that it reverses from this point.
> Volume dried up badly in last few months / days.
> Very high suspicion based analysis and not based on chart patterns / candle patterns deeply.
> VALUABLE STOCK AVAILABLE AT A DISCOUNTED PRICE
> OPPURTUNITY TO ACCUMULATE ADEQUATE QUANTITY
> MARKET AFTER A CORRECTION / PANIC FALL TO MAKE GOOD INVESTMENT
DISCLAIMER : This is just for educational purpose. This type of analysis is equivalent to catching a falling knife. If you are a warrior, you throw all the knives back else you will be sorrow if it hits SL. Make sure to do your analysis well. This type of analysis only suits high risks investor and whose is willing to throw all the knives above irrespective of any sectoral rotation. BE VERY CAUTIOUS AS IT IS EXTREME BOTTOM FISHING.
HOWEVER, THIS IS HOW MULTIBAGGERS ARE CAUGHT !
STOCK IS AT RIGHT PE / RIGHT EVALUATION / MORE ROAD TO GROW / CORRECTED IV / EXCELLENT BOOKS / USING MARKET CRASH AS AN OPPURTUNITY / EPS AT SKY.
LET'S PUMP IN SOME MONEY AND REVOLUTIONIZE THE NATION'S ECONOMY!
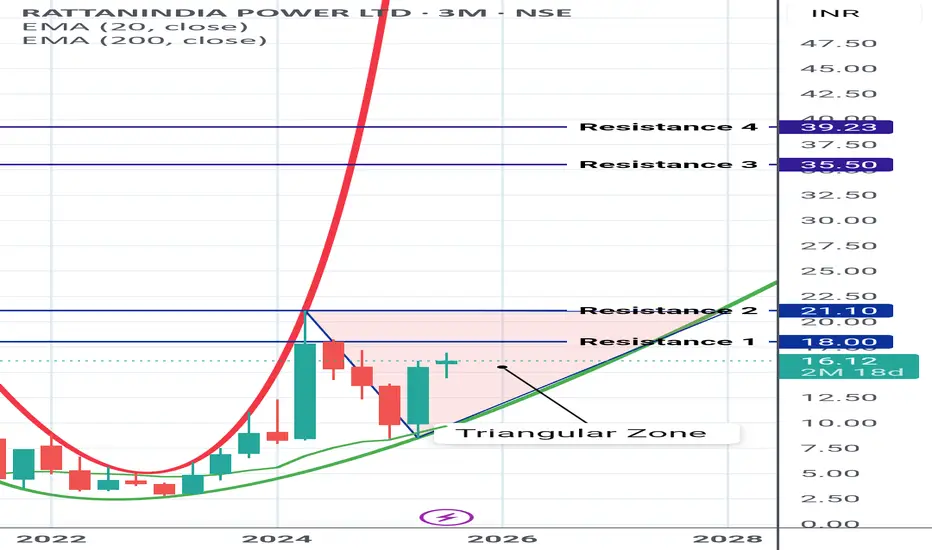
Rattan India Power (RTN POWER) RTN POWER having good power to cross the marked Triangular zone.
On closing above the triangular zone, the above marked horizontal lines will be the resistances
Shared it for Reference purpose based on chart pattern.
My buy view for Hims & Hers stock. My buy view for Hims & Hers stock.
Overall, I believe this asset is still in a bullish direction. I remember hoping into accummulating this stock when it dropped from $64 to $41 at the open of market on 23/6/2025 which I sold off when it hit $50.
However, I still hold a strong buy bias with my entry and exit showing on my chart (analysis).
Please trade with care as I still look forward to $64 per share for this stock long-term.
Please, kindly like, share your thoughts via comment and follow me for more.

$NVDA – Going Long Long LONGTaking a long position here at $98 – yes, despite the noise.
There’s no denying the pressure across semiconductors following renewed tariff threats from the Trump administration. But I believe this is more short-term overreaction than long-term damage. Any meaningful negotiation or de-escalation could act as a slingshot for these names, especially leaders like Nvidia.
Nvidia's fundamentals remain incredibly strong. The company is still outpacing its peers in AI, data centers, and gaming hardware. Profitability remains intact, and there’s no indication of a breakdown in their competitive edge.
Technicals are giving us some strong signals:
We're seeing a long-term bullish divergence forming.
RSI is approaching oversold territory – rare for Nvidia and historically a signal for strong bounces.
Price is nearing key long-term support levels that held in previous cycles.
I'm positioning early here because I believe the broader market is mispricing geopolitical risk. If the situation improves – and it often does faster than expected – NVDA is one of the first names that will rebound aggressively.
Let’s see how this plays out, but I’m confident this is a high-conviction entry point in the 80's and 90's.
