accumulation tradingRefers to a phase in the price movement where there is consistent buying activity by investors or traders. During this phase, the price may not show significant upward movement, but there is a gradual increase in demand for the asset.
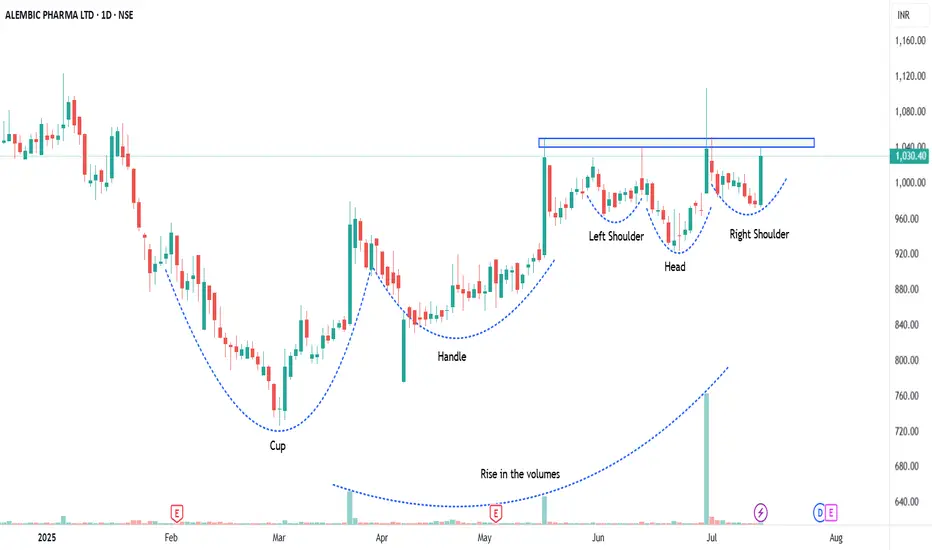
APLLTD - Head & Shoulder patternAll details are given on chart for educational purpose only. If you like the analyses please do share it with your friends, like and follow me for more such interesting charts.
Disc - Am not a SEBI registered analyst. Please do your own analyses before taking position. Details provided on chart is only for educational purposes and not a trading recommendation
MSFT watch $392.76-394.12: Key Resistance to Tariff RecoveryMSFT testing a well proven Resistance zone $392.76-394.12
This zone rejected twice already, now may be ready to break?
Fib reactions have been precise, so look for Break-n-Retest

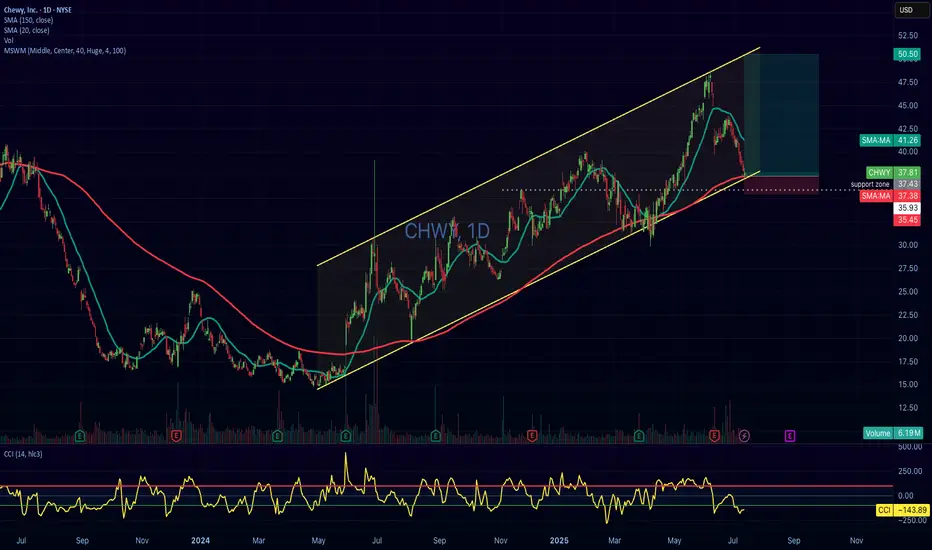
CHWY Long – Swing from 150 SMA Support with Oversold CCI and GapNYSE:CHWY
📅 Entry: July 15, 2025
📉 Price: 37.80
✋ Stop: 35.82
🎯 Target: 50.87
⚖️ Risk-Reward: 1:6.6
✅ Status: Active
🧠 Trade Idea:
CHWY is testing the lower bound of a well-defined ascending channel, while also bouncing from the 150-day simple moving average (SMA150) — a strong technical support area.
Additional bullish signals include:
The price is significantly stretched below the 20-day SMA, suggesting a potential mean-reversion move.
The Commodity Channel Index (CCI) is deeply oversold (around -143), starting to curl upwards — a classic reversal signal.
There's an open gap above near the $47 level, providing a natural swing target.
📌 This trade aims to capitalize on a high-probability reversal setup, with strong confluence of support, momentum shift, and attractive risk-reward.
#swingtrading #CHWY #technicalanalysis #stocks #tradingview #longsetup #riskreward #CCI
FTNT - Precision Swing Trade Setup📈 Symbol: FTNT (Fortinet)
⌛ Timeframe: Daily Chart
⚡ Strategy: High-Conviction Swing Trade (5-10 days)
🎯 Pinpoint Trade Execution
Entry: $103.00 (Key psychological level + SMA 50 confluence)
Stop-Loss: $95.80 (7% risk, below July swing low)
Take-Profit: $118.16 (14.7% upside, pre-earnings resistance)
Risk-Reward: 1:2.1 (Optimized ratio)
📊 Technical Rationale
✅ Triple Confirmation Setup:
Connors RSI2 Signals: Back-to-back buy triggers (July 10-11)
Volume Surge: 30% above 20-day avg on reversal candle
MACD Flip: Bullish crossover at -2.5 (oversold rebound)
Key Levels:
Defense Line (SL): $95.80 (Protects against false breakout)
Profit Zones:
$110.50 (Partial take-profit at 50% Fib)
$118.16 (Full exit at 61.8% Fib + VWAP resistance)
⚡ Smart Trade Management
1️⃣ Entry: $103.00 limit order
2️⃣ Stop Strategy:
Initial SL: $95.80
Adjust to $101.00 if price hits $108.00
3️⃣ Profit Plan:
Sell 30% at $110.50
Trail remainder with 2-bar low exit
🌐 Fundamental Context
Earnings Date: July 25 (Plan exit before)
Short Interest: 8.5% float (squeeze potential)
Institutional Activity: 13F filings show $200M+ inflows
⚠️ Critical Risk Notes
Sector Risk: Tech volatility (monitor SOXX ETF)
Earnings Gap Risk: July 25 event may override technicals
Alternative Scenario: Invalidated below $95.80 → Wait for retest
#PrecisionTrading #Cybersecurity #RiskReward
👇 Like/Comment if you'd take this trade!
🔔 Follow for institutional-grade setups
(Chart: Daily timeframe with Fib levels + volume profile)

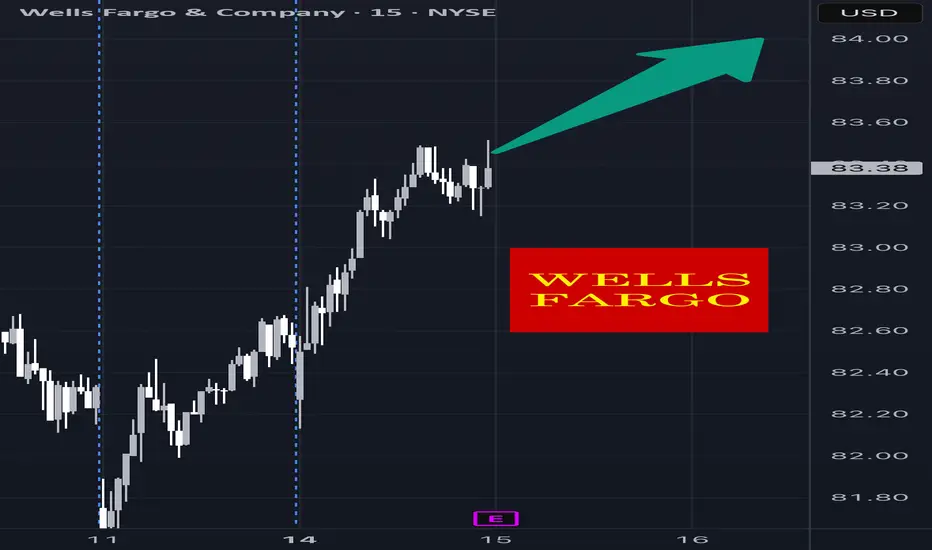
WFC Earnings Setup – 07/14/2025 $86C | Exp. July 18 | Betting on
📈 WFC Earnings Setup – 07/14/2025
$86C | Exp. July 18 | Betting on a Bank Bounce
⸻
🔥 EARNINGS HEAT CHECK
💼 WFC reports BMO (07/15)
📊 Historical move avg: ~3–5%
📍 Current price: $82.53
📈 Above 20D/50D MAs → trend intact
⚠️ RSI = 78.07 = overbought 🚨
💥 Expected move: $2.89
⸻
🧠 SENTIMENT SNAPSHOT
🔄 Call OI stacked at $86
🔻 Put OI focused at $81
⚖️ Balanced flow → slight bullish tilt
🧾 IV is elevated, so IV crush is coming
⸻
🏦 SECTOR SUPPORT
• Financials showing strength 📈
• No major institutional bias
• VIX @ 16.40 → macro calm = earnings-friendly
⸻
🎯 Trade Plan – IV Exploitation Setup
{
"ticker": "WFC",
"type": "CALL",
"strike": 86,
"exp": "2025-07-18",
"entry": 0.81,
"target": 1.62,
"stop": 0.40,
"size": 1,
"confidence": "70%",
"entry_timing": "pre-earnings close"
}
🔹 Call Entry: $0.81
🎯 Profit Target: $1.62 (+100%)
🛑 Stop: $0.40 (-50%)
📅 Expiry: 07/18/25
📆 Earnings Date: 07/14 (BMO)
📈 Expected Move: ~$2.89
🧠 Confidence: 70%
⸻
⚠️ Key Risks
• IV crush = quick decay if WFC doesn’t move
• Guidance could swing the stock either direction fast
• Overbought = short-term pullback risk even on good earnings
✅ Why $86C?
• Just outside expected move
• High OI = liquidity
• Reasonable premium = good risk/reward
⸻
📣 Model Consensus:
“Moderately Bullish” — strong setup but keep it tight around earnings!
Tag your favorite bank stock trader 🏦👇
Who’s playing WFC earnings this quarter?
#WFC #EarningsPlay #OptionsTrading #CallOption #BankingStocks #IVCrush #RiskReward #AITrading #
JPM Breakout in Play – Target $295+
🧠 Chart Analysis Summary:
Pattern: Symmetrical triangle breakout has occurred. Momentum is building.
Current Price: $288.58
Breakout Confirmation: Price closed above resistance trendline (pink), signaling potential bullish move.
📊 Key Levels:
Entry Zone: $288.50–289.00
Resistance/Targets:
Minor Resistance: $291.87 (red line)
Main Target: $295.54 (green line)
Support Zone:
$284.00–285.00 (white zone, strong base)
🎯 Trade Plan (Bullish Setup):
Entry: $288.60
Target: $295.00–295.50
Stop-Loss: Below $284.00

BK Earnings Trade Setup – 07/14/2025 $97.50C | Exp. July 18 | Ri
📈 BK Earnings Trade Setup – 07/14/2025
$97.50C | Exp. July 18 | Riding the Sector Wave
⸻
🔥 BULLISH EARNINGS SETUP
🏦 BK sits at $93.69, just under its 52W high of $95.10
📈 Strong trend + volume rising pre-earnings
📊 RSI = 76.29 → overbought, but could break out on positive earnings
⸻
🧠 Macro + Sector Check
• Financials are strong across the board 🟢
• Analysts bullish on BK 📣
• VIX at 16.40 = market calm = earnings plays viable
⸻
🎯 Earnings Trade Plan – High OI Strike
{
"ticker": "BK",
"type": "CALL",
"strike": 97.50,
"exp": "2025-07-18",
"entry": 0.90,
"target": 1.80,
"stop": 0.45,
"size": 1,
"confidence": "75%",
"entry_timing": "pre-earnings close"
}
🔹 Call Entry: $0.90
🎯 Target: $1.80 (+100%)
🛑 Stop: $0.45
📆 Expiry: 07/18/2025
📈 Expected Move: ~4%
📅 Earnings Date: 07/15 (BMO)
📊 Confidence: 75%
⸻
📌 Why $97.50C?
✅ High OI
✅ Matches expected move
✅ Good leverage near key levels
⸻
⚠️ Risk Note:
• RSI is hot 🔥
• If earnings miss → IV crush hits hard
• Not a diamond-hands trade — manage it tight
⸻
💬 Model Take:
“Moderately Bullish” — everything’s aligned, but keep stops tight due to overbought conditions.
Tag your earnings squad 📢 — BK is in play.
#BK #EarningsPlay #OptionsTrading #CallOption #FinancialSector #BreakoutSetup #

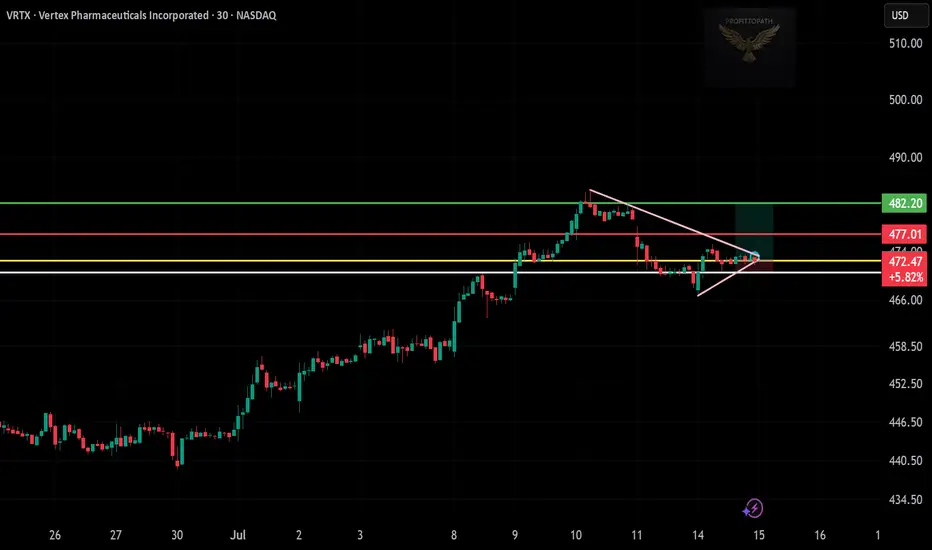
VRTX Tight Triangle Breakout – Watch Closely
🧠 Chart Analysis Summary:
Pattern: A symmetrical triangle is visible, tightening toward the apex with a breakout just forming.
Current Price: $472.47 (breakout near)
Key Levels:
Support Zone: Around $468–470 (white/yellow zone)
Resistance Zone:
First Target: $477.01 (red line)
Major Target: $482.20 (green line)
Volume Confirmation: Suggested to confirm breakout with volume increase.
📊 Trade Idea (Long Setup):
Entry: $472.50–473.00
Target 1: $477.00
Target 2: $482.00
Stop-Loss: Below $468.00
Limited downside risk for CRB HoldingsI will be nibbling this stock this week as I believe the bottom is here and while I may not buy at the exact bottom, I believe the premium segment of CRB Holdings will continue to grow strong.
The upside potential is high.
Please DYODD

Mean Reversion Trade: QCOM1. RSI in oversold region
2. Price likely to rebound back the the mean
Trade Rules:
Entry Trigger - RSI has cross below oversold region, enter limit buy at close price
Exit Trigger - Close at market when close price cross above exit trigger (Red step line)

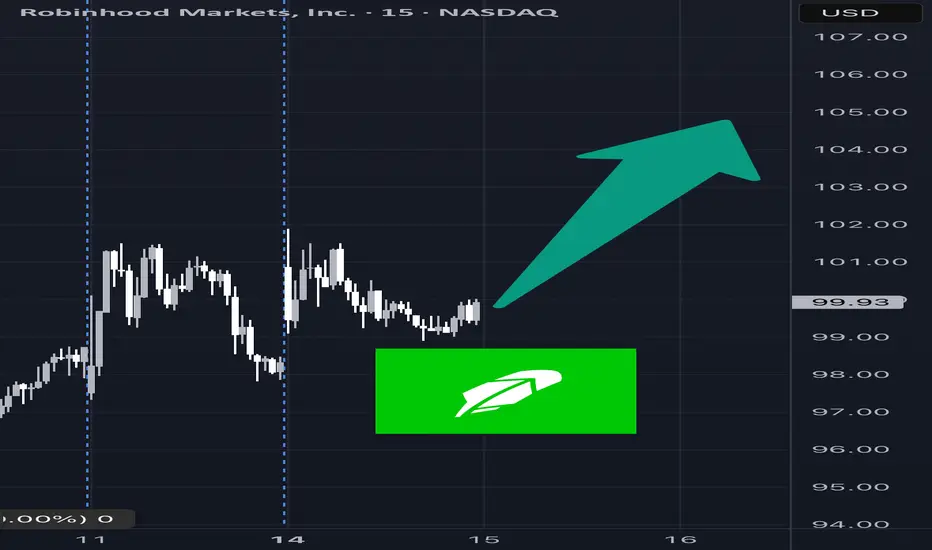
HOOD Weekly Call Option Setup – 07/14/2025 $106C | Exp. July 18
📈 HOOD Weekly Call Option Setup – 07/14/2025
$106C | Exp. July 18 | Breakout Watch Above $100 👀
⸻
🔥 BULLISH MOMENTUM BUILDING
🟢 HOOD is pushing hard into $100 resistance — price riding above 10/50/200 EMAs on all timeframes.
📊 RSI hot (65.6 on 5m / 71.6 daily), but not maxed out — short-term pullback possible, but trend still bullish.
💰 Volume + call flow favor more upside.
⸻
📰 Catalyst:
Positive crypto market sentiment = increased trading activity = good for HOOD’s core business.
VIX at 16.40 = risk-on environment = perfect for high-beta names like this one.
⸻
🎯 Trade Plan – High R/R Call Setup
Clean structure, riding sentiment — but be quick around $100.
{
"ticker": "HOOD",
"type": "CALL",
"strike": 106,
"exp": "2025-07-18",
"entry": 0.92,
"target": 1.38,
"stop": 0.46,
"size": 1,
"confidence": "70%",
"entry_timing": "market open"
}
🔹 Entry: $0.92
🎯 Target: $1.38 (+50%)
🛑 Stop: $0.46 (-50%)
📅 Expiry: 07/18/25
📈 Confidence: 70%
💼 Strategy: Naked Call
⸻
💬 Model Consensus:
“Moderately Bullish” — clean momentum + bullish call flow = good entry.
⚠️ Watch RSI + $100 resistance — quick rejection is possible.
⸻
📌 Why $106C?
🔸 OI building there → potential magnet
🔸 Cheaper than ATM but within reach
🔸 High gamma setup if we break $100 early
⸻
💡 Trade Smart:
🏃 Get in early → fade into strength
🧠 Position size accordingly → don’t get greedy
📢 Tag your trading buddy who’s still ignoring HOOD 😏
#HOOD #OptionsTrading #BreakoutSetup #CryptoMomentum #AITrading #CallOptions #FlowPlay #TradingView #0DTE #
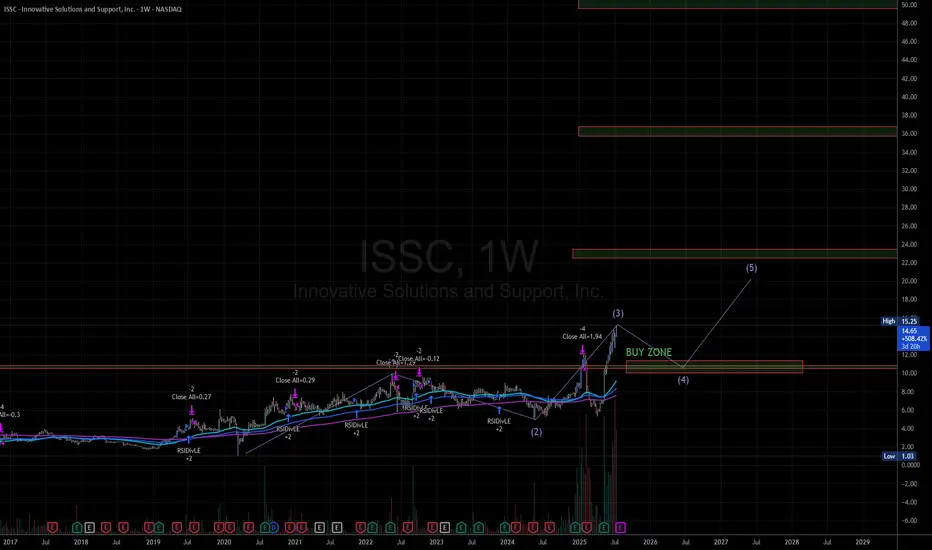
Waitimg for the 4th Wave at $10-11 RangeWaiting for price to pull back and stabilize at the 4th Wave $10-11 Range. Looking to jump in at that price range. Looking to sell at the 23, 35, 50 price ranges.
CVNA will falling rates save this darling?VNA (Carvana Co.) shows a strong bullish trend with a breakout setup forming. Here’s a detailed technical analysis:
📈 Trend Analysis: Strong Uptrend
CVNA has been in a clear uptrend, characterized by higher highs and higher lows since March.
The ascending yellow trendline confirms consistent buying interest with each pullback being bought.
This trendline is acting as dynamic support and continues to hold the structure of the uptrend intact.
📊 Consolidation Below Resistance
The stock is currently consolidating just below the horizontal resistance at $75.42.
Multiple candles are pressing against this level without significant rejection, which is a bullish sign of accumulation.
Consolidation under resistance, particularly in an uptrend, often leads to a bullish breakout.
🧱 Key Levels
Resistance: $75.42 – Price has tested this level multiple times, forming a potential bullish breakout level.
Support: $67.87 – A key horizontal level from a prior breakout area. Also roughly aligns with the ascending trendline, giving this support more significance.
🔊 Volume Analysis
Volume has been steady but slightly rising as price approaches the resistance.
Watch for a volume spike on the breakout above $75.42, which would add strong confirmation of buying interest and trigger potential upside follow-through.
📍 Potential Scenarios
✅ Bullish Breakout
A clean close above $75.42 could ignite a breakout move.
Potential target zones:
$80–82 short term, based on the height of the previous consolidation.
Higher if momentum builds, given the strength of the current trend.
⚠️ Bearish Pullback
If price fails to break out and drops below the trendline, it could trigger a short-term correction.
First support test would be $67.87; a break below this could shift sentiment bearish in the short term.
🧠 Summary
CVNA is showing classic bullish continuation signals: strong uptrend, consolidation below resistance, and rising support. This ascending triangle pattern often resolves to the upside. Traders should watch for a breakout above $75.42 with volume for a potential entry, while maintaining awareness of support at $67.87 for risk management.
AAPL PREPARING FOR A LARGER MOVEAAPL clearly shows a descending channel pattern, marked by two parallel downward-sloping yellow trendlines. Within that broader structure, the price is currently consolidating in a narrow range between two horizontal yellow lines:
Resistance around $210.98
Support around $207.46
🔍 Current Technical Setup
Consolidation Range
AAPL is moving sideways in a tight range between $207.46 and $210.98. This narrow trading zone within a broader descending channel is typical of compression before a breakout.
Descending Channel Context
The channel suggests a longer-term downtrend bias, but the compression at these levels can lead to a breakout in either direction, especially when volume starts to increase.
Support Zone ($207.46)
This level has been tested and held, making it a key line to watch. A breakdown below this support would likely trigger a sharper selloff toward the lower channel boundary, near $203–$204.
Resistance Zone ($210.98)
This level lines up with the upper boundary of the current consolidation and the midline of the descending channel. A breakout above would invalidate the local downtrend and could send price to test the top of the channel (~$214+).
Volume Clues
Volume is relatively low during this sideways movement, which often precedes a high-volume breakout as indecision resolves.
📈 Scenarios to Watch
Bullish Breakout
Above $210.98 and the descending trendline.
Likely target: $214–$216
Confirmation: Volume spike + strong bullish candle
Bearish Breakdown
Below $207.46 support.
Target: $203 or lower, testing channel support.
Confirmation: Increasing red volume + bearish momentum
🧠 Summary
AAPL is in a compressed state, with a tight horizontal range forming inside a broader downward-sloping channel. This often sets the stage for a powerful directional move. Traders should closely monitor breaks of $210.98 or $207.46 to catch the next leg — either a reversal toward higher levels or continuation of the downtrend.

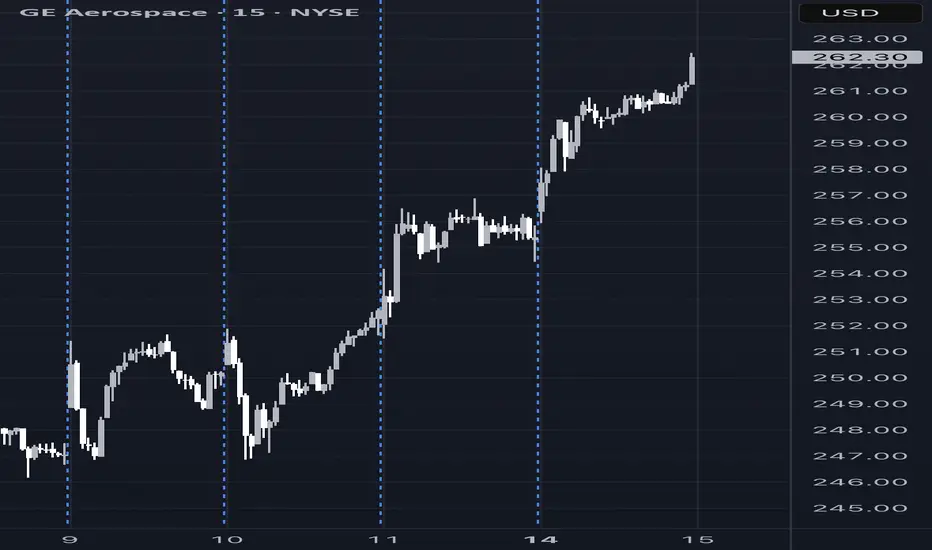
GE Weekly Options Trade Setup – 07/14/2025 $290C | Exp. July 18
📈 GE Weekly Options Trade Setup – 07/14/2025
$290C | Exp. July 18 | Bullish Catalyst In Play
⸻
🔥 BULLISH MOMENTUM CONFIRMED
✅ All 5 major AI models (Grok, Claude, Gemini, Llama, DeepSeek) agree:
GE just broke out — strong momentum, price above MAs, MACD bullish.
📰 Catalyst: Citigroup Upgrade 💥
Low implied volatility + analyst boost = ideal environment for calls.
⚠️ Caution: RSI is overbought, signaling possible short-term pullback. This is a fast trade, not a swing.
⸻
🎯 Trade Plan – High Conviction Setup
Entry at open, ride breakout continuation 🚀
{
"ticker": "GE",
"type": "CALL",
"strike": 290,
"exp": "2025-07-18",
"entry": 0.89,
"target": 1.78,
"stop": 0.45,
"size": 1,
"confidence": "70%",
"entry_timing": "market open"
}
🔹 Entry: $0.89
🎯 Target: $1.78 (+100%)
🛑 Stop: $0.45 (-50%)
📅 Expiry: 07/18/25
📈 Confidence: 70%
💼 Strategy: Naked Call
⸻
📌 Why $290C?
High strike = low cost, great R/R. High OI, and supported by breakout levels from DeepSeek & Grok models.
🧠 Model Sentiment:
“Moderately Bullish” – All point to upside, but suggest smart risk management due to hot RSI.
⸻
💡 Quick Notes
⚠️ Overbought ≠ reversal — just be quick.
📊 Citigroup news is driving flows — but don’t hold into chop.
💬 Tag someone who’s been sleeping on GE 👇
#GE #OptionsTrading #BreakoutPlay #CallOption #AITrading #WeeklySetup #FlowWatch #0DTE #tradingview
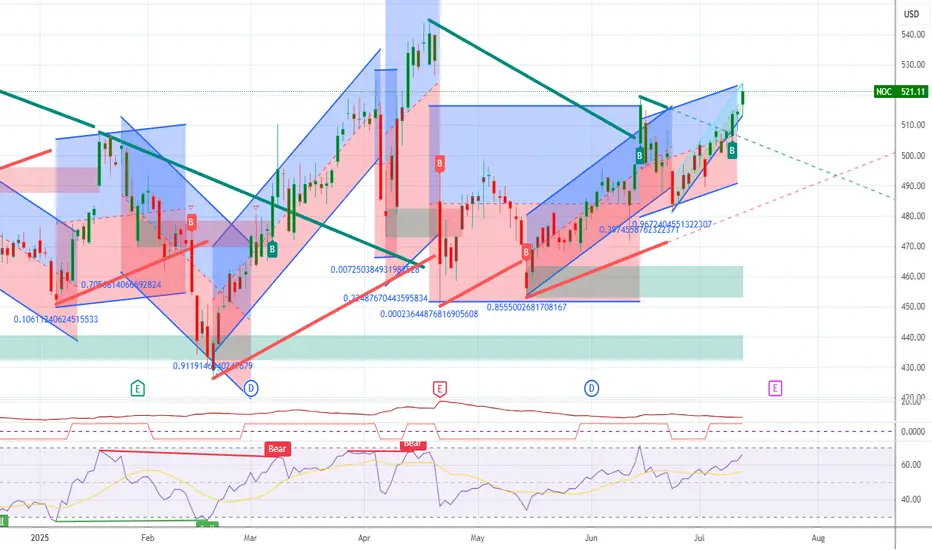
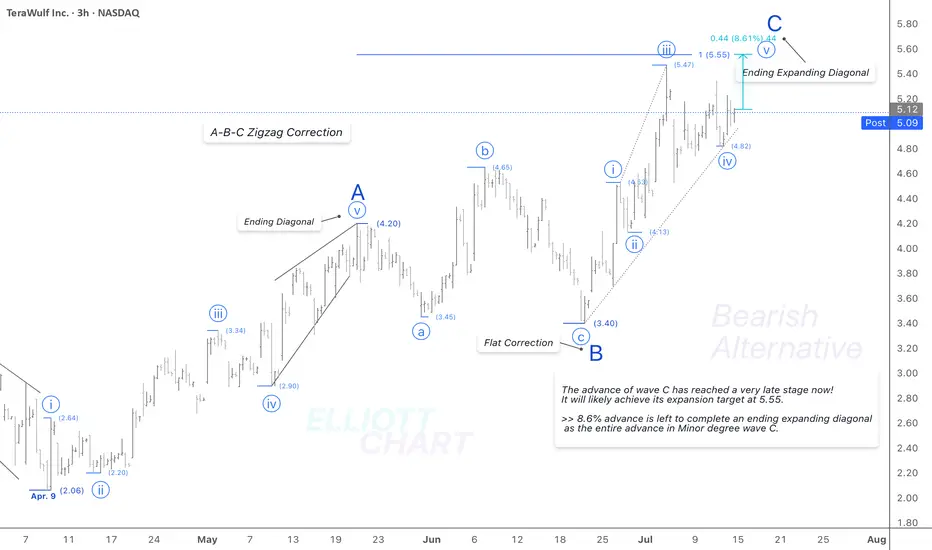
WULF / 3hNASDAQ:WULF
According to the bearish alternative in my weekly frame (not the chart below and not posted recently), the entire countertrend rally, which has developed in an ABC zigzag sequence as anticipated in the analysis which I posted on May 12, may have reached a very late stage where an adjusted expanding diagonal as the thorough Minor degree wave C remains at the start point of a final advance as its 5th subdivision. It will conclude the entire correction upward since April 9.
NASDAQ:WULF 's Bearish Alternative :
Wave Analysis >> As depicted on this 3h-frame above, the structure of the entire countertrend advance, which has developed since April 9, may be considered in a thorough ABC zigzag correction, in which Minor degree wave C should have diagonally reached its very late stage now. It would likely achieve its expansion target >> 5.55.
And it would be a 170% gain of a countertrend rally at the end!!
Now, 8.6% of the advance remains to complete a possible ending expanding diagonal upward as the Minor degree wave C.
Trend Analysis >> The countertrend upward as Intermediate degree wave (B) will probably change to decline in the same degree wave (C) very soon!! And it'll likely last until the end of the year.
#CryptoStocks #WULF #BTCMining #Bitcoin #BTC
NASDAQ:WULF CRYPTOCAP:BTC MARKETSCOM:BITCOIN
Stocks SPOT ACCOUNT: QUBT stocks buy trade with take profitStocks SPOT ACCOUNT: NASDAQ:QUBT stocks my buy trade with take profit.
This is my SPOT Accounts for Stocks Portfolio.
Trade shows my Buying and Take Profit Level.
Spot account doesn't need SL because its stocks buying account.

LDOS LONG🚀 NYSE:LDOS – Breakout Setup After Months of Accumulation
NYSE:LDOS is showing a high-conviction breakout setup after six months of tight accumulation. Here's what I'm seeing:
🔹 Flagging on the 8EMA with low volume – classic bullish continuation
🔹 Clean structure with higher lows and controlled pullbacks
🔹 Volume drying up during the recent consolidation = potential energy building
🔹 Breakout in progress with RSI staying strong but not overbought
🔹 Accumulation range forming a solid launchpad
📈 With earnings due Aug 5 (BMO) and strong fundamental backing, I expect volume to come in soon and fuel the next leg higher.
🟢 Targets:
$184 short-term
$211 by year-end
🔴 Stop:
$159 – below the accumulation base and prior support zone
Why I Like It:
✅ EPS growth +325% YoY
✅ Forward P/E only 14.1
✅ Strong ROE (31%) + institutional accumulation
✅ Momentum without overextension
✅ Positioned in a defensive-growth sector with macro tailwinds (defense, cybersecurity, AI)
📊 Looks like smart money has been accumulating – and it's almost time to move.

KULR Daily Watch – Triangle Squeeze Loading📍 Price Action:
Sitting tight at $6.50, coiling inside a clean symmetrical triangle. Last fake-out under support didn’t confirm → bulls still holding the line.
📊 Pattern Probabilities (Bulkowski):
Symmetrical triangles break ~54–60% in trend direction. Post-breakout moves hit ~60–75% of measured height → decent odds for upside here.
✅ Volume contracting = typical pre-breakout behavior
✅ RSI divergence still bullish
✅ Channel since 2023 intact, macro structure supports trend-following
🎯 Targets & RR Setup:
Trigger zone: $7.20–$7.50
Target 1: $9.45 (+31% | RR ~2.5:1)
Target 2: $28.81 (+298% | RR ~12:1)
Target 3 (channel top): $168.12 (+2,368% | moonshot 🌙)
⏳ Next Step:
Break over $7.50 = green light for Target 1. We’re trailing stops below the rising trendline to lock in gains without killing the move early.
#KULR #TrianglePattern #BreakoutWatch #TargetTraders #StockMarket

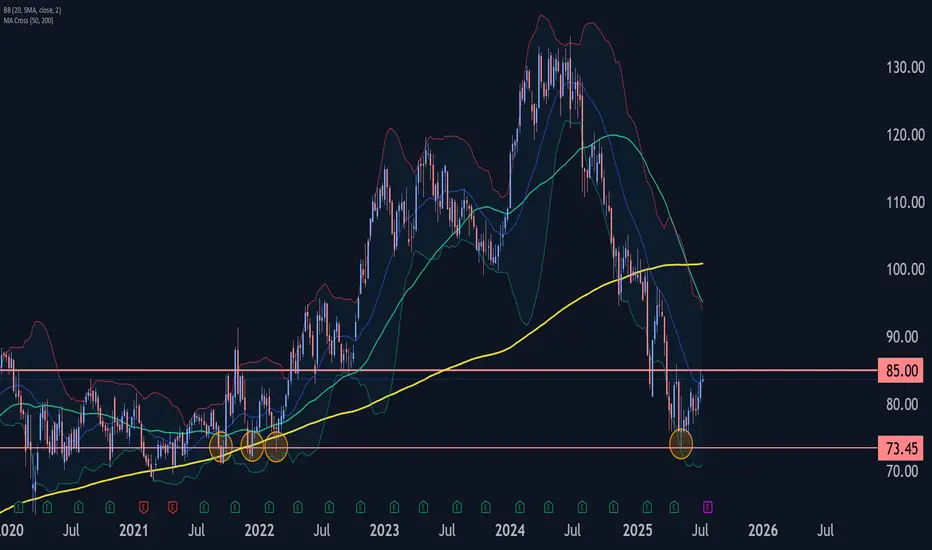
MRK Wave Analysis – 14 July 2025- MRK reversed from the support zone
- Likely to rise to resistance level 85.00
MRK recently reversed up from the support zone surrounding the long-term support level 73.45 (which has been reversing the price from the start of 2020, as can be seen from the weekly MRK chart below).
The upward reversal from the support level 73.45 started the active long-term impulse wave III.
MRK can be expected to rise to the next resistance level 85.00 (former top of wave (4) from May) – from where the price is likely to correct down.
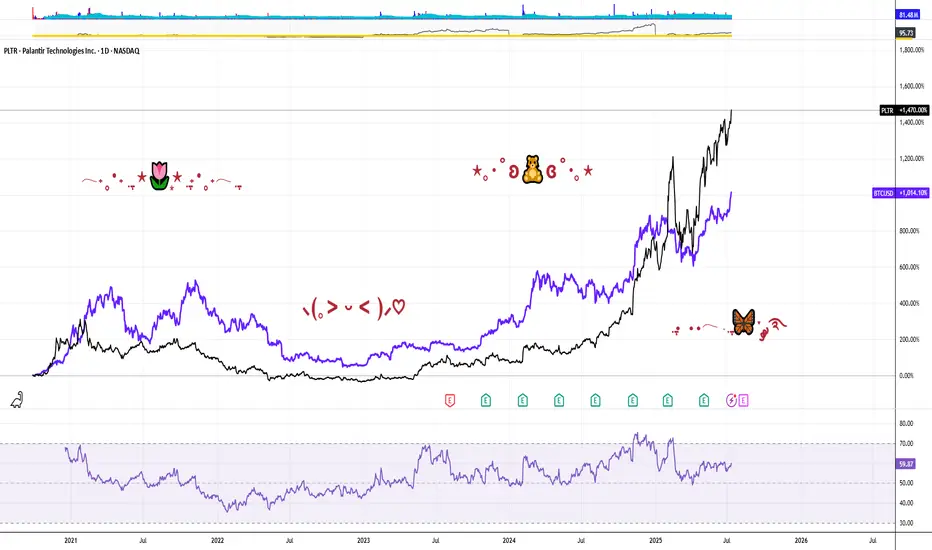
PALANTIR REMAINS YOUR TRADING GOAL, DOUBLING IN PRICE IN 2025In the Faraway Kingdom... In the Thirtieth Realm....
Somewhere in another Galaxy.. in late December, 2024 (yet before The Second Coming of Trump), @TradingView asked at it awesome Giveaway: Happy Holidays & Merry Christmas .
1️⃣ What was your best trade this year?
2️⃣ What is your trading goal for 2025?
Here's what we answered:
1️⃣ What was your best trade this year?
- Surely Palantir NASDAQ:PLTR 💖
I followed Palantir all the year since January, 2024, from $16 per share, watch here .
Current result is 5X, to $80 per share.
Also I added more Palantir after SP500 Index inclusion in September 2024 watch here .
Current result is 2.6X, from $30 to $80 per share.
2️⃣ What is your trading goal for 2025?
- Once again, surely Palantir NASDAQ:PLTR 💖
It's gone 7 months or so... (Wow... 7 months really? 😸😸😸)
Let see what's happened next at the main graph of Palantir stock, to LEARN WHY PALANTIR REMAINS THE TRADING GOAL, DOUBLING IN PRICE IN 2025...
Palantir stock remains an attractive trading goal for several compelling reasons rooted in its strong market performance, innovative technology, and robust growth prospects, particularly in the artificial intelligence (AI) sector.
1. Exceptional Stock Performance and Momentum.
Palantir Technologies has been one of the best-performing stocks in 2025, surging over 80% in the first half of the year alone, vastly outperforming the S&P 500’s modest 5.5% gain. The stock recently hit all-time highs around $149, reflecting a nearly 400% increase year-over-year, underscoring its strong momentum and investor enthusiasm. This surge positions Palantir as a top AI stock to watch, attracting both retail and institutional investors, including conservative entities like the Czech National Bank.
2. Leadership in AI and Data Analytics.
Palantir is not just a data analytics company; it has transformed into a major AI software provider with its Artificial Intelligence Platform (AIP). This platform extends beyond government contracts into commercial sectors such as healthcare, energy, and automotive, fueling significant revenue growth. The company reported a 39% revenue increase to $883.9 million in Q1 2025, driven largely by AI adoption. Its AI platform is gaining traction globally, with many companies rapidly adopting Palantir’s software through short training bootcamps, demonstrating scalable and fast integration.
3. Strong Government and Commercial Contracts.
Palantir’s roots in government intelligence and defense continue to be a significant revenue driver. The U.S. government division alone generated $373 million in Q1 2025, with overall government revenue up 45% year-over-year. Strategic partnerships, such as with Accenture to streamline federal operations and projects like the U.S. Navy’s ‘Warp Speed for Warships,’ highlight Palantir’s expanding footprint in critical government sectors. Simultaneously, the commercial segment is booming, with revenue soaring 71% to $255 million in Q1 and projected to reach $1.178 billion in 2025.
4. Financial Health and Growth Outlook.
Palantir’s financials are strengthening, with no debt and adjusted free cash flow more than doubling to $370.4 million in the recent quarter. Analysts forecast the company’s revenue to exceed $3.5 billion in 2025, up from $2.23 billion the previous year, and project potential revenue of $7 billion by 2028. Operating margins are improving, with a recent quarter reporting a 26% margin, the highest in company history. This solid financial foundation supports further investment in AI innovation and market expansion.
5. Market Position and Competitive Edge.
While Palantir competes with tech giants like Microsoft, Amazon, and Google in the AI and data analytics space, it has carved out a unique niche with its specialized government contracts and AI-driven software solutions. Its ability to integrate complex datasets for real-world operational use distinguishes it from competitors, fostering a loyal investor base and a "cult-like" following among retail investors.
6. High Valuation Reflects Growth Expectations.
Despite a high price-to-earnings ratio (PE around 621), reflecting elevated expectations, many analysts remain optimistic about Palantir’s long-term potential due to its rapid growth and expanding AI capabilities. The company’s market capitalization has soared above $330 billion, surpassing many established corporations, signaling strong market confidence.
7. Palantir stock is a compelling trading goal because it combines robust growth, cutting-edge AI technology, strong government and commercial contracts, and solid financial health.
8. In conclusion, Palantir remarkable stock performance and strategic positioning in the booming AI sector make it a promising investment for traders seeking exposure to transformative technology with significant upside potential.
9. ...and yet, Palantir performance since inception (It ultimately went public on the New York Stock Exchange through a direct public offering on September 30, 2020) is better, rather then Bitcoin.
--
Best wishes,
@PandorraResearch Team 😎