POWER METALHello guys, good ?
POW idea.
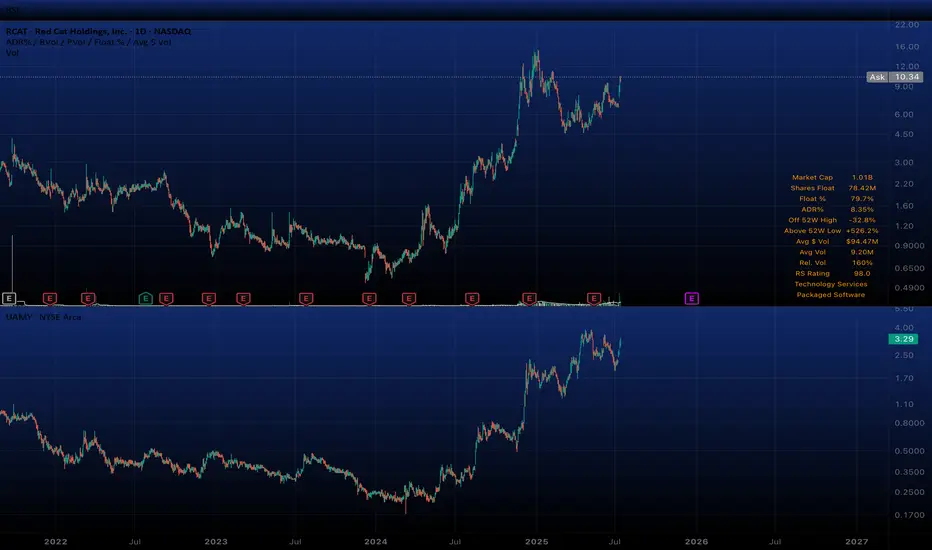
Large bullflag breakout. For safe enter, you need to wait monthly candle close.
This stabilisation is very very a good sign.
Levels are clean now.
RSI breakout too.
Good luck :)

$RCAT $UAMY LONGNASDAQ:RCAT AMEX:UAMY
“If you’re good at something, never do it for free.”
AND one of the hardest you should learn things to judge is what level of risk is safe.
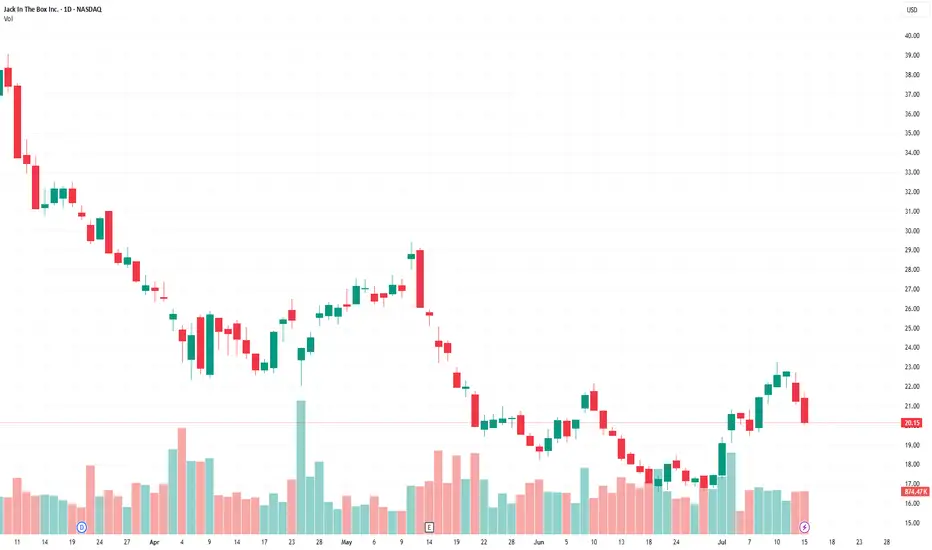
Jack in the Box (JACK)Consumer Discretionary - Restaurants
Buy the dip: strategic plan, a number of shorts and the institutional interest.
Supporting Arguments
Strategic transformation program.
Large number of shorts and high dividend yield.
Interest of a large investor.
Jack in the Box, Inc. (NASDAQ: (JACK) operates of two chains of quick-service and fast-casual restaurants, with a total number of 2,600. The Jack in the Box segment offers a classic burgers. The Del Taco segment focuses on both Mexican and American. The company was founded in 1951 and is headquartered in San Diego, CA.
Investment Thesis
Strategic transformation plan. The company grew its revenue at a double-digit rate in 2021–2023, but since last year, revenue has been declining. The debt burden has begun to grow and has reached a critical level of more than $1.7 billion, or 5.1x LTM EBITDA. Amid the problems, the CEO resigned.
The company announced a restructuring plan, which includes closing 150–200 unprofitable restaurants, and selling the Del Taco chain entirely to reduce debt by $300 million is not ruled out. It is also planned to increase online sales from the current 12.5% to 25%. The EBITDA margin of the online segment is planned to increase to 15%.
A large number of short positions and a dividend. Short interest is 4.48 million shares, or about 25% of shares in free float and 5 average daily trading volumes. Closing the short may lead to a strong short-term increase in quotes. The dividend yield is about 6%, however, due to the need to save, it cannot be ruled out that the company will cut the dividend in the near future.
The interest of a large investor. The company's capitalization is $420 million, it has not been so cheap since the COVID-19 pandemic, and before that in the early 2010s. Quotes have fallen almost 5 times from the maximum, which creates a good opportunity for a takeover by a large player. The Biglari Capital Corp. fund, which controls almost 10%, has already taken advantage of the stock correction and intends to increase its share. However, the Board of Directors is currently taking measures to counter a hostile takeover, hoping to cope with the crisis on its own.
We recommend to BUY a JACK shares with the target price of $935, which implies a 60 upside. To mitigate potential losses, it is advised to implement a stop-loss at $16.90.
The Case for Solar Tracker Infrastructure (NXT) NASDAQ:NXT
THE CONCEPT
Superficially, the solar infrastructure sector appears to be just another subset of the cyclical renewable energy market, heavily influenced by commodity pricing, subsidies, and Chinese overcapacity. This view, while partially accurate, overlooks a deeper dynamic now unfolding in the utility-scale solar ecosystem: the emergence of solar trackers, specifically Nextracker (NXT), as a default layer of infrastructure that enhances energy yield, drives project economics, and becomes essential to capturing IRR in large-scale solar development.
The true attraction of companies like NXT lies not in their participation in the solar value chain but in their ability to compound earnings by becoming the default standard in project infrastructure. As utility developers increasingly seek higher ROI and shorter time-to-completion, tracker systems with proven yield enhancements and robust reliability are becoming indispensable. What began as a technological upgrade is now evolving into an infrastructure platform with software-defined margins, long product lifecycles, and embedded switching costs.
If this dynamic is recognized by investors, NXT may undergo a valuation re-rating, as happened with other asset-light infrastructure providers in the past. The process is potentially self-reinforcing: tracker adoption increases → project IRRs improve → developers standardize on proven providers → NXT backlog and margins grow → investor recognition expands → valuation multiple rises → NXT scales further, increasing its data advantage and competitive moat.
ANALYTICAL APPROACH
The conventional method of evaluating solar-linked equities—projecting demand growth for solar installations and then applying a valuation multiple based on cyclical earnings—is insufficient in this case. NXT’s trajectory is not merely a function of solar penetration; it depends critically on its ability to convert adoption into infrastructure entrenchment. The valuation multiple itself reflects investor understanding of this transition.
Instead of isolating earnings and then applying an arbitrary multiple, we analyze the self-reinforcing process of tracker adoption, profitability, and recognition. We identify three interlocking drivers:
The effective return on solar projects equipped with tracker systems
The penetration rate of trackers in utility-scale solar globally
Investor recognition of NXT as a long-term infrastructure platform rather than a cyclical solar component supplier
THE SCENARIO
Act One: The Emergence of the Infra Layer (2023–2025)
At present, the effective return on utility-scale solar projects is entering a new phase. While panel prices continue to decline due to Chinese oversupply (falling below $0.16/W in the U.S.), project economics are improving due to two compounding forces: rising electricity demand (particularly from AI, EVs, and data centers) and software-enhanced yield optimization from tracker platforms.
NXT's tracker systems, enhanced by machine-learning algorithms like TrueCapture, are capable of increasing energy yield by 15–25%, a material change in IRR for developers. Meanwhile, the total cost of tracker systems has declined enough to reach mass adoption thresholds, especially in markets like the U.S., where NXT holds a 57% share. Tracker usage in new U.S. projects now exceeds 95%, while global adoption is climbing from 40–45%.
Investor recognition is still partial; NXT trades at ~15x earnings despite 30% EPS growth and a $4.5B backlog. The process has just begun, but the initial indicators of self-reinforcing dynamics are visible.
Act Two: Recognition and Rerating (2025–2027)
As demand for electricity continues to grow and renewable installations scale with it, tracker systems become default components in new builds. Developers now see tracker-equipped plants as the norm, not an upgrade. Projects from 2025 onward increasingly retroactively upgrade from fixed-mount systems.
Investors begin to grasp the role of NXT as a high-margin infrastructure provider. The shift in narrative—from cyclical solar to embedded utility infrastructure—leads to a re-rating. Price-to-earnings multiples begin to reflect platform-like characteristics: recurring software revenue, long product cycles, data network effects, and entrenched customer relationships. The company’s moat, built on both hardware reliability (30-year durability) and proprietary software trained on years of operational solar data, becomes widely recognized.
Investor multiples compress slightly to reflect maturity but remain above historical solar averages due to sticky revenue, data leverage, and infrastructure resilience.
EVALUATION
The shakeout is still years away. Until then, NXT is positioned to benefit from a global shift in energy infrastructure. The real risk at present is not from saturation but from investor miscategorization. If NXT continues to be treated as a cyclical solar stock, it may remain undervalued despite strong fundamentals and compelling growth.
The key vulnerability lies in the macro environment. Should global renewable demand stall due to policy reversals (e.g., rollback of IRA credits), or should Chinese entrants successfully replicate NXT’s software and reliability at scale, the thesis may weaken. However, even in such cases, the cost structure of tracker-enhanced solar remains globally competitive, and NXT’s backlog and historical performance offer downside protection.
Yet, it must be acknowledged that current market sentiment favors nuclear-related equities, driven by political narratives of energy security and bipartisan support for nuclear expansion. Nuclear stocks are being re-rated on the expectation of long-term baseload reliability, even though their LCOE remains higher and their construction timelines are far longer than utility-scale solar. This sentiment bias may delay investor recognition of NXT’s strategic role as an infrastructure platform.
If the self-reinforcing process plays out as expected, NXT could deliver the compound benefits of scale, margin expansion, and multiple re-rating. The capital appreciation potential mirrors the early phases of other infrastructure transitions—cable, fiber, datacenter REITs—where early recognition translated into multiyear equity outperformance.
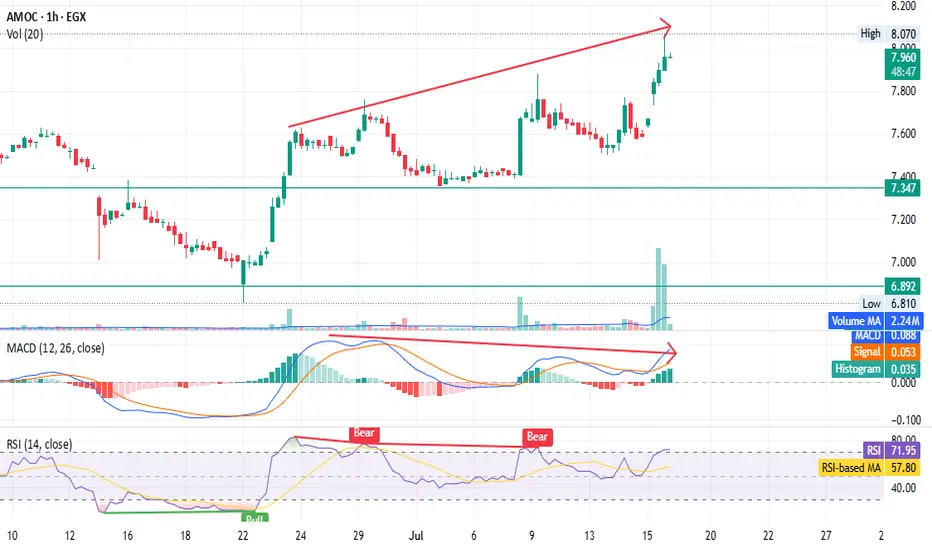
AMOC - Beware of the bear trap - only for shareholders EGX:AMOC timeframe: 1 hour
Prices continue to rise, forming a higher top than the previous one,
but MACD shows a negative divergence.
RSI indicates bearish dominance despite the price increase.
High volume with a gap, unsupported by other indicators, suggests possible distribution.
Stop loss (profit-saving) at 7.62.
This is not financial advice, just our analysis based on chart data. Consult your account manager before investing.
Thanks and good luck!
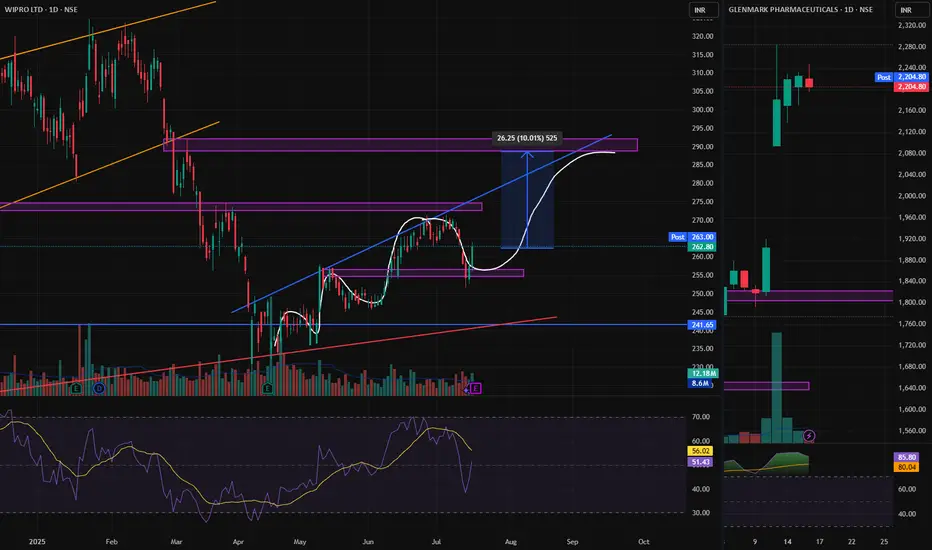
WIPRO, CREATING NEW HIGHER HIGHWIPRO, Creating new higher high pattern, this can reward us with 10% return in few weeks. mark the levels and plan your trade.

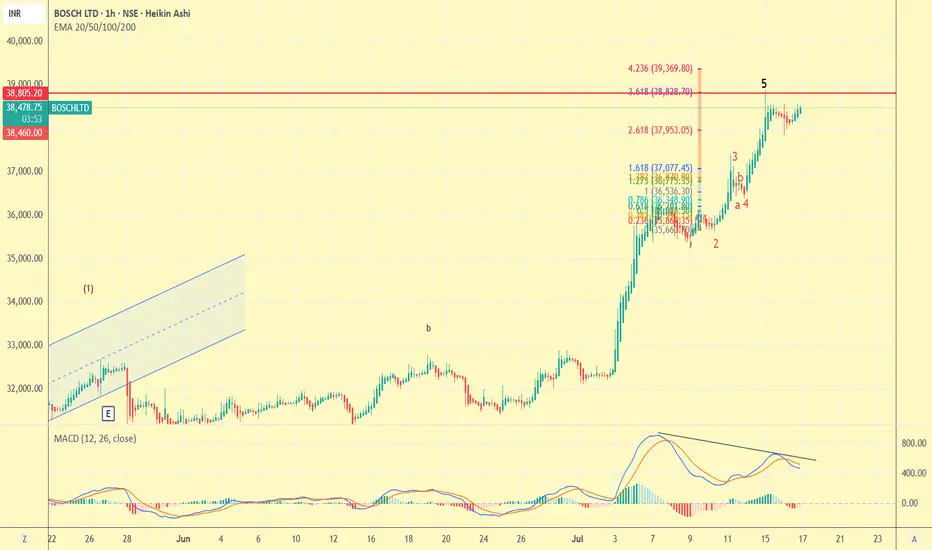
bosch-sell on riseas visible completion of 5th wave and negative div . It would be good if one books profit and enter at lower level or may use trailing stoploss .
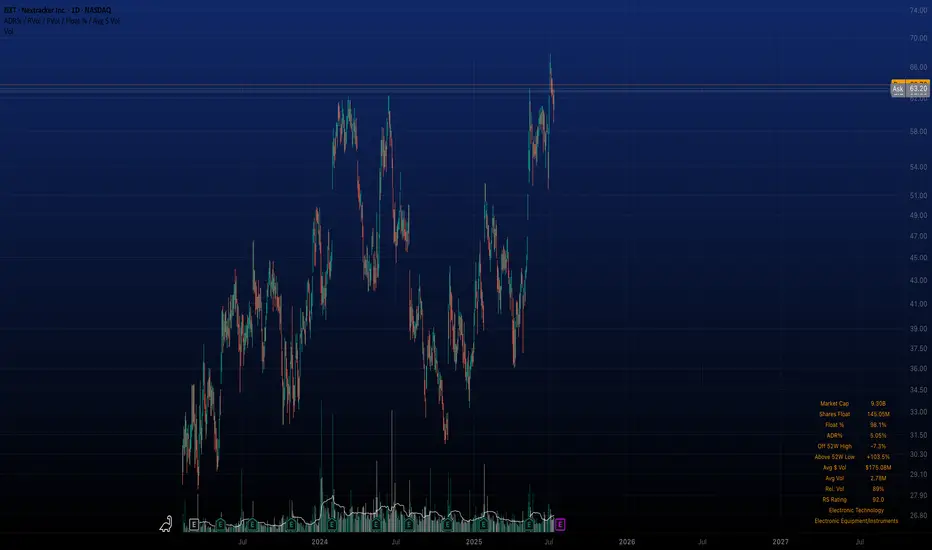
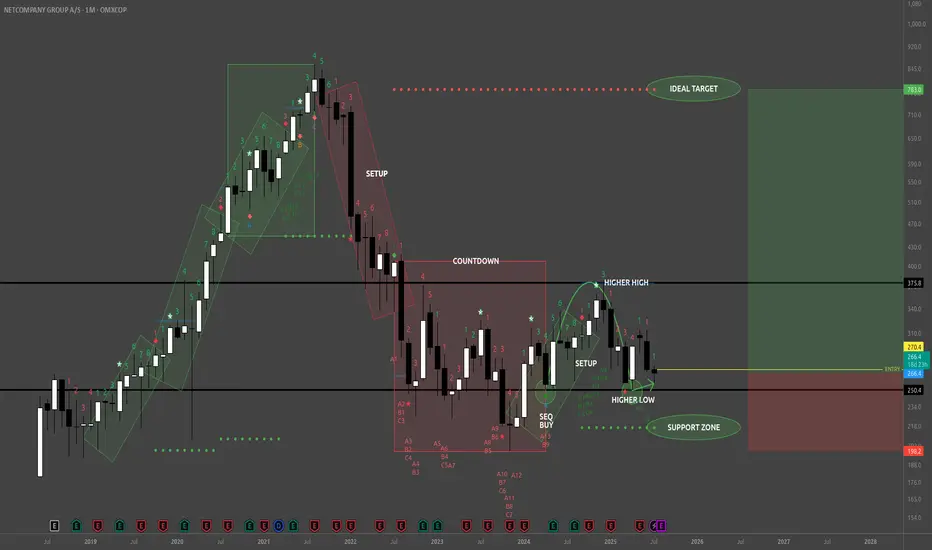
NETC - BuyReading the NETC Monthly chart from the left to right look at that remarkably strong bullish trend (green rotated rectangles) which spanned 3 consecutive TD 1-9 Setups. That's 9 strong months of uptrend culminating in the beginning of the bearish trend with a TD Sequential 13 Sell signal at the apex, a Bearish Engulfing Pattern, and a large Doji immediately preceding the TD 1-9 Setup (red rotated rectangle) which exhausted the downward momentum, and dissipated the downward momentum with the TD Sequential 13 Buy signal (first green circle).
From the TD 13 Buy signal (first green circle) buyers created a higher high, followed by 4 consecutive red TD counts, whose bearish implications were disrupted by the strong Bull Sash pattern. I really like this spot for opening a long position. One caveat is that the Weekly TD Buy Setup is on 7/9 so the next two weeks could bring the price lower, potentially even tapping the TDST support zone, but whether that happens or not look left on the chart everywhere from my entry price and below. This is all wholesale pricing territory!
TDST up at 783 is a nice upside target just shy of the ATH traders will be gunning for.
Now on fundamentals here's where things are really nice. NETC just bought themselves the Danish IT banking company SDC (for 1 Billion DKK) which serves about 100 Nordic banks. That's going to be bringing in sticky, recurring revenues in a critical financial sector. NETC revenues are also not materially tied to the U.S., and doesn't rely on American consumer sentiment, regulatory policy, or supply chains.
Whether price falls from here or not I'm holding on to my shares until this pays off big. Maybe this is a trade for your trading temperament too.
STATE BANK OF INDIA IN A BULLISH MOMENTUMThe technical setup suggests bullish momentum with Elliott Wave supporting continuation higher. Key upside levels are ₹850 and ₹880, as long as the price holds above trend support near ₹820-₹830. A failure below this zone would weaken the bullish outlook.

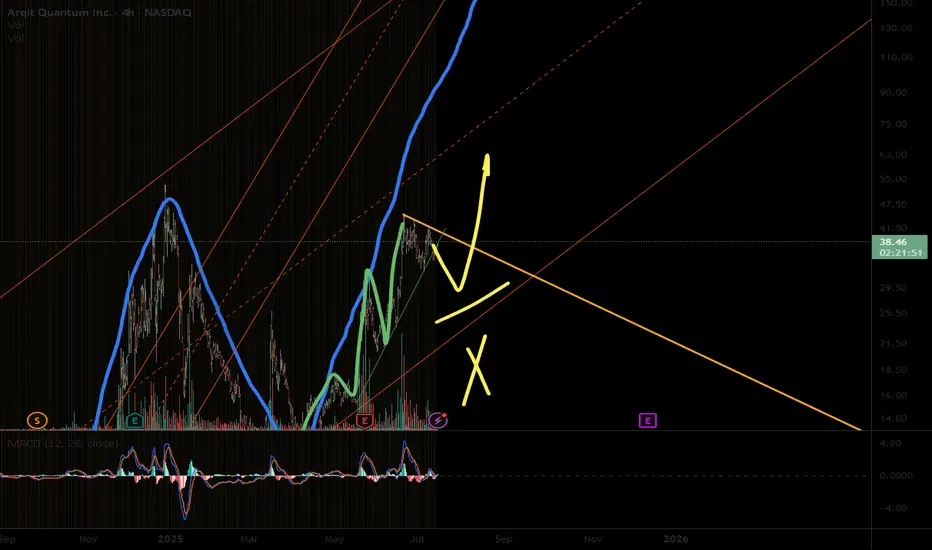
ARQQ setup of mine3 impulses form first bigger,
now the pull back is considered.
Global weakness meets the pullback,
none of first waves cut the prev high,
only second let to pass by,
bottom channel might get nagged
If we make it we will strive,
but only to the (chan) half,
then I see a good bye, not buy.
SHRIRAM FINANCE LIMITED in a channelThe stock experienced a strong bullish move (5-wave uptrend), currently consolidating inside an upward channel.
Price is facing resistance near ₹700–₹735.
The momentum indicator (RSI) suggests no extreme buying or selling; trend is neutral to cautiously bullish unless a clear breakout or breakdown occurs.
Support: Lower channel boundary (~₹660).
Resistance: ₹700–₹735.
Strong move above resistance could signal further upside; a break below the channel may indicate a corrective decline.

Swing trade monthly ...swan energy swan energy seem to be taking support at a major support level ....
this stock seem to be a swing long

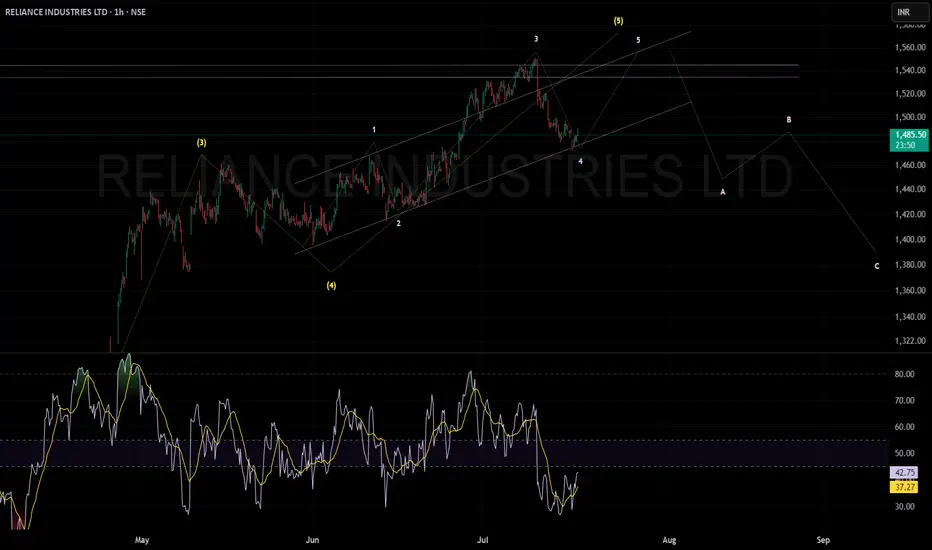
RELIANCE INDUSTRIES CAN MOVE UP IN 5TH WAVEReliance Industries appears poised to complete its final bullish wave with an upward move toward 1550, following which a corrective retracement is likely.
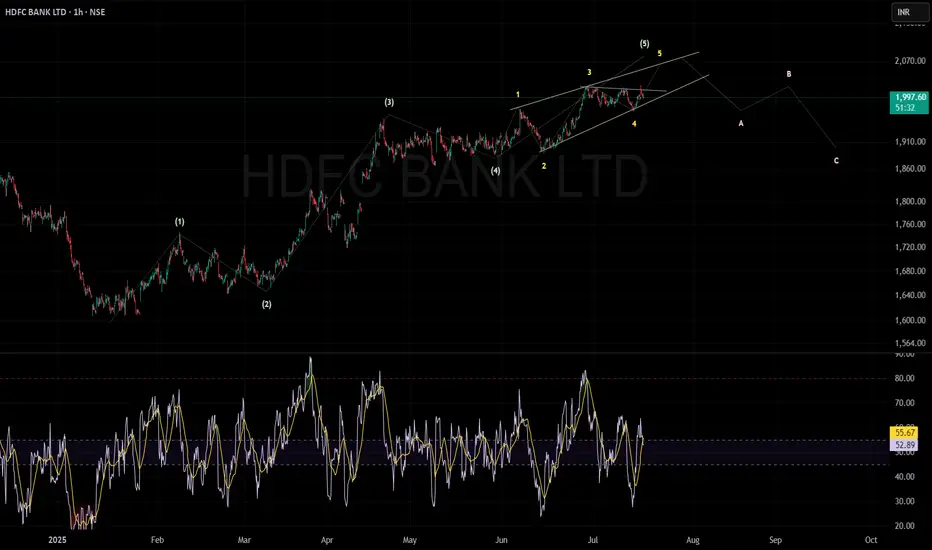
HDFC BANK can move 5th wave upHDFC Bank is currently in the last (5th) wave of an uptrend. This wave is moving inside a narrow, rising wedge pattern called an ending diagonal.
The price can move higher towards ₹2,050–₹2,100 before the trend finishes.
If the price breaks below the bottom of the wedge pattern (ending diagonal), it could confirm a trend reversal, likely leading to a correction.
After the peak, the chart suggests a three-step drop (A, B, and C waves), with possible support around ₹1,910 and then ₹1,850.
The RSI (Relative Strength Index) is around 53, meaning the trend isn't overbought or oversold yet.
In short: The uptrend is close to ending. Watch for a break below the wedge—this could start a move down toward ₹1,910 first, then maybe ₹1,850.
Breakthrough significant downtrend resistance line - EMA200 AMOC has successfully penetrated significant downtrend resistance line and EMA200 supported by volume exceeding average 30 days vol, targeting the bellow level:
- Potential buy range: 7.8 - 7.9
- TP1: 8.7
- TP2: 9.8
- SL: below 7.5

Buy Idea: FAUJI FERTILIZER CO LTD (PSX)🔷 Buy Idea: FAUJI FERTILIZER CO LTD (PSX)
Context:
Price tapped into a discount zone, swept liquidity below the recent lows, and formed a strong bullish engulfing candle. The setup aligns with a low resistance liquidity run toward the higher timeframe distribution zone.
✅ Entry Criteria:
Entry: Above the bullish candle close at ~366
Stop Loss: Below the recent swing low at ~323
Target: Monthly resistance / low resistance area at ~435
RR Ratio: ~1:2.5+
📊 Justification:
Liquidity Sweep: Price swept the previous low (creating inducement)
FVG Reaction: Immediate bullish reaction from the demand/FVG zone
Distribution Zone Targeted: Market is likely to grab liquidity from unfilled sell orders in the upper zone
No major resistance till 435 (clean traffic)
⚠️ Risk Notes:
Confirm daily candle closes above 366 before entry
Monitor any reaction at ~390-400 distribution zone

FAB: Buy ideaOn FAB as you can see on the chart we have the breakout with force the vwap and the resistance line. It's mean that we would a hight probability to have a good uptrend.

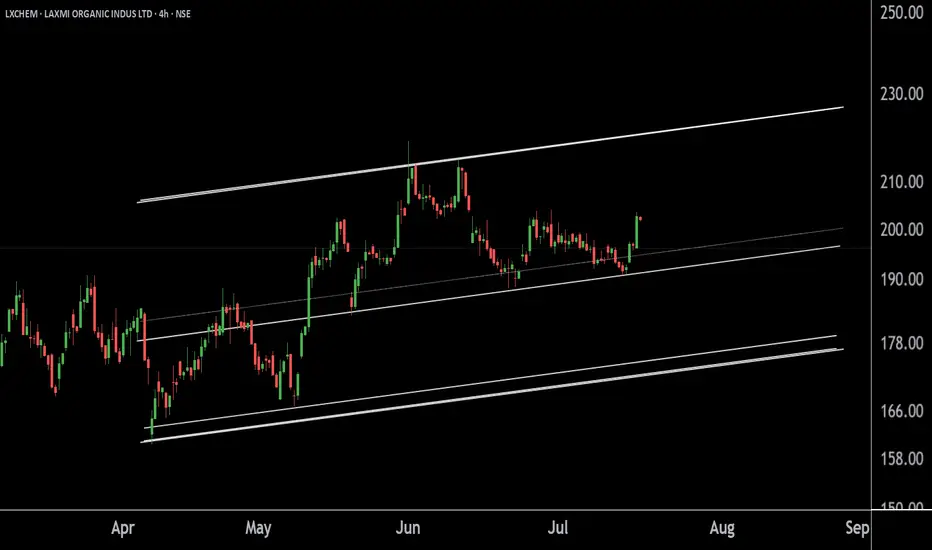
LAXMI ORGANIC INDUS LTD at Best Support !! LXCHEM 's Key level !This is the 4 hour chart of LXCHEM.
LXCHEM is moving in well defined parallel channel with support neat at 190-196 range.
If this level is sustain , then we may see higher prices in LXCHEM.
Thank You !!
PGEL High Volumes, Breakout, LongPGEL is showing good buying volumes in last 3 sessions. If it crosses and sustains 835 with Bullish candlestick pattern then buy at 835.
Entry: 835
Target1: 880

EMIRATES NBD BANK: Good uptrendOn EMIRATES NBD BANK we can see a nice impulse candle which has broken the resistance line with force. This means that buyers have further confirmed their supremacy over sellers. With this breakout we would have a nice continuation of the upward trend.

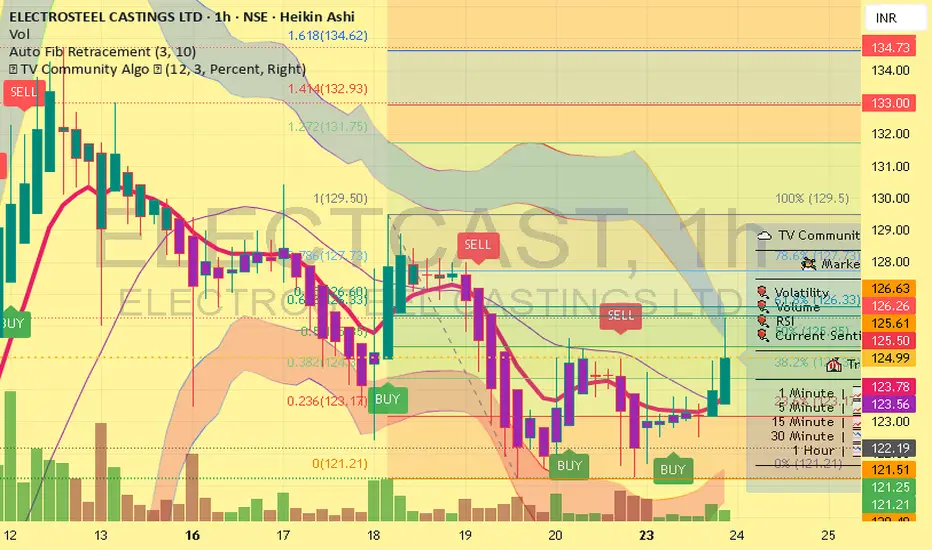
buy ELECTCAST BUY ELECTROSTEEL for the tgt of 1, RS 135 2, 175 AND 3, 235 with SL 120 time frame NEXT 1 YEAR
Breakthrough inverted head and shoulders and downtrend lineABUK has successfully breakthrough inverted head and shoulders pattern and downtrend resistance line supported with volume exceeding average 30 days allowing the stock to achieve the below targets:
- Potential buy range: 51 - 51.5
- TP1: 56
- TP2: 61.5
- SL: below 50.70 "Require confirmation"
