webull buy x robinhood buy webull: 24 million registered users and 4.7 million funded accounts managing $12.6 billion in assets as of Q1 2025
x
Robinhood: recently launched tokenized U.S. stocks and ETFs in Europe, enabling round‑the‑clock 24/5 crypto‑style trading and exposure to private companies like SpaceX and OpenAI : Mizuho raised its price target to $99, Cantor Fitzgerald to $100, and KeyBanc to $110 Q4 2024 EPS estimates up 322% year-over-year, and full-year 2024/25 earnings forecasted to grow by 231%/22%
bigger picture
Retail now constitutes roughly 20–21% of daily trading volume
Brokerages like Webull and Robinhood, offering strong margins, advanced tools, and retail accessibility, are driving the new wave of democratized finance empowering traders amid record market participation and innovation. lots of volume here
should expect these two to have a good quarter and next
price target by end of july
NASDAQ:BULL 16.00 range
NASDAQ:HOOD 101.00+

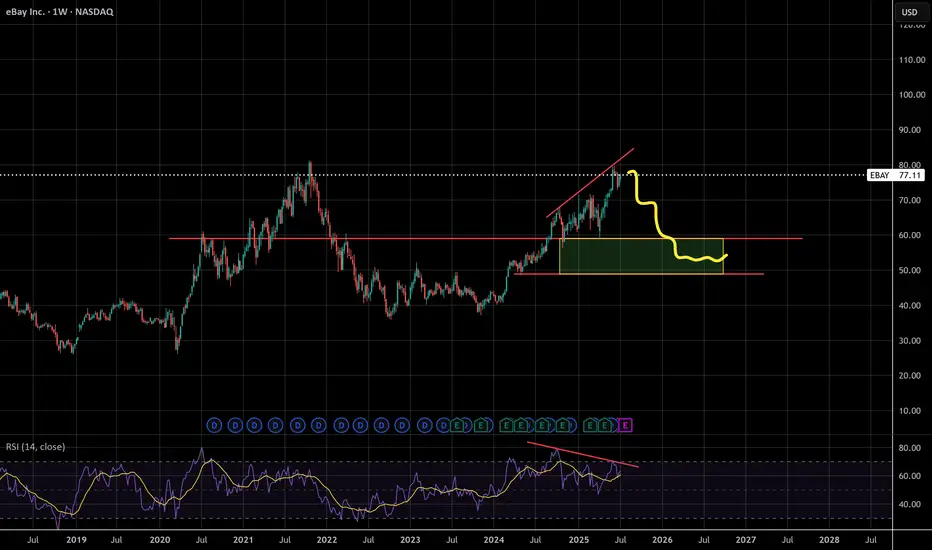
Ebay RSI flashing warnings - Handle forming?Looks like it may be forming a cup and handle, bearish divergence on the RSI
LCI Next TargetFrom latest bottom till the breakout level which conservatively I'll take at 1159, the most possible target is ~1800.

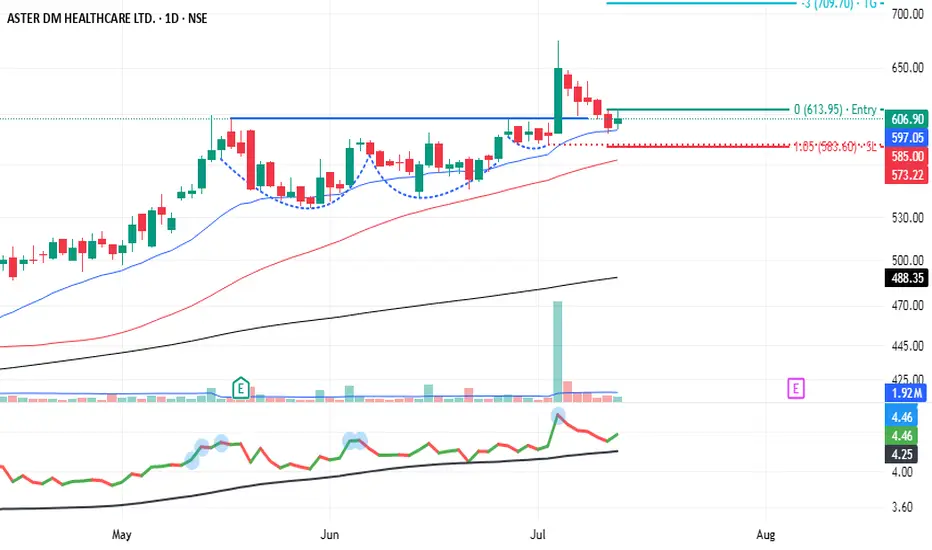
ASTERDM - classic VCP retest - My Pick - No AdviceASTERDM exhibited 3 shrinking pullbacks on its daily with increasingly narrow ranges and diminishing volume followed by a strong upside break. Post-breakout, the ideal setup is a retest: price pulls back to the breakout level (pivot), holding above it.
Fundamentally, Aster DM is a solid healthcare growth story: strong expansion, low debt, cash-rich, with robust ROCE/ROE. But valuation is rich, and earnings are skewed by non-core income.
Technically, VCP setup looks promising—good base, breakout, and retest in place.
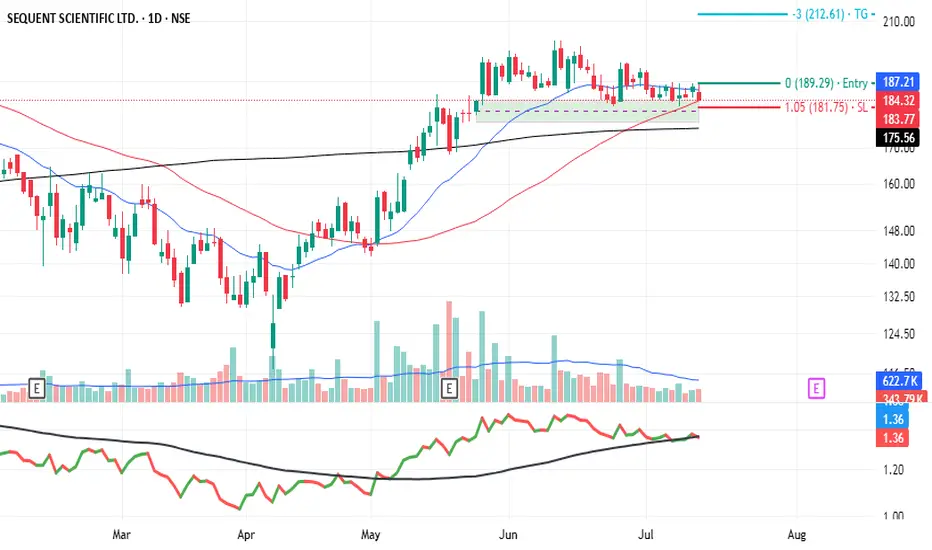
Sequent - My pick - No AdviceStrong Rally followed by period of consolidation with squeeze in volumes showing lack of selling pressure. Stock is resting at support level. if price drops below 180, could trigger stronger selling. A long-term investor may wait for a better entry near intrinsic value 155–160. Conversely and upside break could tigger a fresh rally. Business fundamentals show growth in revenue & profit, but high valuation leaves little room for error.
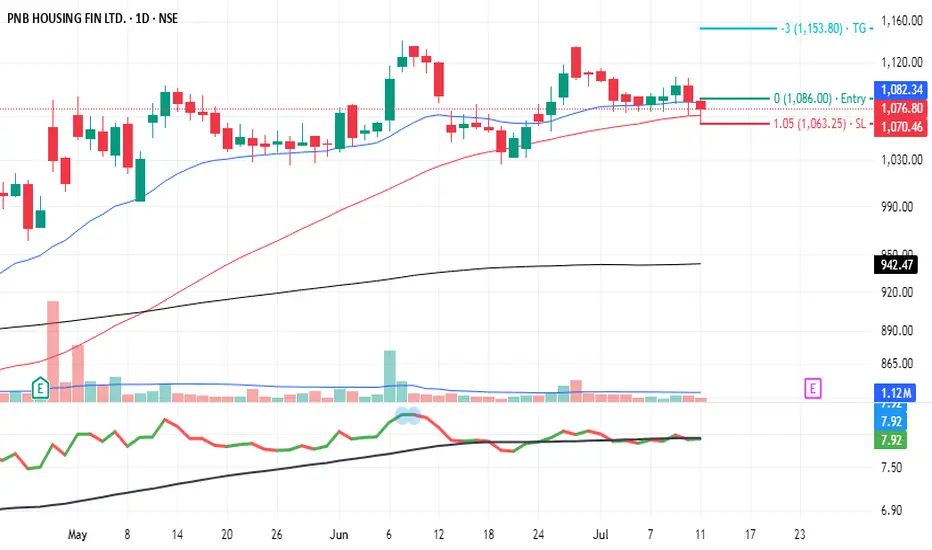
PNB Housing Finance - My Pick - No advice.Robust fundamentals indicate solid upside potential. If you believe in growth in the housing finance space, this could represent a strategic buy with a medium‑term horizon. Stock undercut 50 Day moving average and closed above it. it also undercut last several days low and close above it, showing lack of selling interest. A good close with good volume above PDH will tiggger my entry. These are my views and no advice to buy.
Importance of ATR(Average True Range)So idea here is to calculate risk.
understanding fear in the market ATR is an indication of volatility , not direction.
A smaller ATR range means low volatility.. tentatively market is consolidating.
A larger ATR range means the market is dealing with uncertainty so volatility has increased.
you can see the value of ATR on your chart.
the value of past ATR14period value is be greater than current ATR14 Period to take risk on a trades. it will help you reduce risk.

Potential outside week and bearish potential for TLXEntry conditions:
(i) lower share price for ASX:TLX below the level of the potential outside week noted on 2nd June (i.e.: below the level of $24.91).
Stop loss for the trade would be:
(i) above the high of the outside week on 5th June (i.e.: above $27.40), should the trade activate.
Important note for the trade:
- Observe market reaction at two key areas illustrated in the chart above, should the trade activate ($24.79 and $24.47), which could act as support against the short trade.

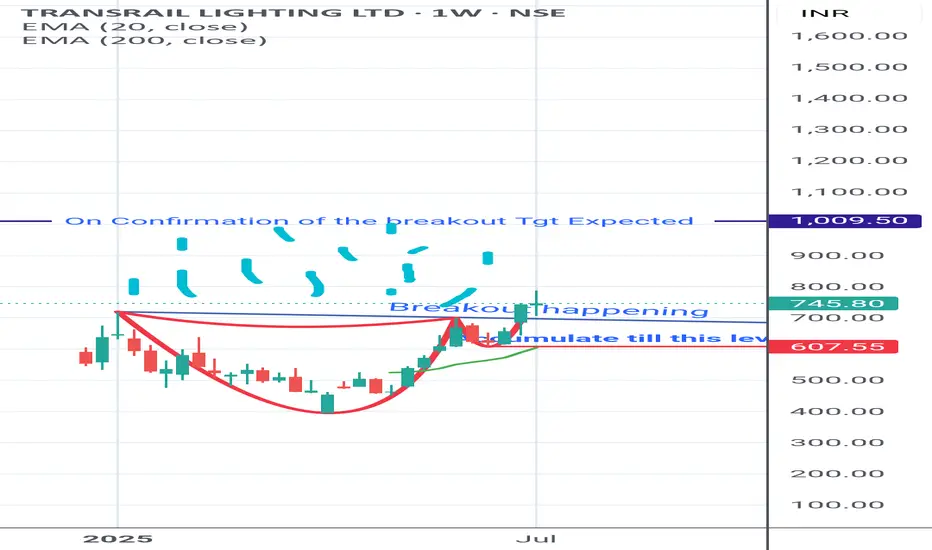
Transrail Lighting with beautiful Cup and handle pattern Have a SIP in this Cup of coffee. Looks good for Short /Longterm.
Enjoy it
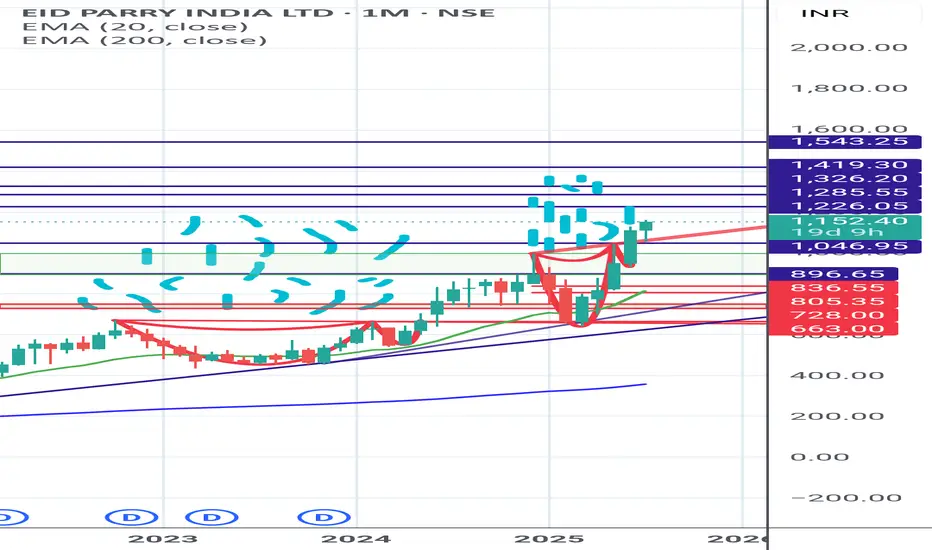
EID PARRY - TASTE THE 2ND CUP OF COFFEE Second Cup and handle pattern is ready. Taste the sweetness of it.
$UBER: Why $UBER Is a Robotaxi WinnerUber is on the verge of a major transformation, with robotaxis set to become a game-changing profit engine.
Technical charts indicate we can enter a long position today with low risk, while aiming for a long term rally resumption from here. Monthly and quarterly timeframe Time@Mode trends are bullish, suggesting price can reach heights between $111, $176 and $265 per share long term.
Here’s why the future looks bright for Uber investors from a fundamental perspective:
The global robotaxi market is projected to surge from $0.4B in 2023 to $45.7B by 2030, with Uber aggressively expanding its autonomous fleet in the U.S. and Europe through partnerships.
Uber’s approach is to integrate autonomous vehicles from partners (Waymo, May Mobility, Momenta, Avride, Volkswagen) into its platform, avoiding the massive costs and risks of building its own AVs.
Autonomous vehicles will slash Uber’s largest expense -driver payments- unlocking higher margins and scalability. CEO Dara Khosrowshahi calls AVs Uber’s “greatest future opportunity” for profit expansion.
Robotaxi pilots are already live in cities like Austin, with plans to expand to Atlanta, Dallas, and Europe by 2026. The average Waymo vehicle on Uber is busier than 99% of human drivers, showing strong demand and efficiency.
Uber’s core business is robust: Q1 2025 gross bookings up 14% to $42.8B, net income of $1.8B, and adjusted EBITDA up 35% to $1.9B. This profitability funds AV investments without sacrificing financial health.
Uber is uniquely positioned to lead the robotaxi revolution, leveraging its platform, partnerships, and financial strength. As AVs scale, expect a step-change in profitability and long-term shareholder value.
Best of luck!
Cheers,
Ivan Labrie.

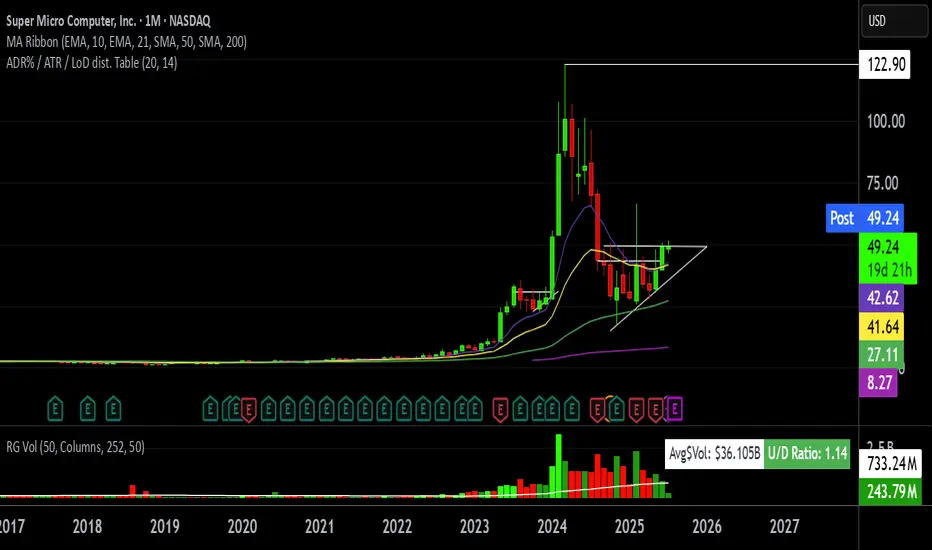
History tends to repeat itselfHistory typically tends to repeat itself. What has happened before can happen again. Take a look at the left side of the chart and you’ll see a picture-perfect breakout pattern: price consolidates, forms higher lows and relatively equal highs, all on high volume, before breaking out. Now, we are witnessing the same setup again on a larger scale. Above is a monthly chart of SMCI, allowing you to compare the similarities between the two breakout formations. What has gone parabolic before can go parabolic again. Earnings will be reported on August 12, which is roughly one month away. If SMCI continues to push higher here, we may see a move toward the all-time high of $122.90. Always do your own due diligence and keep risk management in mind.
Not financial advice.
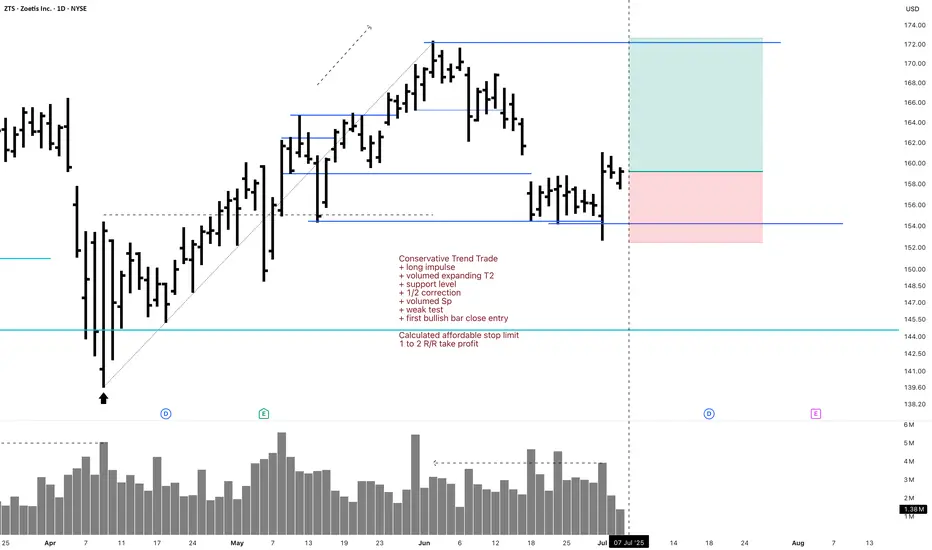
ZTS Investment 1D Long Conservative Trend TradeConservative Trend Trade
+ long impulse
+ volumed expanding T2
+ support level
+ 1/2 correction
+ volumed Sp
+ weak test
+ first bullish bar close entry
Calculated affordable stop limit
1 to 2 R/R take profit
Monthly trend
"+ long impulse
+ ICE level
+ support level
+ 1/2 correction
+ volumed 2Sp
+ weak test?"
Yearly trend
"+ long impulse
- correction"
Taking another trip to Palo Alto for a quick flip If you want all the details on why I'm taking this trade, refer back to my Palo Alto ideas from Jan 8th and May 21st of this year. The only thing that has changed since May is 4 more profitable trades on PANW, so it's now 25-0. The longest of those 4 has taken 4 days and the average return on them has been 2.16%. So I'm going to Palo Alto again.
The entire cybersecurity sector took it on the chin yesterday, with NET, CRWD, ZS and others all down big and it continued today for them. I know PANW the best, so that's why I'm choosing it, but I think any of them could do well here. PANW is right on its 200d MA and has been above it for the better part of the last 3 years. Even if this trade takes longer than expected to produce, PANW and cybersecurity are not going anywhere. If I had to hold this one for years, I'd be happy to. Well, not "HAPPY" happy, but you get the point.
My exit is signal-based rather than price level based, but I'm targeting under a week for a return of 1-3% on average. Let's hope PANW keeps its record intact and makes this my best trade of the day.
As always - this is intended as "edutainment" and my perspective on what I am or would be doing, not a recommendation for you to buy or sell. Act accordingly and invest at your own risk. DYOR and only make investments that make good financial sense for you in your current situation.

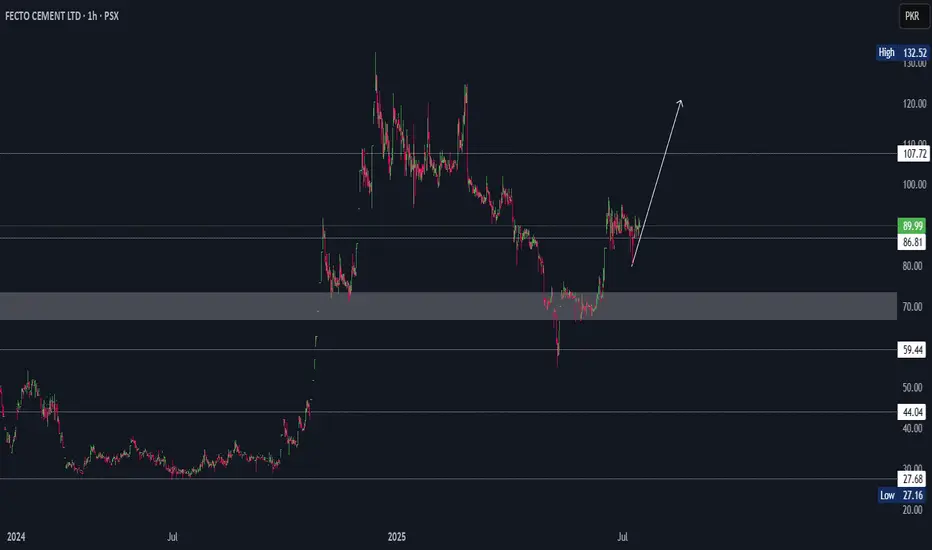
FECTO Cement Bullish FlagFecto has made a good low on 9th May and now hopefully heading towards 107 and 120 with a bullish flag formation.
This could be a good 20%-30% move up.
(W) Bearish Setup in PlayNYSE:CPAY – BEARISH 2618
Weekly chart confirms a Technical Double Top pattern around $370–$380, followed by a textbook Bearish 2618 retracement.
🔍 Key Confluences:
Double Top confirmed, neckline broken.
Price retested 0.618 Fib retracement at $350.51 (aligning with weekly resistance).
Bearish 2618 pattern projects downside potential toward $227.13.
First support to watch: $313.97, followed by $269.02.
🧭 Bearish outlook favored unless weekly close reclaims $355+. As long as price stays below that level, sellers remain in control.

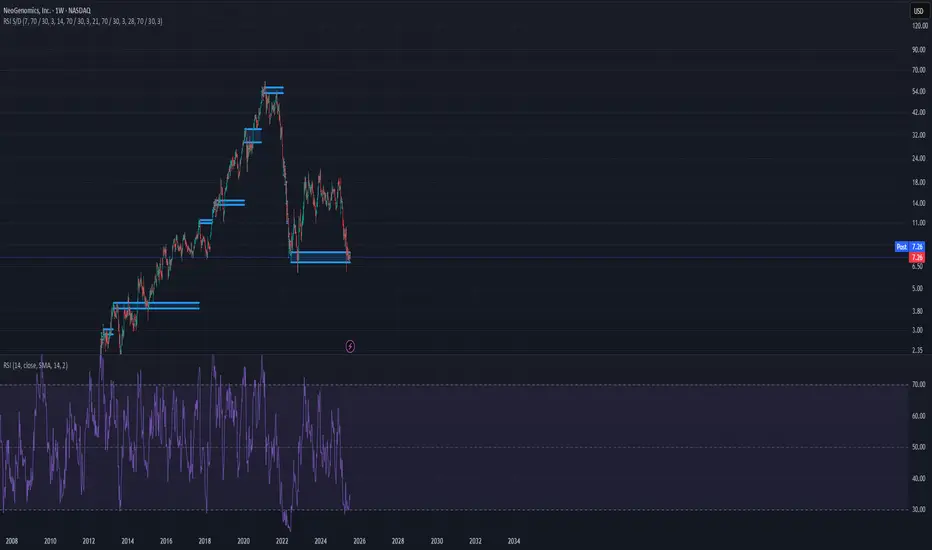
Generational bottom is in. Breakout has begunAfter forming a bullish wedge for a few months, the price went sideways for another 3 months which is a very good sign that the bottom is in.

ichi publicThe Ichimoku Cloud Strategy is a trend-following and momentum-based trading system that utilizes the Ichimoku Kinko Hyo indicator to identify potential buy and sell opportunities. It provides a comprehensive view of price action, including support/resistance levels, trend direction, and momentum — all within a single chart.

What's the deal with BRK.B?! Where is the short term bottom?I'm pretty new to this, so I'm looking to see if anyone has any thoughts about BRK.B. The best looking support is the April low, but it seems like it could fall below to the Jan 2025 low with the way it is steadily dropping. That would suck! I'm averaged at $491 and prefer not to see it go that low, but I will be holding very long-term anyway.
Any thoughts on a bottom? They hold 300+ billion in cash, so surely they'll figure out what to do with it soon. *Fingers crossed*

You must be ready for the breakNothing is certain but it consolidates for quite a while the elastic is well stretched

A 50% increase in a short time This stock presents a compelling opportunity, backed by strong fundamentals and a healthy financial outlook. On the technical side, it's forming a bullish chart pattern with clear support levels — indicating strong institutional interest. The setup suggests potential for a breakout if current momentum continues.
Watch list candidate!This guy looks interesting. I see two swing sets shaping up. First is an inverted head and shoulder, and second is cup and handle. This looks coiled to me, and very similar to NASDAQ:APLD in March 2025. Good luck

LAC (Lithium Americas Corp) – Bottom Reversal with Higher Low FoThe LAC stock chart suggests a confirmed bottom structure, supported by a clear higher low pattern—a strong technical signal that downward momentum has likely ended and a trend reversal may be underway.
After an extended downtrend, the price has formed a rounded bottom with two notable troughs, indicating accumulation and base building. The most recent low is higher than the previous one, marking a bullish higher low, which strengthens the case for a trend reversal.
Key Technical Signals:
Confirmed bottom: Rounded bottom pattern over the past several months.
Higher low: Recent price action has respected prior support and pushed higher, a bullish sign of strength.
Breakout zone: Price is currently challenging resistance in the ~$2.80–$3.00 range. A sustained move above this area would confirm bullish breakout momentum.
Upside targets:
First target: ~$4.49 (prior support turned resistance)
Second target: ~$5.19 (key historical resistance zone)
Trade Setup:
Entry: Current breakout attempt (~$2.85)
Stop-loss: Below recent higher low (~$2.43)
Risk-reward ratio: Favorable, targeting ~60–80% potential upside with limited downside risk.
Summary:
LAC is showing signs of a long-term trend reversal, with a confirmed bottom and bullish higher low. If momentum continues, a breakout rally toward previous resistance levels is likely. Traders may consider this a medium-term opportunity, with a solid technical foundation and clear upside targets.
