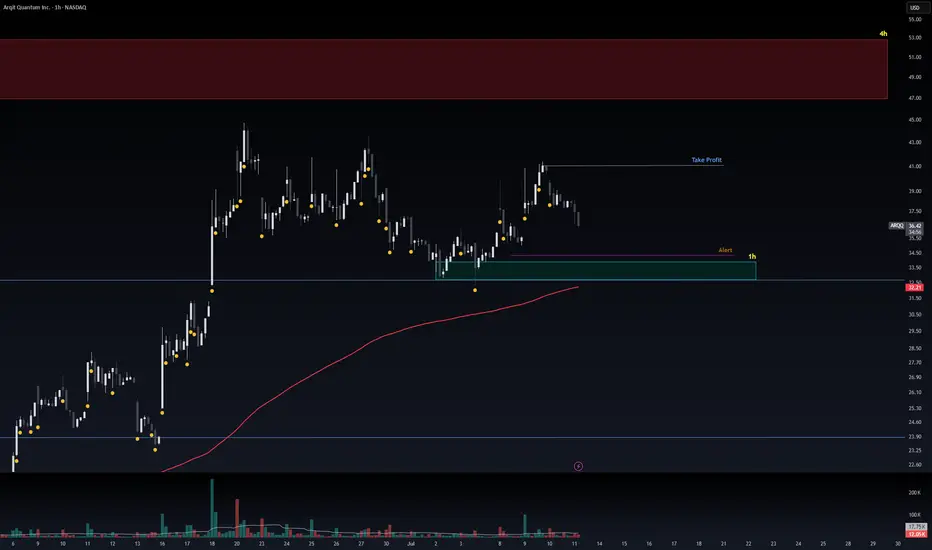
Safe Entry Zone ARQQGreen Zone is Safe Entry.
Stop loss below Green Zone (or blue line both are supports with 200MA below too).
Note: 1- Potentional of Strong Buying Zone:
We have two scenarios must happen at The Mentioned Zone:
Scenarios One: strong buying volume with reversal Candle.
Scenarios Two: Fake Break-Out of The Buying Zone.
Both indicate buyers stepping in strongly. NEVER Join in unless one showed up.
2- How to Buy Stock (safe way):
On 1H TF when Marubozu/Doji Candle show up which indicate strong buyers stepping-in.
Buy on 0.5 Fibo Level of the Marubozu/Doji Candle, because price will always and always re-test the


After 45% Profit On Last Trade, I Am Re-entering UMACTrading Family,
On our stock trades, using my new liquidity indicator, we have been solidly beating the market with a cool 15% profit since our first trade with it. If you had held the SPY from the same time, your profit would have been a more meager 6.5%. Our indicator is proving beneficial, to say the least. And the last time it gave me a buy signal on UMAC, we banked 45% in profit on my last exit. I then determined that if it did not give me a sell signal (it hasn't), I would look to re-enter at that 7.66 level. We have reached that level, and I have dipped my toes back in at 7.94. I would look to double up my position if we drop even further to that 6.44 level, but I don't know that we will. My target of 11.76 will give us another 48% profit on this trade, and I have a SL set at 6.18 for a nice 2.17 rrr.
Let's go!
Stew

WC: 23.59 Target: 1800-2400 MOASS: 47k-100K: PROFITI am a trader...I have one goal at the end of the day: MAKE A PROFIT
This will be my final post on Gamestop as I am now dedicating ALL of my time to Macro Market Coverage...
I FIRMLY believe that there is a high potential for markets to turn SIGNIFICANTLY LOWER over the next year and plan to show people how to trade a bear market profitably and not get absolutely wrecked
As part of my Macro Coverage I will be covering stocks that have high potential to run so I will be dropping updates on GME here and there as it runs
Ive posted every trading day (and the weekends) on Gamestop for well over a year
I was around for the original squeeze and I will be around if (no guarantees in markets as I always say) it squeezes again
Ok lets get to what you want to know:
20 Week Cycle has NOT been invalidated as far as im concerned
06/09 did see big changes but just havent seen the price improvement...yet
I think we see the price improvement start MIDDLE to END of Aug and will ramp up thru Sep/Oct
I have SPX dropping to 5100-5400 over the next couple months...that will most likely drag GME down a bit but expect 21.54 to be a solid place to position trades
If/When GME moves higher the FIBS ARE STILL YOUR GUIDE
Draw an Anchored VWAP from the 21.54 low...If GME breaks 21.54 draw another Anchored VWAP from wherever it bottoms...those two VWAPS will be the most powerful things you can put on your chart to track GME trend
TRADE WHAT YOU SEE...NOT WHAT YOU HOPE FOR
One last word on Roaring Kitty:
I do believe he is lurking and will be back...my guess as to when? Flip Mode 09/07
Histograms are not aligned yet and as you see price is choppy
From a 20 Week Cycle perspective it appears price will rise when it reaches the GREEN VERTICAL LINES
Still think this is the best interpretation ever laid out on what Roaring Kitty is doing..I obviously dont have it completely figured out though
Good Trading To You All!!!
P.S. the YEARLY VWAP is at 26....thats the likely LAUNCH point for price

TSLA, Long, 1D✅ TSLA has just broken out of a clear symmetrical triangle pattern, signaling a potential bullish continuation.
Yesterday’s daily candle was a white Marubozu, indicating strong buying pressure and clear dominance by the bulls.
LONG 📈
✅ Like and subscribe to never miss a new technical analysis! ✅

TSLA eyes on $294: Key Support for bulls to hold or face $253TSLA oscillating all over the place thanks to Musk moves.
Currently testing a key support zone $293.96-294.32.
Loss of this floor opens the Golden Genesis at $253.57
See "Related Publications" for previous charts ------------>>>>>>

ADCB – Quick 6% ScalpAbu Dhabi Commercial Bank (ADCB) is showing strong momentum after reclaiming 12.52 AED. Price is currently trading at 13.48 AED, pushing aggressively toward the next key level at 14.32 AED, which stands as a major resistance zone.
📌 Target : 14.32 AED (Major Resistance)
📌 Scalp Gain: +6%

BANK OF KIGALIThe Bank of Kigali has strong fundamentals that can go unnoticed to most. It is a strong Bank serving one of the fastest growing economies in Africa, with about a 30% holding of Rwanda's Banking sector.
Fundamentally, the Bank of Kigali is undervalued. We will be looking at accumulating the Bank of Kigali in the coming months..

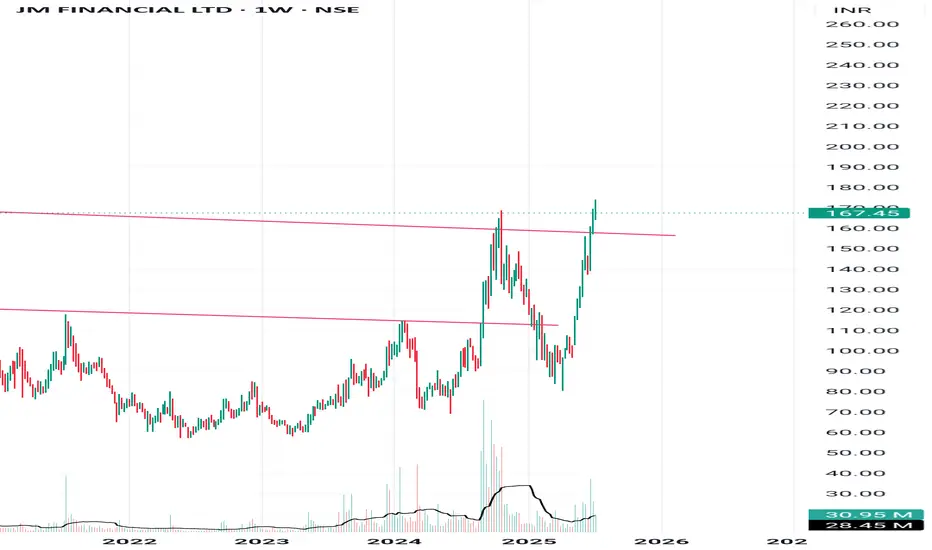
Clear breakout Clear trendline breakout and good to go long. Check volume and do your own analysis too. This is only for educational purposes.
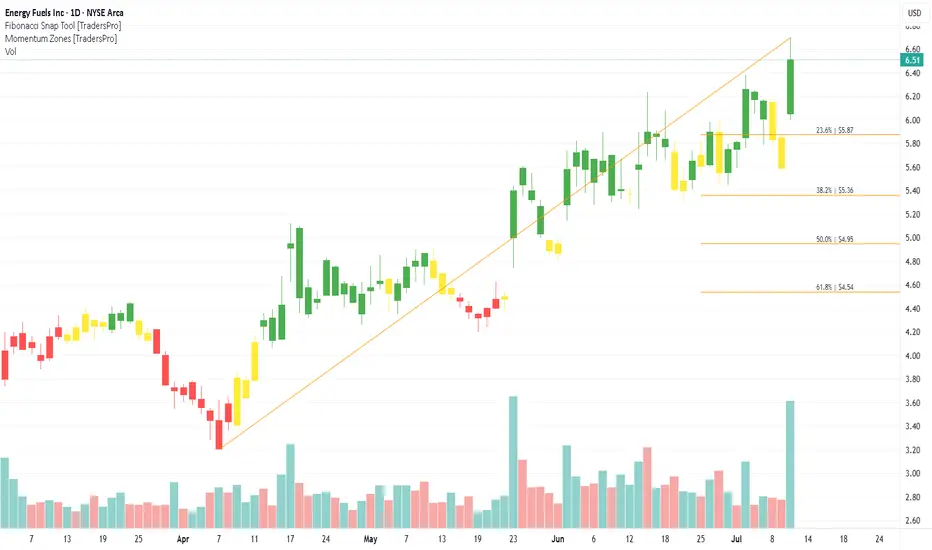
Energy Fuels Inc. (UUUU) Powers U.S. Nuclear Futurenergy Fuels Inc. (UUUU) is a leading U.S.-based producer of uranium and rare earth elements, critical materials for clean energy and national security. With operational sites in the western U.S., Energy Fuels supports nuclear energy production and the shift away from foreign dependency on rare earths. The company’s growth is driven by rising demand for clean nuclear power, rare earth supply concerns, and government support for domestic critical mineral production.
On the chart, a confirmation bar with increasing volume shows strong buying momentum. The price has entered the momentum zone by breaking above the .236 Fibonacci level. A trailing stop can be placed just below this level using the Fibonacci snap tool to protect gains while allowing for continued upside.
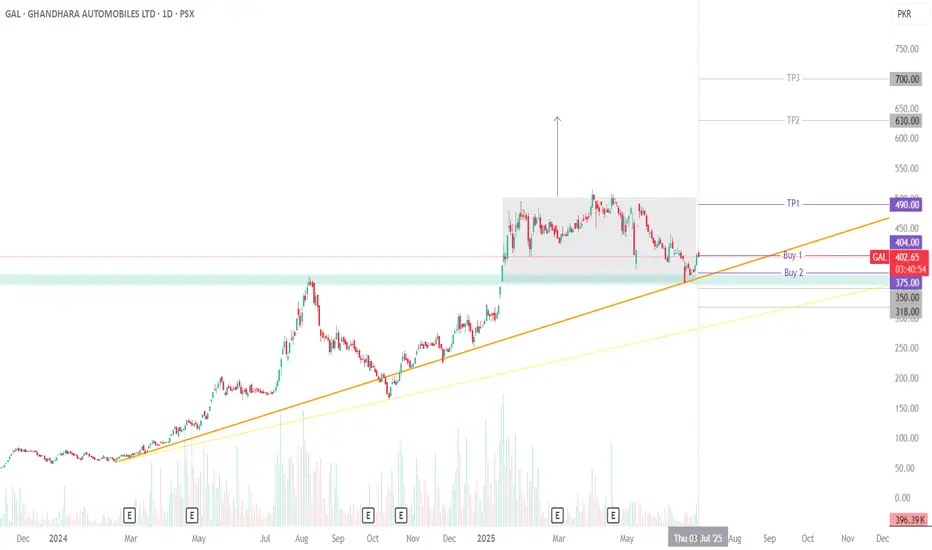
GAL Technical Analysis: Bullish OpportunityGAL (Ghandhara Automobiles Ltd.) is showing a strong bullish setup. Price is holding above its trendline after bouncing off solid horizontal and rectangle support zones. On top of that, GAL has a history of performing well in July, which adds a seasonal boost to the setup.
Fresh entries can be considered at the CMP, while for averaging or pullbacks, 375 and even 350 could offer attractive buy zones if the price dips.
For risk management, there are two stop-loss options: a conservative one below 318 to guard against broader breakdowns or gap fills, or a more aggressive one on a closing basis under 350, just beneath key structure.
Take Profit 1 at 490 lines up with rectangle resistance. A strong close above this opens the door to the next projection around 630. If price manages a firm close above 630, momentum could drive it further, with the AB=CD pattern pointing toward a stretch target near 700.
Trading Recommendations:
Buy 1 (CMP): 404
Buy 2: 375
Stop-Loss (Aggressive): Closing below 350
Stop-Loss (Conservative): Closing below 318
Take Profit 1: 490
Take Profit 2: 630
Take Profit 3: 700
Happy trading!
PHM (PulteGroup) – High-Probability Swing Trade Setup📈 Symbol: PHM (PulteGroup)
⏳ Timeframe: Daily Chart
⚡ Strategy: Swing Trade (2-4 Weeks)
🎯 Trade Setup
Entry Zone: $114.00 (Daily SMA 20 + Psychological Support)
Stop-Loss (SL): $104.80 (8% below entry, below SMA 50)
Take-Profit (TP): $133.10 (+16.7% upside, Historical Resistance)
Risk-Reward Ratio: 1:2.4 (Controlled Risk, High Reward)
📊 Technical Analysis
✅ Trend:
Strong Uptrend across all timeframes (Daily, 4H, 1H).
Higher highs & higher lows confirmed.
✅ Key Support Levels:
$114: Confluence of Daily SMA 20 + 38.2% Fibonacci retracement.
$110: Daily SMA 50 (Institutional accumulation zone).
✅ Indicators:
RSI (14): 69.51 (Neutral, no extreme overbought signal).
MACD: Bullish crossover + Positive histogram expansion.
Volume: Rising on bullish candles (Confirms buying interest).
Key Levels:
Resistance: $120 (Recent High), $133.10 (Final Target).
Strong Support: $104.80 (Technical SL level).
💰 Fundamental Backing
Strong Growth:
+Strong Growth in Net Income (+18.5% YoY).
Stable revenue in a resilient housing market.
Healthy Balance Sheet:
Minimal Debt (Score 10/10, Debt/Equity: 0.17).
Fair Valuation (P/E 8.13 – Undervalued vs. sector).
Catalyst: U.S. Housing Demand + Pro-Housing Policies.
⚡ Trade Execution Plan
1️⃣ Entry: $114.00 (Confirmed Technical Support Zone).
2️⃣ Stop-Loss: $104.80 (Protects against trend reversal).
3️⃣ Take-Profit: Scaled Exit –
TP1: $120.00 (Sell 50% to lock in profits).
TP2: $133.10 (Trailing stop to capture momentum).
4️⃣ Dynamic Management:
Move SL to $110 after reaching $120 (Secures gains).
📌 Why PHM?
Strong Sector: Housing market recovery with sustained demand.
High Liquidity: Avg. Volume ~2.5M shares (No slippage risk).
Technical + Fundamental Alignment:
Uptrend + Strong Fundamentals = High Probability Trade.
⚠️ Risk Management
Max Risk per Trade: 1-2% of capital.
Avoid Key Events: Interest rate reports (Check economic calendar).
🎯 Final Call: BUY PHM at $114, SL $104.80, TP $133.10.
🔔 Follow for More Swing Trade Setups!
👍 Like if You Find This Helpful!
#TradingView #Stocks #PHM #SwingTrading #RealEstate #TechnicalAnalysis
(Disclaimer: Not financial advice. Do your own research.)

ITS TIMEGME coiled on the 4hr RSI break 50 were launching from the POC area to 24.50 to next MA. Overall target after taking 26 is VAH around 27.58. The drop down was profit taking/ overextended /sell the news after all the hype leading into the btc purchase announcement they didn't disclose purchase price either from what I know. But btc is at ATH the 500M is now in decent profit and last quarter rev and earnings were good. Last time gme broke out was 17% on a overall stock market correction day, seems like thats going to be the case again for now im in the Aug 1 25 calls for .6 looking to close these in profit and roll to higher further out strike like the jan 26 35. cheers, here kitty kitty.

ASAHI INDIA GLASS- Bullish Flag & Pole Breakout (Daily T/F)Trade Setup
📌 Stock: ASAHI INDIA GLASS ( NSE:ASAHIINDIA )
📌 Trend: Strong Bullish Momentum
📌 Risk-Reward Ratio: 1:3 (Favorable)
🎯 Entry Zone: ₹851.00 (Breakout Confirmation)
🛑 Stop Loss: ₹809.00 (Daily Closing Basis) (-5 % Risk)
🎯 Target Levels:
₹875.10
₹897.85
₹920.90
₹945.65
₹969.00.00 (Final Target)
Technical Rationale
✅ Bullish Flag & Pole Breakout - Classic bullish pattern confirming uptrend continuation
✅ Strong Momentum - Daily RSI > 60, Weekly RSI >60 Monthly rsi >60
✅ Volume Confirmation - Breakout volume 121.30K vs previous day's 1.63M
✅ Multi-Timeframe Alignment - Daily and weekly charts showing strength
Key Observations
• The breakout comes with significantly higher volume, validating strength
• Well-defined pattern with clear price & volume breakout
• Conservative stop loss at recent swing low
Trade Management Strategy
• Consider partial profit booking at each target level
• Move stop loss to breakeven after Target 1 is achieved
• Trail stop loss to protect profits as price progresses
Disclaimer ⚠️
This analysis is strictly for educational purposes and should not be construed as financial advice. Trading in equities involves substantial risk of capital loss. Past performance is not indicative of future results. Always conduct your own research, consider your risk appetite, and consult a financial advisor before making any investment decisions. The author assumes no responsibility for any trading outcomes based on this information.
What do you think? Are you watching NSE:ASAHIINDIA for this breakout opportunity? Share your views in the comments!

NFLX Bear Call Spread Near Max Profit – Watching 61.8% Fib Zone📉 I'm currently holding a Bear Call Spread 1300/1280 expiring on Jul 18. After multiple Breaks of Structure (BOS) and strong rejection from 1300, price is trending toward a key 1H demand zone near the 61.8% Fibonacci retracement (1242).
📊 Technical Context:
Bearish CHoCH + BOS confirms short-term trend reversal
Clear rejection from 1280–1300 supply
1242 = strong confluence: Fib + demand zone
🎯 Plan:
Hold the spread close to expiration for max profit
Close before earnings on Jul 17 to avoid volatility
If price shows strength at 1242, I may flip bias and look for a bull call spread post-earnings
🔔 TradingView Alerts:
1242: “Watch for bullish reaction at demand zone”
1278: “Rebound in progress – reassess post-earnings”
📌 This is a two-stage plan: secure gains on the short side, then prepare for potential upside.
➡️ Follow me for more structured trade ideas based on price action, options, and macro timing.

Tesla (TSLA) 1-hour chartTesla (TSLA) 1-hour chart im provided, here are the key bullish target points indicated by the chart analysis:
📈 Bullish Target Points (Upside Levels):
First Target Point:
🔹 Around $338.00 – $340.00
This level is marked as the initial breakout target, likely based on recent price structure and resistance zone.
Second Target Point (Extended Target):
🔹 Around $362.00 – $364.00
This is the higher target zone, representing a potential move if bullish momentum continues strongly. Likely aligning with a measured move or previous highs.
🧠 Context:
Price has broken out of a descending triangle/wedge pattern, a bullish signal.
It's also moving above the Ichimoku cloud, showing short-term bullish trend continuation.
Holding above the breakout level (around $305–$308) is critical to maintain upward momentum.

AAPL: The Rally Might Not Be OverWhile many tech giants have already reached new all-time highs, Apple is still lagging behind — NASDAQ:AAPL hasn’t yet broken out. This may represent both a risk and an opportunity for latecomers.
Investor caution remains due to potential tariffs on Apple products from China, with the decision now postponed until August.
This uncertainty may be holding the price back, but could also lead to a strong accumulation phase if no negative headlines emerge in the near term.
Technicals:
• A breakout above $215 could open the way toward $249 (previous high).
• Support at $197 remains strong.
• Stochastic is in overbought, but MACD confirms bullish momentum.
NASDAQ:AAPL may start catching up with the broader market — especially if tariff fears subside. Watch closely for a confirmed breakout above $215.

Positional trade setup for KSB Ltd (NSE: KSB)Technical Analysis (Daily Chart)
CMP: ~₹880
Resistance Zone: Approaching strong overhead resistance at ₹890–900 (prior highs).
EMA 5–9–20: Stack is bullish and sloping upward (current EMAs ~₹830).
Chart Pattern: Potential bullish breakout setup; look for a clean close above ₹900.
Momentum & RS: Relative strength versus SPX is turning upward—hinting at upside catch-up.
Volume: Increase on upward candles, signaling accumulation.
🎯 Trade Plan
Entry: Close above ₹905–910
Stop-Loss: Below ₹850 (daily close)
Target 1: ₹980
Target 2: ₹1,050+
Risk–Reward: ~1:2 or better
🧾 Fundamental Snapshot
📌 Market Cap: ~₹14,600 Cr
📌 P/E: ~57.5×
📌 P/B: ~9.9×
📌 ROCE: ~21.5%
📌 ROE: ~16.7%
📌 Dividend Yield: ~0.5%
📌 Debt-to-Equity: Zero (virtually debt-free)
📌 5-Year Profit CAGR: ~22%
Strengths
Strong financials: high ROCE/ROE, no debt, consistent dividend payout (~29%).
Screener
Profitable and stable business in global industrial pumps & valves.
Risks
Valuation premium: trading at rich P/E and P/B multiples—market growth expectations are high.

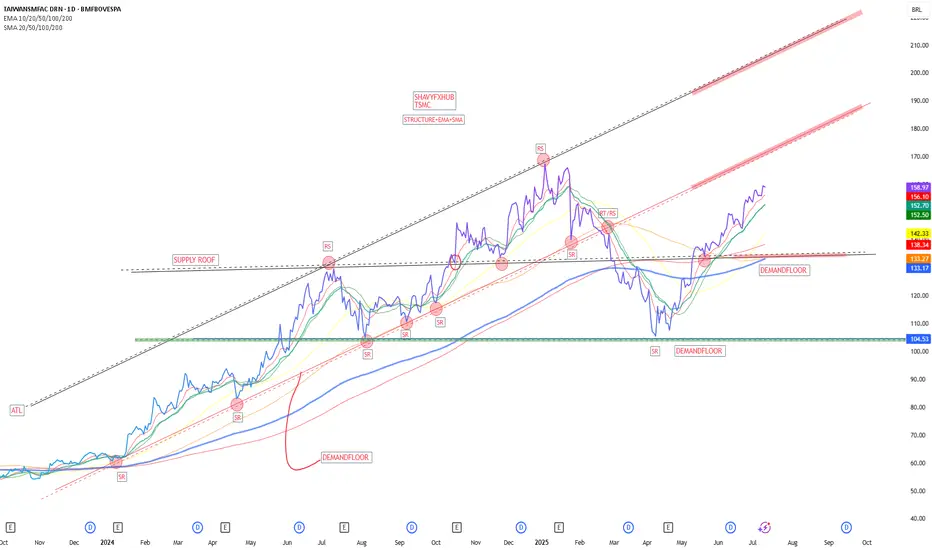
TSMCThe Taiwan Semiconductor Manufacturing Company Limited (TSMC) is the world’s largest and most advanced semiconductor foundry, headquartered in Hsinchu Science Park, Taiwan. Founded in 1987 by Morris Chang, TSMC pioneered the pure-play foundry model, focusing exclusively on manufacturing chips designed by other companies, enabling fabless semiconductor firms like NVIDIA, AMD, and MediaTek to thrive.
Key Facts about TSMC (July 2025):
Market Position:
The dominant global semiconductor contract manufacturer, with a market capitalization exceeding $1.19 trillion (over $1 trillion USD), making it one of the most valuable tech companies worldwide.
Technology Leadership:
TSMC leads in advanced process technologies, producing chips at cutting-edge nodes including 3nm and moving toward sub-2nm by 2028. It was the first to commercialize extreme ultraviolet lithography (EUV) at scale.
Recent Growth:
In Q1 2025, TSMC reported a remarkable 42% year-over-year revenue increase, driven by surging demand for AI server chips, smartphones, and stockpiling ahead of US tariffs. Revenue for Q1 2025 was around NT$839 billion (~$25.5 billion USD).
Expansion Plans:
TSMC is aggressively expanding capacity with nine new facilities planned in 2025, including eight fabs and one packaging plant across Taiwan and overseas locations such as the US, Germany, and Japan. Fab 25 in Taichung is set to begin construction by year-end 2025, supporting the company’s roadmap toward sub-2nm chip production by 2028.
Global Importance:
TSMC is central to the global semiconductor supply chain, producing chips used in high-performance computing, smartphones, automotive electronics, AI applications, and more. It plays a strategic role amid US-China trade tensions and global tech competition.
Leadership:
The CEO is C. C. Wei, who has overseen TSMC’s continued technological innovation and expansion.
TSMC remains a cornerstone of the global semiconductor industry, driving innovation and capacity expansion to meet the growing demand for advanced chips powering AI, 5G, automotive, and consumer electronics worldwide.
#AI #STOCKS
$IONQ – Breakout Watch at $48 After Months of ConsolidationNYSE:IONQ has been basing since January, quietly marinating under the $48 level — and now we’re approaching the trigger zone. Technically, it’s a great setup. But context is everything.
🔹 The Setup
Multi-month base under $48 — a breakout above that level could release serious energy.
The structure is clean, and the volume profile is tightening — signs that something is brewing.
🔹 My Concerns (Let’s Keep It Real):
Price action has been weak — this stock hasn’t traded clean lately.
Late-cycle behavior: Even A+ setups have been failing lately — breakouts aren’t sticking like they should.
Market conditions matter: I need to see risk-on confirmation from NASDAQ:QQQ , AMEX:IWM , CRYPTOCAP:BTC , and crypto names before trusting this breakout.
🔹 My Trade Plan:
1️⃣ No Anticipation Here: Only trading this on A+ intraday setup — strong volume, clean trigger through $48.
2️⃣ Risk Control: Tight stop — can’t give it room in this tape.
3️⃣ Market Check: I want to see risk-on flows:
✅ NASDAQ:QQQ strong
✅ AMEX:IWM green
✅ CRYPTOCAP:BTC & crypto names moving
✅ Speculative names showing juice
Why I’m Watching It Anyway:
Long base = stored energy
If the market flips risk-on and NYSE:IONQ catches a bid, this could move fast
But patience is key — not every setup needs to be taken

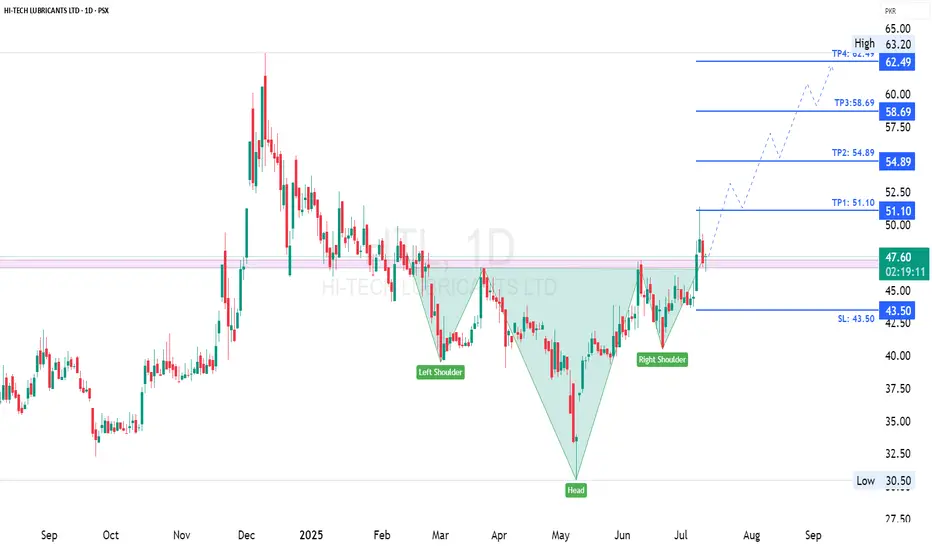
HTL | Inverse Head & ShoulderHTL Inverse Head & Shoulder Pattern
Accumulation Range @ 46.70-47.30
Target 1 @ 51.10
Target 2 @ 54.89
Target 3 @ 58.69
Target 4 @ 62.49
Stoploss @ 43.50