Al Salam (SALAM) DFM Buy Opportunity"SALAM " (Al Salam Bank) Recently bounced from a Daily Demand Zone, and breaking the downward correction trend line.
Buying Opportunity: The stock is currently at a discounted level and likely to resume the up trend again.
Trade safe.. :)

TAQA ADX Long setupTAQA just reset off that demand zone, carved out a clean Wave 2, and now revving for the Wave 3 engine. That 3.37 breakout could be the ignition — where the real fire starts.
Clear impulsive move starting late June; we’re likely in a Wave (3) of a new bullish sequence.
Wave (3) could extend toward 3.53–3.71 based on symmetry and momentum of previous wave.
🎯 Trade Setup (Long)
📍 Entry:** 3.36 (current level)
📉 Stop Loss:** 3.31 (below demand zone + Wave 2 low)
🎯 TP1: 3.53 (Wave 3 target)
🎯 TP2: 3.71 (Wave 5 target)
Risk/Reward Ratio
To TP1: \~4.5R
To TP2: \~9.0R+
“Opportunities come infrequently. When it rains gold, put out the bucket, not the thimble.”
⚠️ Disclaimer
This is not financial advice. Always do your own analysis and use stop losses. Markets carry risk — especially during earnings or news catalysts.

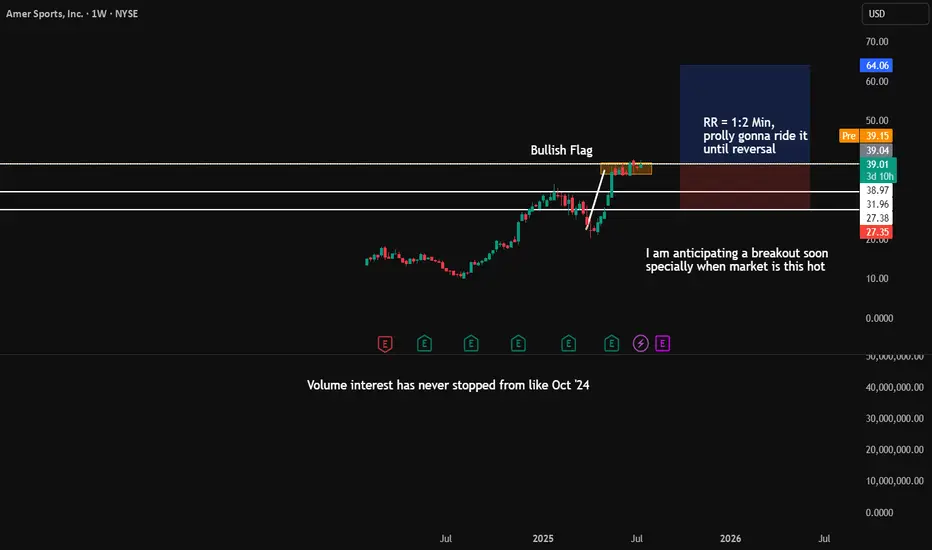
AS breakout anticipationThis company has regularly beaten the estimates.
The Fundamental trajectory is in uptrend.
What I love about this kind of stock is there is constant above average volume, the volume interest is keeping on rising from Oct '24. For me Bullish flag breakout is what's going to happen sooner or later.
Well pullback to $38.97 is possible, but with good risk management it will be easy for me to risk some for the potential huge breakout that I am anticipating.
QuickView : AKAMOn the daily Chart the price is trying to make a move higher without success. Bears are still in control and a new bearish crossover is coming.

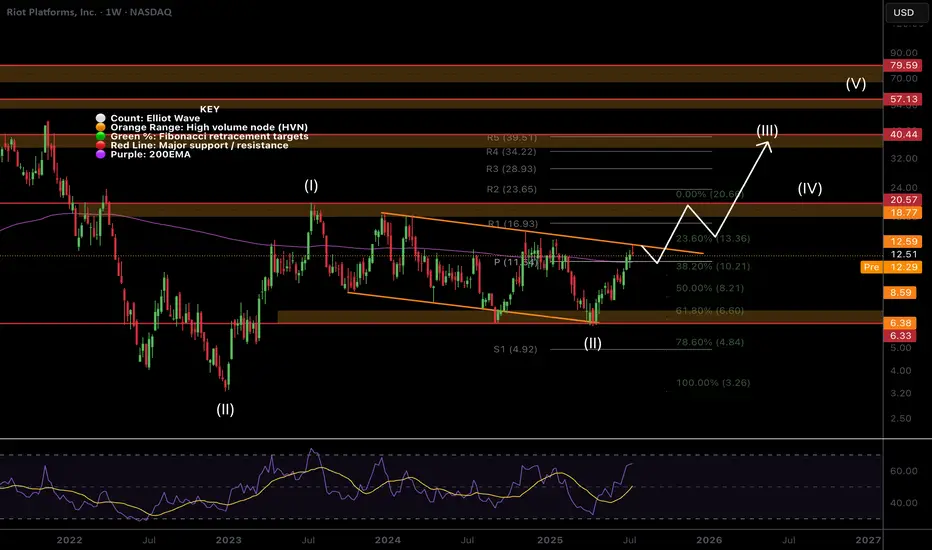
$RIOT Hit The Target Whats Next?NASDAQ:RIOT hit the descending orange resistance were I took partial take profits on my trade this week and it was immediately rejected as expected.
Price is now above the weekly pivot so that is the next support. This level also matches the weekly 200EMA.
Wave (II) hit the 'alt-coin' golden pocket of 0.618-0.786 Fibonacci retracement at the High Volume Node (HVN) support and descending support line which kicked off wave (III).
A breakout above the descending resistance line bring up the the next target of the HVN and previous swing high at $18-20 and $40 following a breakout above that.
Safe trading
Quick View: $AZN- On the daily Chart the price is testing now the lower side of the channel with a new bullish crossover and positive price action. Looks like there is a great chance for a new entry here

PAYTM - 3 WHITE SOLDIERSNo. of Candles: 3
Trend Context: Appears after a downtrend or consolidation (best)
Body Size: Long real bodies (bullish)
Wicks: Small or nonexistent lower wick
Volumes: > avg of 10 days
My criteria for spotting 3 white soldiers -
Each candle needs to opens within or slightly below the previous candle’s body and closes higher than the previous candle.
The candles also have a small or no lower shadow, indicating consistent buying pressure.
High on volumes

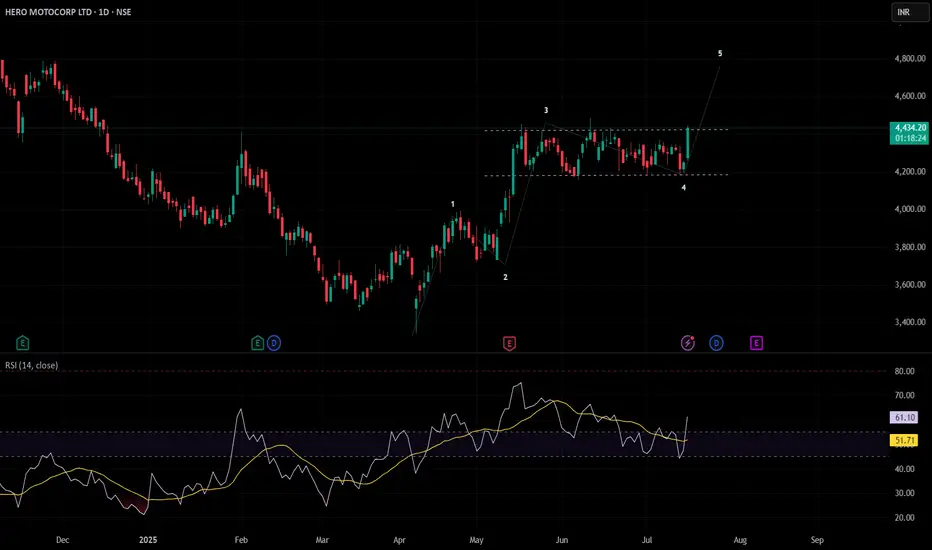
Hero MotoCorp: Reversal in Sight? 🚀 Hero MotoCorp: Reversal in Sight? 🚀
📉 CMP: ₹4438
🔒 Stop Loss: ₹4090
🎯 Targets: ₹5030 | ₹5700
🔍 Why Hero MotoCorp Looks Promising?
✅ Rounding Bottom Breakout: Weekly close above ₹4412 confirms this bullish reversal pattern
✅ Box Breakout: 8-week consolidation range of ₹4454–₹4202 broken above ₹4460, signalling strength
✅ Flag & Pole Setup: Larger range of ₹3354–₹4454 forms a flag-pole structure with breakout above ₹4460
💡 Strategic Insight:
📈 Confirmation Level: A weekly close above ₹4500 will further confirm reversal for long-term upside
🔒 Strict SL: Maintain stop loss at ₹4190 to manage downside risks effectively
📍 Outlook: Multiple technical setups indicate potential for a long-term bullish reversal with targets up to ₹5700.
📉 Disclaimer: Not SEBI-registered. Please do your own research or consult a financial advisor before investing.
#HeroMotoCorp #AutoSector #TechnicalAnalysis #BreakoutTrade #ReversalPattern #SwingTrading #StockMarketIndia #InvestmentOpportunity

HERO MOTOCORP LTD. breaking outHero looking good for a swing.
Hero MotoCorp is showing signs of a breakout above ₹4,420 with strong buying momentum. If the price stays above this level with good volume, it could rise toward ₹4,930–₹5,000. This looks like a good opportunity for swing traders to enter and aim for higher gains.
BSE at resistance, Long TradeBSE is closes above 2550 then it may give a good up ward move of 50 to 100 points.
On a bullish candle stick pattern and breakout at 2550 a Long call can be taken.
Entry after 2550 ( bullish candle stick pattern and breakout)
SL 2500
Target1: 2600
Target2: 2650.

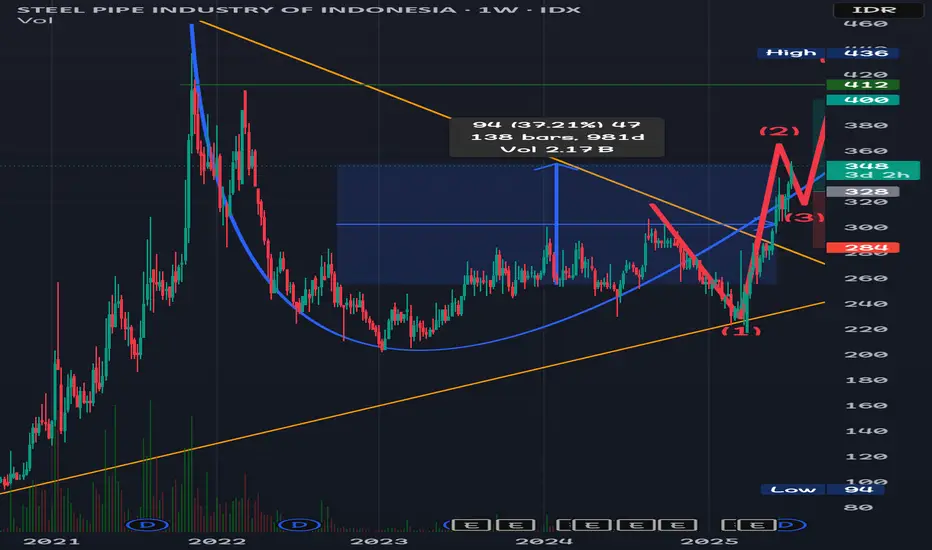
Issp sesuai garisISSP, in English, can refer to several things, but the most common are the International Social Survey Programme and the Information Systems Security Policy. It can also refer to the International Society of Sustainability Professionals or the Integrated Soldier System Project.
Here's a breakdown of the most relevant meanings:
1. International Social Survey Programme (ISSP):
This is a continuing annual program of cross-national collaboration on surveys covering topics important for social science research.
It involves various countries conducting surveys on social attitudes and behaviors.
The ISSP website provides more information about its organization, history, and member states.
For example, the ISSP has conducted surveys on topics like Work Orientations, Citizenship, and Social Inequality.
2. Information Systems Security Policy (ISSP):
This refers to a formal document outlining the security principles, procedures, and controls to protect an organization's data and IT assets.
It establishes a framework for managing information security by identifying risks, defining responsibilities, and specifying security measures.
Tenacy's website provides a guide to understanding and implementing an ISSP.
An ISSP aligns with standards like ISO 27001.
Fleet.co provides guidance on crafting an Information Systems Security Policy.
Movement will be same as trendline.
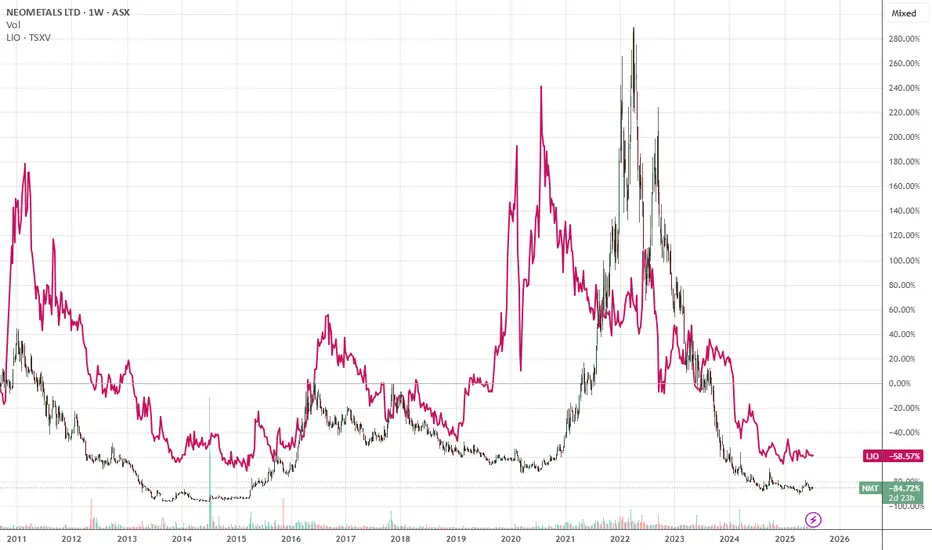
A sector wide issue, resources to double at leastA sector wide issue, resources to double at least. It seems to be a world wide issue that resources do not get valued well. Their Price to Earnings is often below 5, while tech often gets above 100. The growth does not warant that anymore.
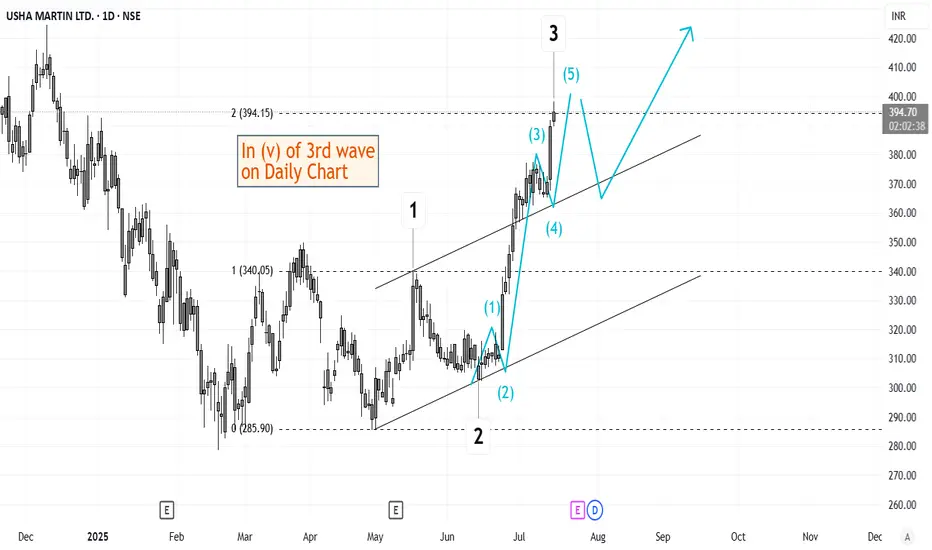
Elliott Wave Analysis of Usha Martin USHAMARTThe script is currently in (v) of 3rd wave on daily time frame. This should be followed by a short retracement and then a 5th wave up. Will keep updating this chart as it progresses.
SLOW AND STEADYChart : downtrend on monthly basis
Using monthly chart to look for direction.
Price move slow and steady.
If break 0.415, the trend reversal is on the way.
#trade at your own risk

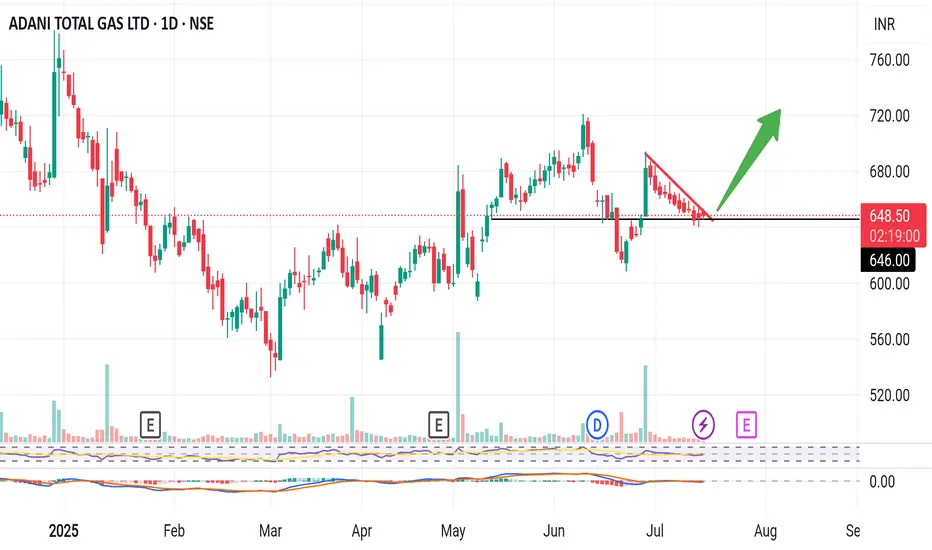
Atgl ready for big jump . Atgl accumulation phase going on. Anytime big breakout possible target 690/720/770...sl 610 below day close .risk reward 1:2/1:3/1:5. Choice z yours
Elliott Wave Analysis of Kirloskar Brothers KIRLOSBROSThe script is currently in 4th wave of hourly chart. The 4th wave seems to be ending, which means a 5th wave will start from here. The wave patters and patterns, retracements and analysis have been highlighted on the chart. Will update this as it progresses.

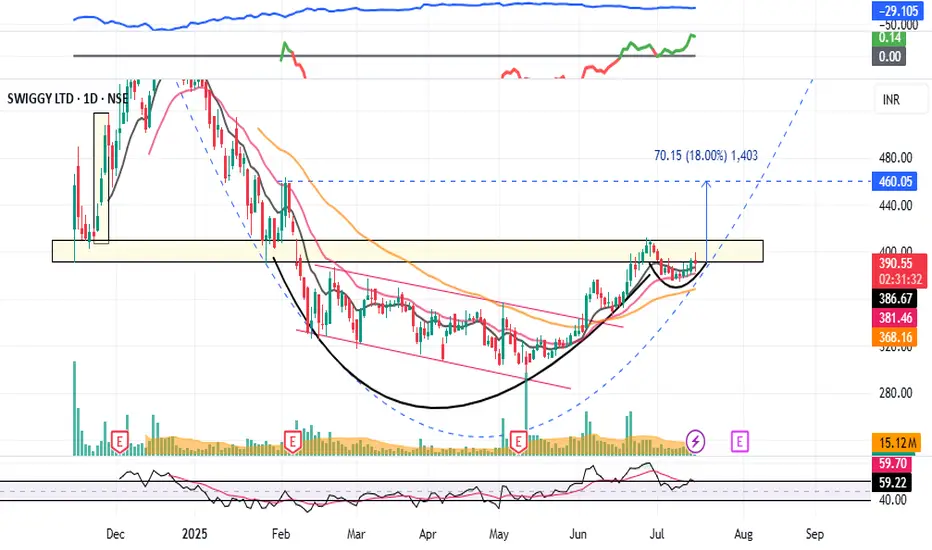
SWIGGY - Breakout Soon (1-3 months)#SWIGGY #breakoutstock #patterntrading #cupandhandle #roundingbottom #trendingstock
SWIGGY : Swing Trade (1-3 Months)
>> Breakout candidate
>> Trending stock
>> Cup and handle pattern
>> Rounding bottom in the long run
>> Good Strength & Volumes Dried up
Swing Traders can lock profit at 10% and keep trailing
Pls Boost, Comment & Follow for more analysis
Disc : Charts shared are for Learning purpose not a Trade Recommendation, Take postions only after consulting your Financial Advisor or a SEBI Registered Advisor.
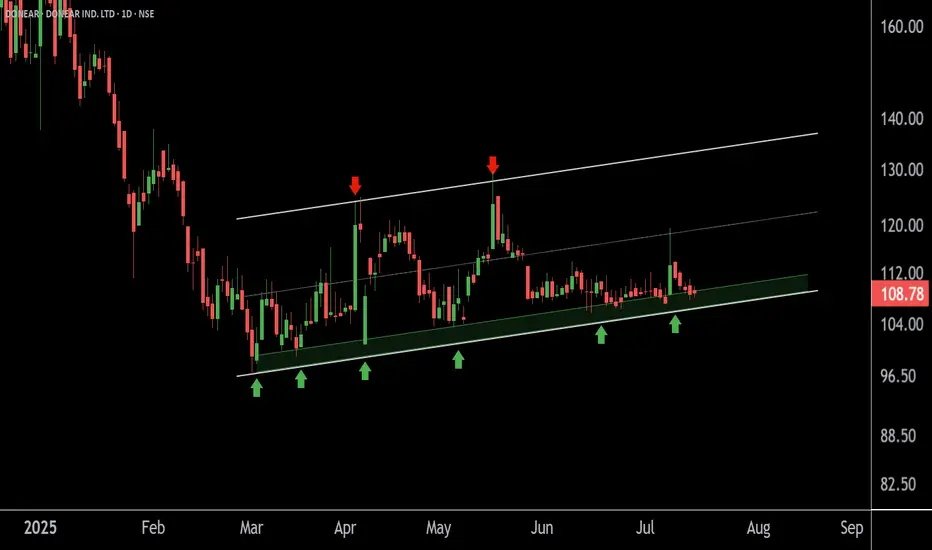
DONEAR at Best Support Zone !!This is the daily chart of Donear Industries.
Donear is moving in well defined parallel channel having a good support zone near 105 level.
if this level is sustain , then we may see higher prices in Donear .
Thank You !!
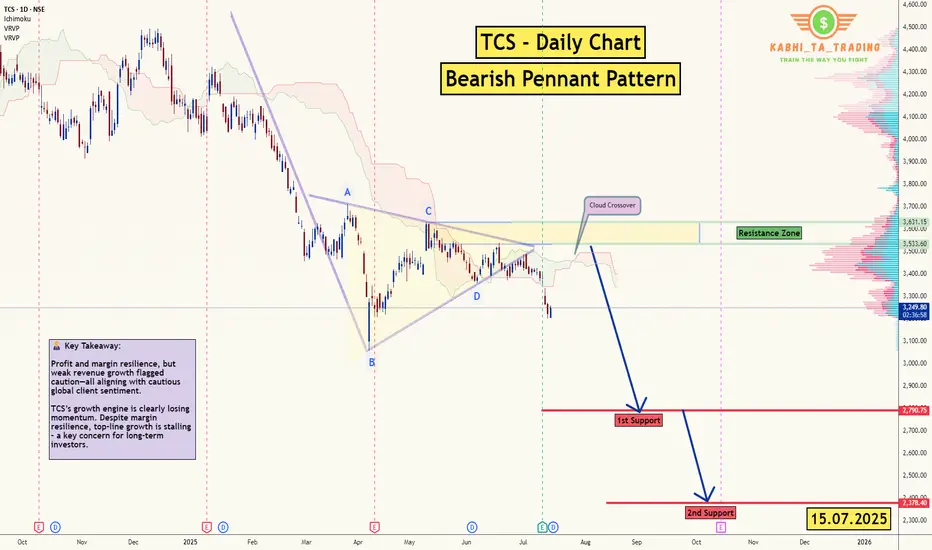
TCS - D1 - Bearish Pennant 🧾 1. 📊 Q1 FY26 Earnings Summary
i. Revenue: ₹63,437 cr (~US $7.4 bn), up just 1.3% YoY, missing expectations of ~₹64,667 cr
ii. Profit/margin held up; revenue disappointed.
📌 Key Takeaway: Profit and margin resilience, but weak revenue growth flagged caution—all aligning with cautious global client sentiment.
🔮 2. Upcoming Events & Catalysts :
Ex‑Dividend Date: Record date July 16, for interim dividend of ₹11/share.
Macro Cues: U.S. tariff developments, global IT spend trends, and sector peers (HCL, Infosys) Q2 reports. Reflation in IT services could shift sentiment.
TCS Investor Engagements: Gen‑AI STEM program (Jul 9); presence at global fintech & life‑sciences events through Sep (SIBOS, COBA) .
📆 3. Catalysts Ahead :
Global IT Budget Trends (esp. U.S. and Europe) → direction for next‑quarter bookings.
Peer Q2 Results (HCL, Infosys) → could provide broader sector cues.
New Deal Wins from BFSI/USD clients → margin & growth potential.
Macro Developments: Trade policies, Fed signals, and inflation data.
Thank you.
Nvidia at a CrossroadsNvidia at a Crossroads: Unstoppable Growth, Geopolitical Tensions, and Fears of Talent Drain to China
Ion Jauregui – Analyst at ActivTrades
Nvidia’s rise as a central player in the artificial intelligence revolution has not been a solitary journey. The company, now valued at over $4 trillion, has built a complex network of suppliers, strategic clients, and industrial partners that fuel its growth. However, this success has also placed the firm under the scrutiny of U.S. authorities, especially amid growing fears of knowledge transfer to China.
Washington on Alert: National Security Risks?
The U.S. government has begun to closely monitor the hiring of foreign talent in strategic sectors. One of its main concerns is the potential unintentional transfer of advanced military knowledge to China through engineers working at companies like Nvidia. The company’s chips power everything from data centers to autonomous systems, and part of its strength lies in the know-how contributed by its employees—many of whom are of Asian descent—to the development of these key technologies.
Although the company benefits enormously from hiring highly skilled engineers—many of them trained in U.S. universities—there is concern in Capitol Hill and the Pentagon that some of these specialists, directly or indirectly, could end up collaborating with China’s People’s Liberation Army. The U.S. Department of Commerce and the Pentagon have increased scrutiny of technical staff with links to China, particularly after identifying several cases of dual-nationality engineers involved in sensitive projects. According to intelligence sources cited by outlets such as Bloomberg and The Washington Post, internal investigations have been launched to review hiring policies at key semiconductor companies. There is concern that without stricter measures, U.S. technological know-how—especially related to dual-use civilian-military GPUs—could leak and accelerate the development of Chinese military capabilities, including AI for warfare.
The Ecosystem Powering Nvidia
Nvidia does not manufacture its own chips: it relies primarily on Taiwan Semiconductor Manufacturing Company (TSMC), which produces its most advanced units—such as the H100 and the new B200 Blackwell chips—using 3 and 4 nanometer processes. Pressure from the U.S. government to relocate production led TSMC to build a factory in Arizona as a geostrategic response to ensure supply on American soil.
Additionally, companies like SK Hynix, Micron, Wistron, and Flex form a key supply chain, providing everything from HBM memory to full system assembly. In parallel, Nvidia has accelerated development of the HBM4 chip amid growing competition from new players such as AMD and AI divisions of Chinese firms.
An AI-Powered Empire: Voracious Clients and Strategic Alliances
Meanwhile, Nvidia’s rise has been meteoric. From a napkin sketch in 1993 to a market cap surpassing $4 trillion, the company has gone from revolutionizing video games to becoming the heart of artificial intelligence. The key lies in its GPUs (such as the H100 and the new B200), which power language models like ChatGPT and Llama-4.
Its supplier network includes TSMC, SK Hynix, Micron, and Wistron, while on the demand side, Microsoft, Meta, Amazon, Alphabet, and Super Micro are among the giants boosting its revenue. In fact, Microsoft alone accounts for nearly 19% of Nvidia’s revenue. Microsoft leads with over $29 billion invested, while Meta allocates more than 9% of Nvidia’s total revenue to training its Llama-4 model. Even Amazon, which develops its own Trainium and Graviton chips, continues to purchase Nvidia GPUs due to high customer demand for cutting-edge products.
Now, all hopes are pinned on the new generation of Blackwell chips. The B200 promises performance up to 30 times higher than the H100 in generative AI tasks, positioning it as the new industry standard. But as the market matures, competition, regulation, and geopolitical risks are all intensifying.
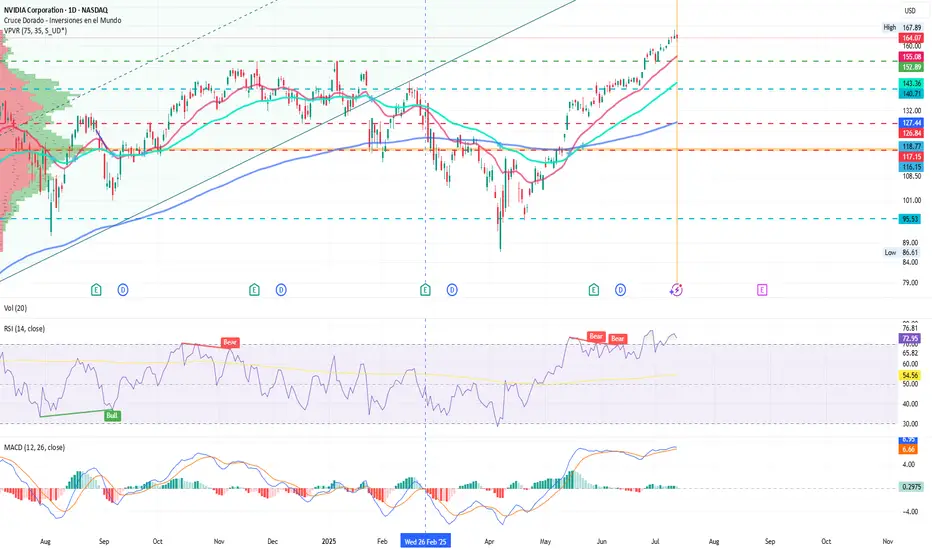
Technical Analysis of Nvidia (NVDA)
Nvidia (NVDA) shares closed yesterday at $164.07, slightly below its all-time high of $167.89. On the daily chart, we observe a consolidation movement after hitting a new record high on Friday. The price remains within an upward channel that began in January 2024.
Key Support: $141.75 (above the 50-session moving average), a level defended by buyers during recent pullbacks.
Immediate Resistance: $167.89 (all-time high). A breakout with volume could open the door to $180 as the next psychological target.
Technical Indicators:
The daily RSI stands at 72.95%, reflecting strong overbought conditions and suggesting continued buying interest.
The moving averages remain in a wide bullish crossover, with no clear sign of directional reversal.
The volume point of control (POC) sits at $118, at the lower end of the consolidation zone.
The MACD continues in a bullish crossover pattern, although it’s starting to show a loss of momentum. This could signal that the price push is weakening, indicating a bearish divergence between price and volume.
The technical outlook remains bullish, but a short-term pause or sideways movement is not out of the question—especially if regulatory pressure or the next quarterly results fail to meet high market expectations. The key level to watch is around $141 as the structural support to maintain the uptrend.
The Future? A Mix of Innovation and Oversight
Nvidia embodies the spirit of Silicon Valley, but its privileged position also makes it a central piece on the global geopolitical chessboard. While its technology drives scientific, medical, and consumer advancements, its ties to Asia and openness to foreign talent will continue to spark friction with Washington.
The big question is whether it can continue to lead the AI race without destabilizing the delicate balance between national security and technological innovation. Time—and the regulators—will tell.
*******************************************************************************************
The information provided does not constitute investment research. The material has not been prepared in accordance with the legal requirements designed to promote the independence of investment research and such should be considered a marketing communication.
All information has been prepared by ActivTrades ("AT"). The information does not contain a record of AT's prices, or an offer of or solicitation for a transaction in any financial instrument. No representation or warranty is given as to the accuracy or completeness of this information.
Any material provided does not have regard to the specific investment objective and financial situation of any person who may receive it. Past performance and forecasting are not a synonym of a reliable indicator of future performance. AT provides an execution-only service. Consequently, any person acting on the information provided does so at their own risk. Political risk is unpredictable. Central bank actions can vary. Platform tools do not guarantee success.
Triangle pattern break out in Roosari Triangle pattern break out in Roosari biotech, Stock is trading above all important moving average (50,100,200). Possible target will be around 840 with a stoploss of 700.
It's not a buy or sell recommendations,For educational purpose only.

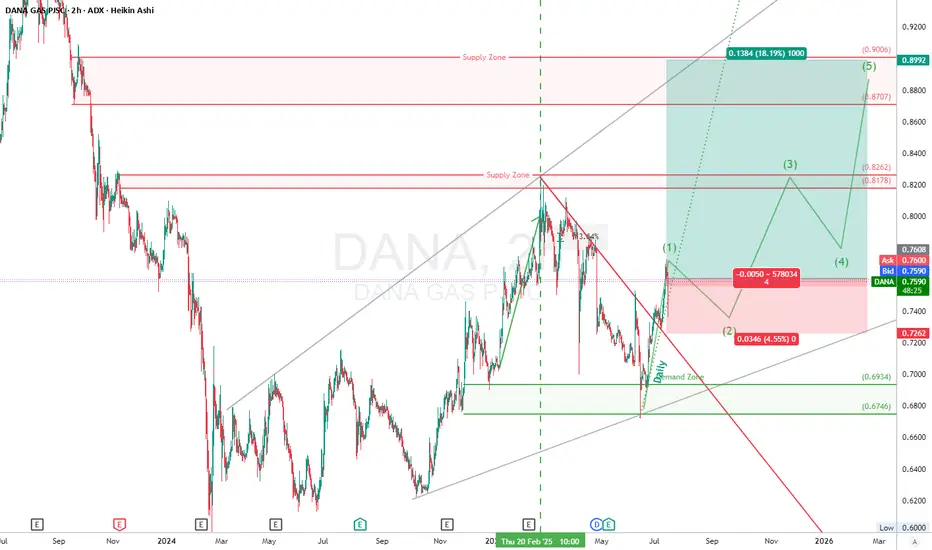
DANA GAS (DANA) ADX Long Setup“DANA just nuked that downtrend line and tagged the demand zone with precision. Now we got that impulsive (1) and the pullback’s setting up like a textbook long. Eyes on the reload zone, ‘cause bulls could lift this to 0.90 in a 3-wave rocket.”
📈 Trade Setup – 2H (Timeframe)
Wave & Structure
Wave (1) of a new bullish 5-wave sequence has just completed.
Current move is in Wave (2) pullback, likely aiming to retest the broken daily trendline or demand block (around 0.72–0.74).
Wave (3) projection targets:
TP1: 0.8178–0.8262
TP2: 0.8707–0.8992 (major supply zone)
Trendline Break:
The red downtrend line from previous high (Feb 2025) is broken with conviction.
Break + retest in play — classic confirmation pattern.
High Timeframe trendlines (gray) continues acting as macro support.
🎯 2H Trade Plan (Long)
📍 Entry Zone : 0.7600
📉 Stop Loss: 0.7246 (below last low)
🎯 Target 1: 0.8262
🎯 Target 2: 0.8707
🎯 Final Target: 0.8992
⚖️ Risk/Reward:
To TP1: ~2.5R
To TP2: ~4.2R
To TP3: ~5.0R+
⚠️ Disclaimer
This setup is for educational purposes only. Not financial advice. Always trade with proper risk management and a verified strategy.