SAMBHAV STEEL TUBESSAMBHAV STEEL TUBES, WEEKEND TRADE looks good it can give you decent profit in couple of week.

TSLA BUY+++ WEDGE FORMING $339 first targetTSLA, like AAPL, is forming a bullish wedge which likely will break to the upside. First target is $339 at wedge resistance then will reevaluate
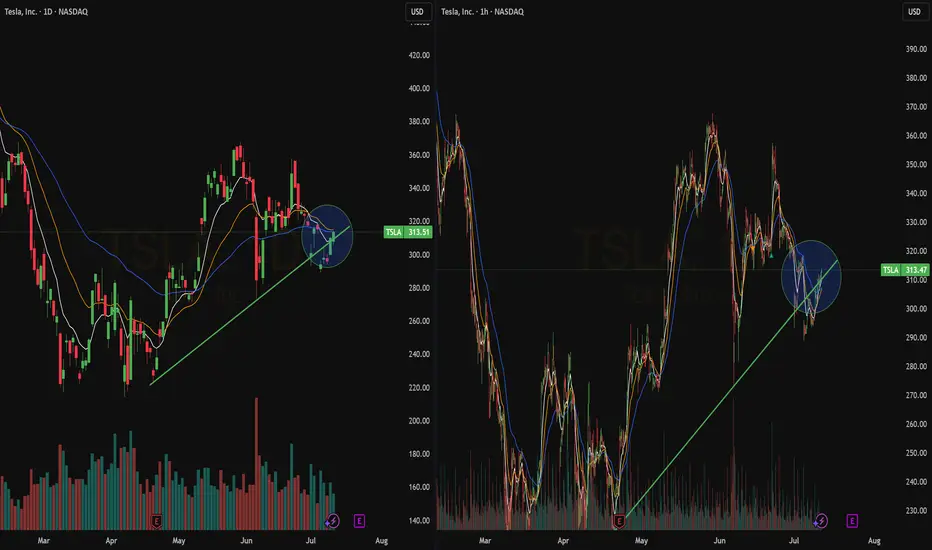
Quick Update : TSLABullish Crossover on the hourly chart at the bottom of the channel.
The action of the last hours is weak as can be seen by the lack f volume.
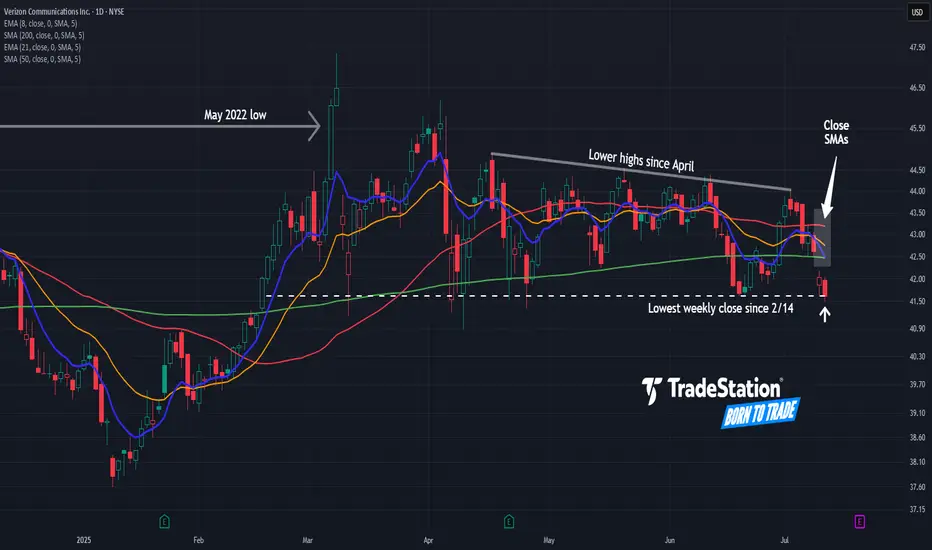
Verizon May Be Rolling OverVerizon Communications has been rangebound for more than a year, and now some traders could think it’s rolling over.
The first pattern on today’s chart is the May 2022 low of $45.55. VZ fell below that level in late 2022 and rebounded to it by mid-2024. The stock has been stuck below the same level since, including a rejection in March. Has old support become new resistance?
Second, prices have slipped below the 50- and 200-day simple moving averages (SMAs). The two SMAs are also close to each other. Those points may reflect weakening longer-term trends.
Third, the telecom stock has made lower highs since April -- even as the broader market broke out to new all-time highs.
Next, VZ just had its lowest weekly close since February. The 8-day exponential moving average (EMA) is also below the 21-day EMA. Those points may suggest that bearishness is taking hold in the short term.
TradeStation has, for decades, advanced the trading industry, providing access to stocks, options and futures. If you're born to trade, we could be for you. See our Overview for more.
Past performance, whether actual or indicated by historical tests of strategies, is no guarantee of future performance or success. There is a possibility that you may sustain a loss equal to or greater than your entire investment regardless of which asset class you trade (equities, options or futures); therefore, you should not invest or risk money that you cannot afford to lose. Online trading is not suitable for all investors. View the document titled Characteristics and Risks of Standardized Options at www.TradeStation.com . Before trading any asset class, customers must read the relevant risk disclosure statements on www.TradeStation.com . System access and trade placement and execution may be delayed or fail due to market volatility and volume, quote delays, system and software errors, Internet traffic, outages and other factors.
Securities and futures trading is offered to self-directed customers by TradeStation Securities, Inc., a broker-dealer registered with the Securities and Exchange Commission and a futures commission merchant licensed with the Commodity Futures Trading Commission). TradeStation Securities is a member of the Financial Industry Regulatory Authority, the National Futures Association, and a number of exchanges.
Options trading is not suitable for all investors. Your TradeStation Securities’ account application to trade options will be considered and approved or disapproved based on all relevant factors, including your trading experience. See www.TradeStation.com . Visit www.TradeStation.com for full details on the costs and fees associated with options.
Margin trading involves risks, and it is important that you fully understand those risks before trading on margin. The Margin Disclosure Statement outlines many of those risks, including that you can lose more funds than you deposit in your margin account; your brokerage firm can force the sale of securities in your account; your brokerage firm can sell your securities without contacting you; and you are not entitled to an extension of time on a margin call. Review the Margin Disclosure Statement at www.TradeStation.com .
TradeStation Securities, Inc. and TradeStation Technologies, Inc. are each wholly owned subsidiaries of TradeStation Group, Inc., both operating, and providing products and services, under the TradeStation brand and trademark. When applying for, or purchasing, accounts, subscriptions, products and services, it is important that you know which company you will be dealing with. Visit www.TradeStation.com for further important information explaining what this means.
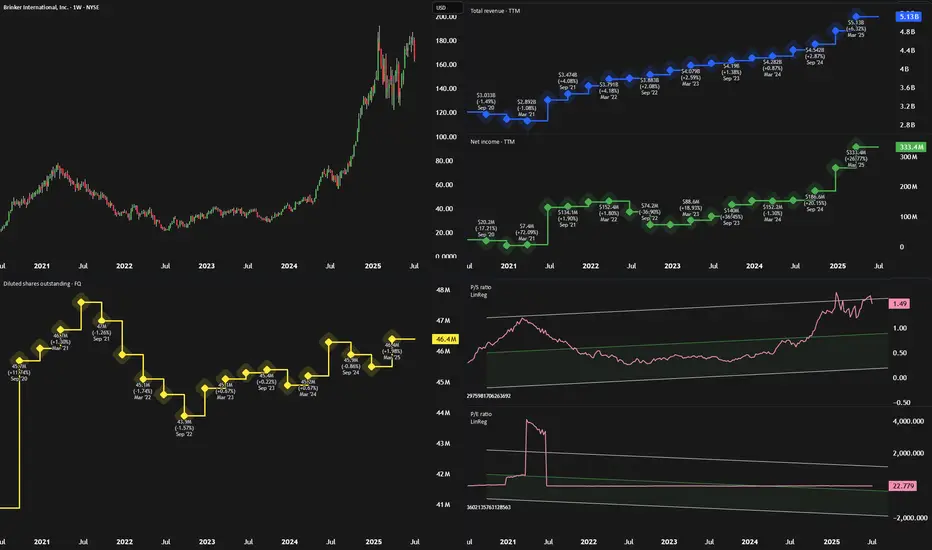
Chili's: Still Cheap, Still Ignored, Still A Strong BuyCasual dining has been in limbo post-pandemic—too pricey for impulse meals, not fancy enough to feel special. But Brinker International (EAT), parent of Chili’s and Maggiano’s, is proving there's still a winning formula if you get the execution right.
🛠️ Operational Overhaul at Chili’s
Chili’s has quietly transformed itself. A deep operational review led to smarter kitchen processes and a slimmed-down menu. These changes boosted both food quality and efficiency. By simplifying things like wing sauces and adding real-time kitchen tools, Chili’s improved service speed and cut costs—freeing up staff to focus on core offerings like burgers and margaritas.
As management put it: "Marketing brings guests in, operations bring them back."
📣 Marketing That Works
Chili’s is also nailing the branding. Viral TikToks and a more relaxed, value-focused message have resonated with consumers—both old fans and new. Unlike competitors chasing trends or discounts, Chili’s has leaned into what it does best: an affordable, comfortable dining experience.
The strategy is working. Traffic is up, and customers are coming back—not just for the hype, but for the value.
📊 Financials and Growth Potential
Analysts expect revenue growth of 21%, 5%, and 5.5% over the next three years, with EPS potentially growing more than 11% annually. However, we believe these estimates undervalue Chili’s long-term growth, especially as margins improve and brand momentum continues.
At just 11x cash flow and a PEG ratio of 0.47, EAT is significantly cheaper than peers like Darden (2.1) and Shake Shack (3.8). That discount suggests the market hasn’t fully priced in Brinker’s turnaround.
⚠️ Risks to Watch
Slowing improvements: Much of the "low-hanging fruit" in operations may already be picked, so future gains could taper off.
Debt load: With $430M in long-term debt, a business slowdown could raise financial pressure, despite recent earnings strength.
✅ Bottom Line: Strong Buy
Chili’s turnaround is more than a viral blip—it’s a smart reinvention. Combined with solid execution at Maggiano’s, Brinker International is proving that casual dining can still thrive.
With strong fundamentals, smart leadership, and a discounted valuation, EAT stock looks like a compelling 'Strong Buy' for the next 12 months.
Spotify's Valuation Is Red-Lining (Rating Downgrade)📈 Spotify's Remarkable Comeback
Spotify NYSE:SPOT has transformed itself from a money-losing audio platform into a disciplined, profit-generating tech firm. Through smarter podcast investments, layoffs, and better monetization strategies, the company recently swung from red ink to positive free cash flow and strong earnings — a major shift for long-frustrated shareholders.
This operational turnaround helped fuel a massive rally: Spotify shares have surged nearly 140% since May 2024.
💵 Financials Look Strong... for Now
Revenue jumped from $15 billion to $17.4 billion over the past year — a 16% increase. Spotify also improved gross margins from 25% to 31.6%, while net margins turned positive at 7%. Bottom-line earnings exploded from a $119 million loss to $1.25 billion in profit.
These gains came from several smart moves:
- Reduced payouts to creators (from 75% to 70%)
- AI-generated content, like white noise playlists, cutting royalty costs
- Ad growth in podcasts and better ad tech
- Higher efficiency in infrastructure and operations
Analysts now expect Spotify’s earnings to grow another 74% this year, 45% in 2026, and 30% in 2027.
💰 But Valuation Is Stretched
Despite the impressive financial performance, Spotify's stock appears overheated. It now trades at:
117x trailing earnings
71x forward earnings
37x estimated 2027 earnings
These multiples are far above historical norms — and could spell trouble if growth slows even slightly. The company is running out of levers to improve margins further, and rising operational costs may start to weigh on profits.
Spotify also trades at its highest-ever price-to-sales ratio, indicating elevated investor expectations. If the company underdelivers, the stock could face a significant correction.
⚖️ Our Take: Time to Hold, Not Buy
We still believe in Spotify's long-term story. Its subscription model, improving margins, and global scale offer compelling advantages. But after this big run-up, the stock no longer offers favorable risk-reward.
We’re downgrading from "Strong Buy" to "Hold", suggesting investors with gains may want to trim positions and wait for a more attractive entry point.
📌 Bottom Line: Spotify has executed well — but the stock price now reflects near-perfect performance. A pause, or pullback, wouldn’t surprise us.

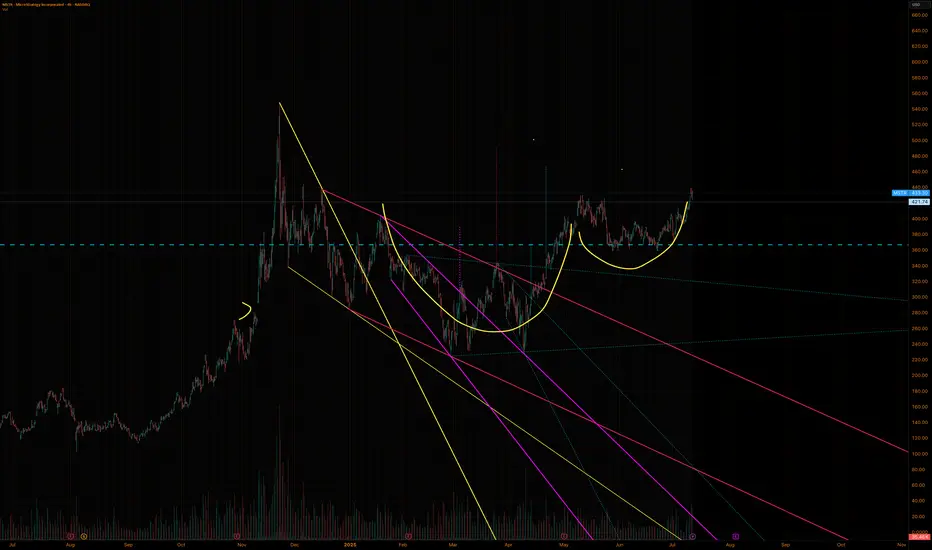
Cup and handleAfter many months, we now have a cup and handle formation. Regardless of Michael Saylor's constant buying, we have a bull flag in play that takes us to $491 USD.
Piramal Intraday Play/ Long:Piramal Intraday Play/ Long:
- Bullish Engulfing Candle with very strong volume
- Price close to the 20 DEMA
- After many indecisive candles, price moves stronger
- Earnings in 15 days.
- Enter long when the price is favorable in lower time frame
- SL: close below 20 DEMA

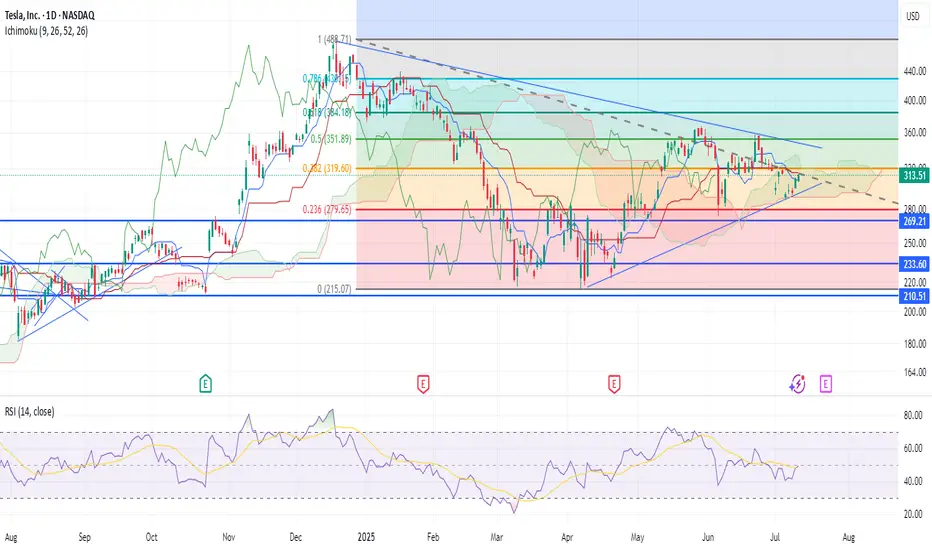
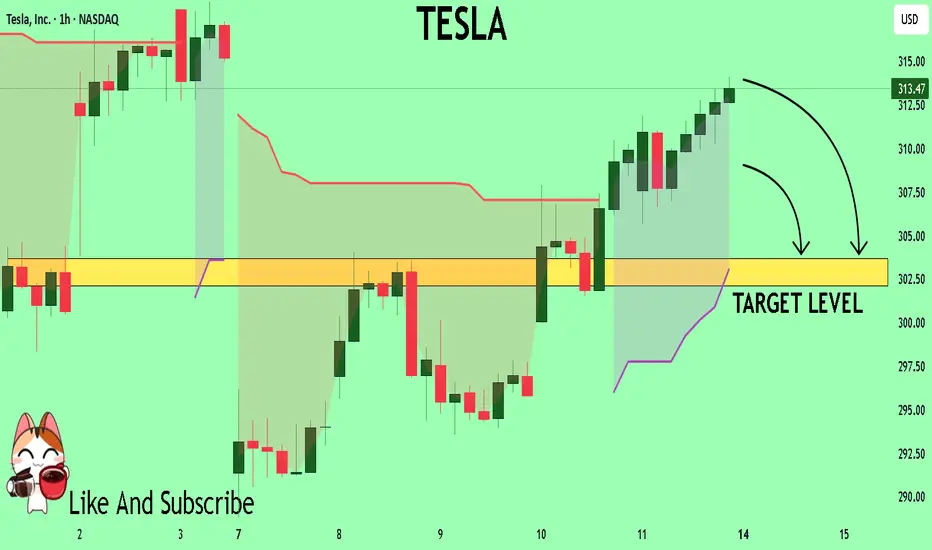
TESLA My Opinion! SELL!
My dear friends,
Please, find my technical outlook for TESLA below:
The price is coiling around a solid key level - 313.47
Bias - Bearish
Technical Indicators: Pivot Points Low anticipates a potential price reversal.
Super trend shows a clear sell, giving a perfect indicators' convergence.
Goal - 303.67
About Used Indicators:
The pivot point itself is simply the average of the high, low and closing prices from the previous trading day.
Disclosure: I am part of Trade Nation's Influencer program and receive a monthly fee for using their TradingView charts in my analysis.
———————————
WISH YOU ALL LUCK
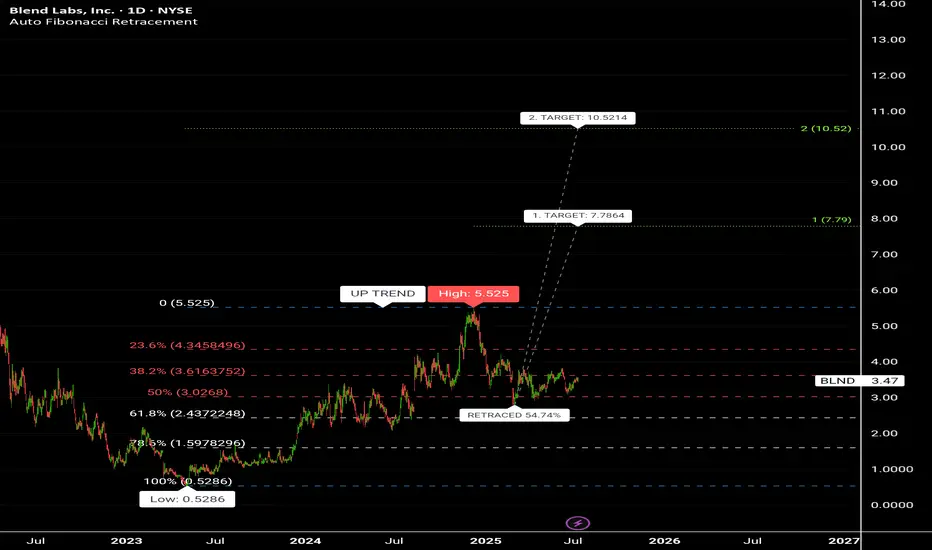
Blend Labs inc (BLND).ABCD Strategic retracment had been implementing on the chart .
Two Target prices are shown on chart , 1st Target price = 7.79 $ , and 2nd Target price = 10.52$ and this match the same Target price of the Cup and Handle pattern that almost formed by crossing nick line at 5.53$ .
It seems to me: A Positive Massive news will be appear to the public soon, and that will reach the Stock price to 10.52$ near future.
💣💣💣💣💣 Highly recommended for Buying 🔥🔥🔥🔥🔥🔥
NVDA GEX Options Sentiment Analysis for July 14🧠 GEX Breakdown
* Key Gamma Resistance (Call Wall):
* $164.94 → Highest NET positive GEX (Gamma Wall) – Major resistance where market makers start hedging against further upside.
* $167.89 (local high) → aligns with 1st rejection wick.
* $170 → 2nd CALL Wall (67.29%) – max squeeze potential if $165 breaks with volume.
* Call Side Build-up:
* $167 – 20.62%
* $170 – 67.29%
Stacked CALL walls above = gamma trap if breached, but tough resistance ahead.
* Put Support Walls:
* $152.50 – Strongest downside gamma support
* $148–149 – Layered 2nd/3rd PUT Wall zone
📊 Options Flow Insights
* IVR: 5.6 (very low) → cheap premiums, low expected move
* IVX avg: 44.1
* Call/Put Bias:
* Calls: 11.8% dominance
* GEX Sentiment: ⚠️ Bearish Reversal Risk (high call saturation at resistance)
✅ Suggested Option Plays (Based on GEX Only)
🔸Bearish Rejection Play
* If NVDA rejects $164.94–$165.20 zone (Gamma + Supply confluence):
* Buy puts targeting $160 or $158
* Trade idea:
* Buy: NVDA 160p (Jul 19 expiry or same week)
* Entry: If price stalls/rejects $164.90–$165.20
* Target: $161 → $158
* Stop: Close above $166.00
🔸Bullish Gamma Squeeze (Only if $165 Breaks Cleanly)
* If price breaks and holds above $165.50 with strength
* Buy calls targeting $170 (2nd CALL Wall)
* Trade idea:
* Buy: NVDA 170c (Jul 19 or 26 expiry)
* Entry: $165.60+ breakout + strong volume
* Target: $169–$170
* Stop: Below $163.80
🕯 1-Hour Chart – Price Action Analysis
Market Structure
* CHoCH → BOS → BOS → creating a clear bullish leg, but current supply box at $165 is rejecting price short term.
* Trendline support: Still holding from July 8 lows
* Liquidity zone: $160.96–$161.10 (first demand zone)
Current Setup
* Price is hovering under supply zone + GEX wall → indicating indecision or potential short-term top
* MACD weakening + volume declining = possible pause or reversal
* Clean higher-low structure still intact for now
🎯 Trade Plan Based on 1H Chart
🟢 Bullish Intraday Plan
* Entry: $161.00–$160.50 demand block
* Confirmation: Bullish engulfing or rejection wick
* Target: $164.94 then $167
* Stop-loss: Below $159.80
🔴 Bearish Intraday Plan
* Entry: $164.90–$165.20 inside supply
* Confirmation: Weakening candle (doji or long wick) + no breakout
* Target: $161.00 then $158.80
* Stop-loss: Above $166.10
✍️ My Thoughts
NVDA is coiling just under a heavy GEX resistance wall. If $165 can't break, downside correction to $161–$158 is probable. GEX suggests sellers may be in control unless bulls force a gamma squeeze over $165. Stay patient — let the levels react.
This breakdown is for educational purposes only and not financial advice. Always manage your risk.

GRAB : They grab your moneyHello
Fine ?
Me no and yes, or ?
What is Grab ? = Like UBER but in ASIA.
Let's go to ATH, Probably.
Enter when the actual consolidation is destroy by the up in weekly.
Don't be greedy. Stay patient.

GME Potential UpsideGME looks attractive from a risk to reward perspective. I am not interested in the short squeeze speculation but the technicals and recent acquisition of BTC in their balance sheet has caught my attention as they have been sitting on capital for quite some time now.
Theres a clear gap around 28.50 and of course looming tarrifs are something to look out for. Id keep my eye on this one.

META | Accumulation Zone Identified — Road to $990?🧠 META | Accumulation Zone Identified — Road to $990?
📊 Ticker: META (Meta Platforms Inc.)
🕒 Timeframe: 1H
📍 Current Price: $717.36
📈 Bias: Bullish accumulation → Expansion
🔍 WaverVanir DSS Thesis
Our system has flagged a liquidity harvesting and accumulation phase between $676–$740. Institutional behavior suggests price is returning to equilibrium before a potential reaccumulation and markup.
🔑 Key SMC Zones:
🔺 Premium Zone: $729–$740 — recent rejection + liquidity engineered
🔻 Discount Zone: $676–$696 — ideal accumulation range
🔵 Equilibrium Pivot: ~$705
🟦 Volume Cluster: $716–$718 → short-term magnet and likely chop area
📐 Fibonacci Confluence:
0.786 Fib = $729.37 (converging with premium zone)
1.272–1.618 extensions → Targets = $870, $990+
0.618 retracement = $676.60 — deep discount level
🚨 VolanX Execution Logic:
Wait for sweep + displacement below $700
Watch for internal BOS + higher low formation
Confirmed entry above $729 = breakout of accumulation
Scale-out zone: $870 → $990+
🧬 Trade Strategy:
Leg Action Level Risk
A Accumulate $680–$705 Low
B Confirm Break $729+ Medium
C Profit Zone $870 / $990 High reward
⚡ Alpha Outlook: META is in a controlled markup with engineered pullbacks. This is where narratives shift, and the smart money loads. VolanX signals strong alignment with SMC zones — this may be a high-conviction multileg long.
#WaverVanir #VolanX #META #SmartMoney #TradingAlpha #SMC #Accumulation #Gamma #OptionsFlow #LSTM #DSS #AITrading #TechStocks #GrowthEquity #Fibonacci #TradingView

GOOGL Eyeing a Gamma Launch Above $182. for July 14🔹 GEX Options Sentiment Analysis
* Gamma Resistance Zone:
The $180 level marks the highest positive Net GEX / Call Wall, making it a magnet and potential resistance for GOOGL.
Above that:
* $182.5 = 2nd Call Wall
* $185 = 3rd Call Wall
* $186.43 is the extreme call zone from GEX
* Put Walls (Support):
* $172.5 = 2nd Put Wall
* $167.5 = HVL
* $165 = 3rd Put Wall
* IVR & Call/Put Sentiment:
* IVR = 38.4 → moderate implied volatility ranking
* IVX avg = 42
* GEX Score = 🟢🟢🟢 (bullish bias)
* CALLs flow = 26.5% net positive
🔸 Implication:
With price above $180 gamma wall and still pushing into $182.5–$185 range, GOOGL is positioned for a potential gamma squeeze, especially if volume supports a move over $182.5.
💡 Options Trade Suggestion Based on GEX
Bullish Scenario:
* 📈 GOOGL 182.5C 07/19 or 07/26
* Entry: On break and hold above $181.50
* Target: $185–$186.5
* Stop: Below $179.50
* Reason: Riding gamma squeeze above the GEX resistance wall with strong call flow and IV breakout potential.
Bearish Rejection Scenario (if false breakout):
* 📉 GOOGL 175P 07/26
* Entry: If price rejects $182.5 and breaks below $179
* Target: $174 → $172.5
* Stop: Above $181.20
📊 1H Chart Analysis (SMC Price Action)
* Market Structure:
* Clean Break of Structure (BOS) confirmed above previous highs.
* Price is currently consolidating inside a bearish OB between $180–$181.40.
* Key Levels:
* Support: $178.8 / $177.6
* Demand Zone: $174.65 → $172.79
* Resistance: $182.5 → $185 zone
* Bias: Bullish (as long as price holds above $177.6)
* Trendline: Still being respected, with CHoCH flip bullish.
📍 Trade Setup Based on 1H Chart
Scalping Intraday Long Setup:
* Long above $181.40 (breakout from OB)
* Target: $182.5 → $185
* Stop: Below $179.80
Intraday Short Setup (if rejected):
* Short below $179
* Target: $177.6 → $174.6
* Stop: Above $181.25
🧠 Final Thoughts
GOOGL looks ripe for continuation as long as price remains above the $180 GEX wall. However, failure to clear $182.5 could invite profit-taking. Watch volume into open and how it behaves near the order block range.
Disclaimer: This analysis is for educational purposes only and not financial advice. Trade your plan, manage your risk, and stay adaptive to market conditions.

$7.73 to $76.00 in 1 day! Another 800% runner $INKTAGAIN? Another 800% runner in a day? 🚀 Such massive moves became a daily thing these days? 😲 NASDAQ:INKT
Can't wait to see new one in the morning!

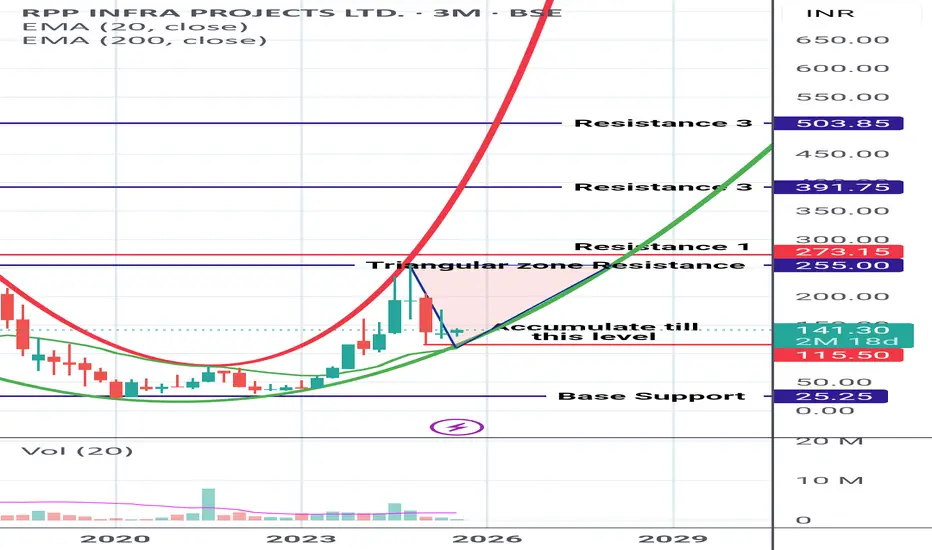
RPP INFRA (Early Birds PreyRPP INFRA
In Parabolic uptrend pattern.
Currently trading in Triangular zone. On closing above the triangular marked zone, Good rally can be expected
Shared it for Reference purpose based on chart pattern.
GOOG - Possible Break OutHello Everyone,
Happy Sunday to All.
I would like to make a quick Analyse on GOOG. When i was scanning the stocks,i reliazed that this could be a possible breakout and could be a opportunity to buy.
This looks like a breakout and i am expecting to Re-test trend line which price level 175 $.
Then first target is 190-192 which is approx %8 - 10 above from 175.
If it will restest and hit the 175 , this could be good entry point.
If not then first target is 190-192 which is approx %5 above current price level.
Long Term , of course Google is Google no doubt to jump in every price points :)
For me, short term i would wait 175 and put my order to that price , then wait for next moves.
This is just my thinking and it is not invesment suggestion , please do not make any decision with my anaylsis.
Have a lovely Sunday and good start a Week

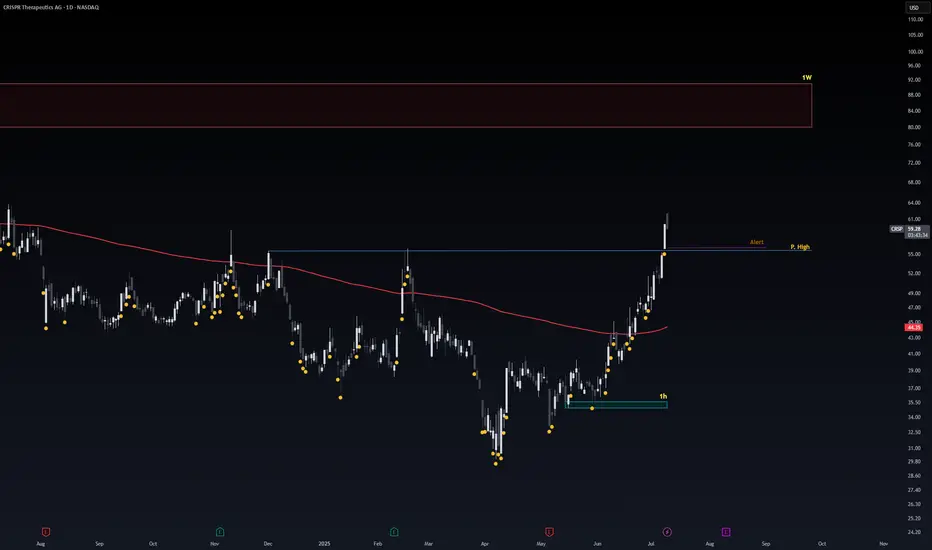
Safe Entry Zone CRSPPrice will Re-test Blue Line.
Blue Line act As Strong Support level now.
Note: 1- Potentional of Strong Buying Zone:
We have two scenarios must happen at The Mentioned Zone:
Scenarios One: strong buying volume with reversal Candle.
Scenarios Two: Fake Break-Out of The Buying Zone.
Both indicate buyers stepping in strongly. NEVER Join in unless one showed up.
2- How to Buy Stock (safe way):
On 1H TF when Marubozu/Doji Candle show up which indicate strong buyers stepping-in.
Buy on 0.5 Fibo Level of the Marubozu/Doji Candle, because price will always and always re-test the
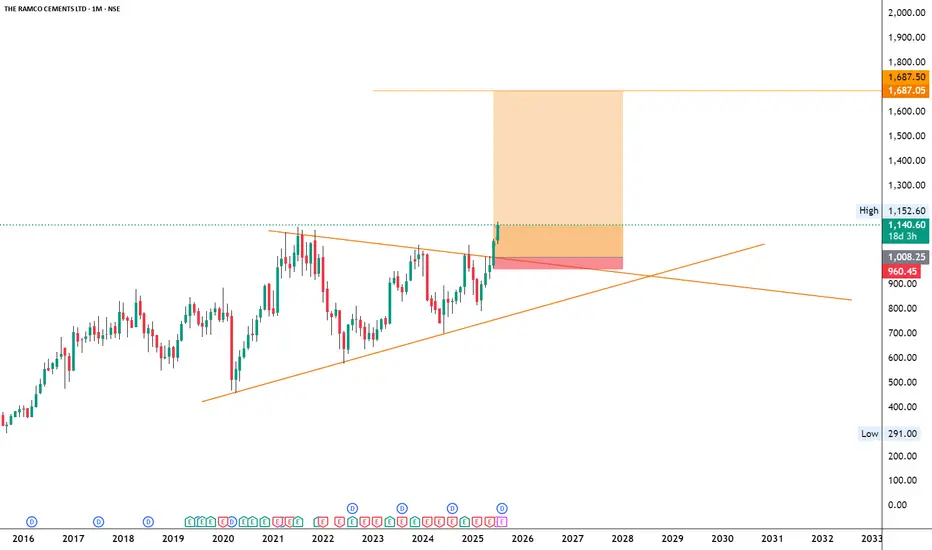
RAMCOCEM
NSE:RAMCOCEM
Note :
1. One should go long with a Stop Loss, below the Trendline or the Previous Swing Low.
2. Risk :Reward ratio should be minimum 1:2.
3. Plan your trade as per the Money Mangement and Risk Appetite.
Disclamier :
>You are responsible for your profits and loss.
>The idea shared here is purely for Educational purpose.
>Follow back, for more ideas and their notifications on your email.
>Support and Like incase the idea works for you.