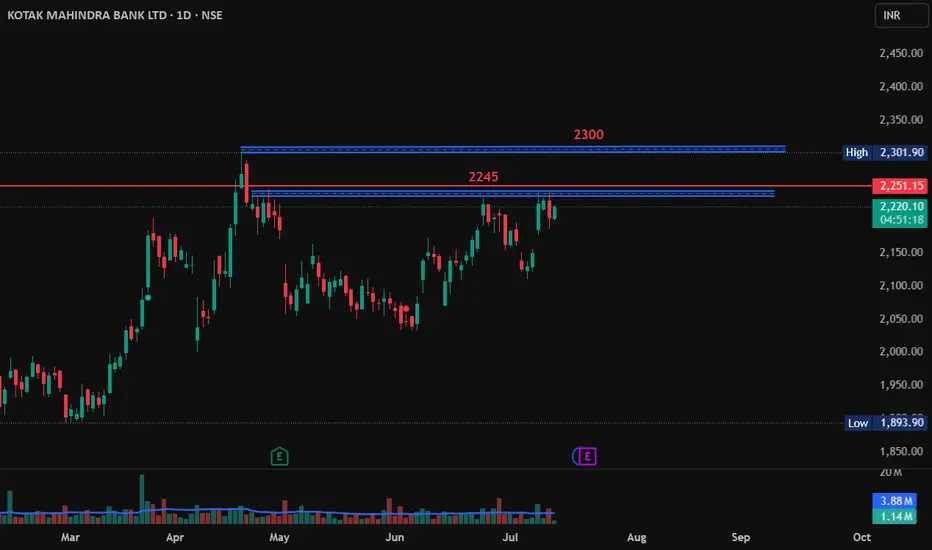
Kotak Mahindra Bank Long Positional ViewKotak Mahindra Bank is breaks 2245 and close above 2250 then it may go long till 2300 from here.
Buy above 2250
Target 2300
SL - 2230
Hindustan Unilever Long TargetHindustan Unilever has broke its resistance at 2440 and blasted 90 points. If it sustains 2500 levels then chances of it reach 2600 is pretty high.
So, if it sustains 2500 and close above 2500 then go long.
Target - 2600
SL - 2490

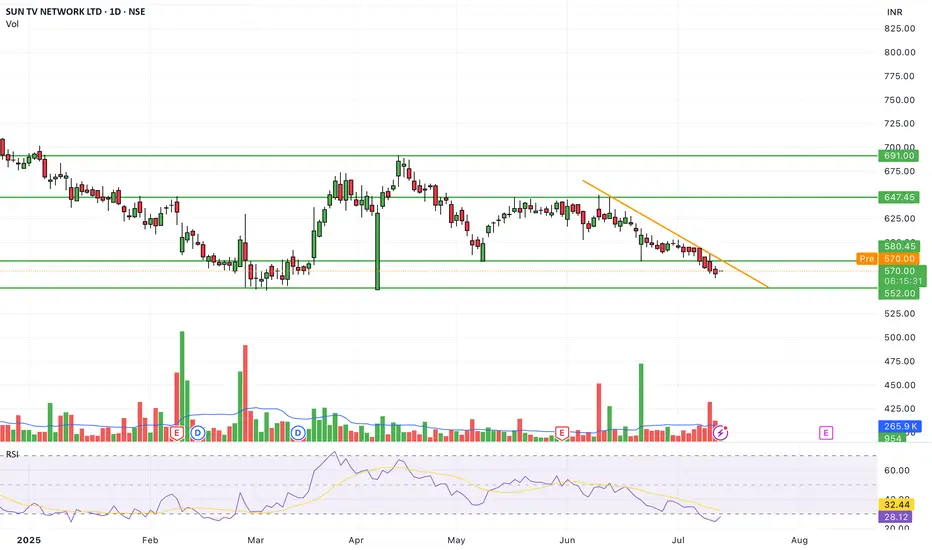
Balrampur Chini: Eyeing All-Time High! 🚀 Balrampur Chini: Eyeing All-Time High! 🚀
📉 CMP: ₹619
🔒 Stop Loss: ₹575
🎯 Target: ₹700
🔍 Why Balrampur Chini Looks Promising?
✅ Technical Strength: Trading above 61.8% Fibonacci level post-correction, indicating strong support
✅ Consolidation Base: Tight range between ₹615–₹580 signals accumulation before a potential breakout
✅ Upside Potential: Breakout from current range could take the stock to all-time high levels
💡 Strategy & Risk Management:
📈 Staggered Entry: Accumulate in phases as the market remains sideways; avoid expecting sharp moves
🔒 Strict SL: Maintain stop loss at ₹575 to manage risk effectively
📍 Outlook: Strong base formation with Fibonacci support makes Balrampur Chini an attractive swing opportunity towards ₹700.
📉 Disclaimer: Not SEBI-registered. Please do your own research or consult a financial advisor before investing.
#BalrampurChini #SugarStocks #TechnicalAnalysis #BreakoutTrade #SwingTrading #StockMarketIndia #InvestmentOpportunities

#hindcopper bouncing from demand zone1)price in 75 min demand zone and demand zone is confirmed with high volume zone if we take swing from 242 to 286
2)Price rejected from 61.8 retracement level
3)Price crossing above 21 dema
4)RSI trendline breakout in 75 min timeframe
5)stock already outperforming nifty

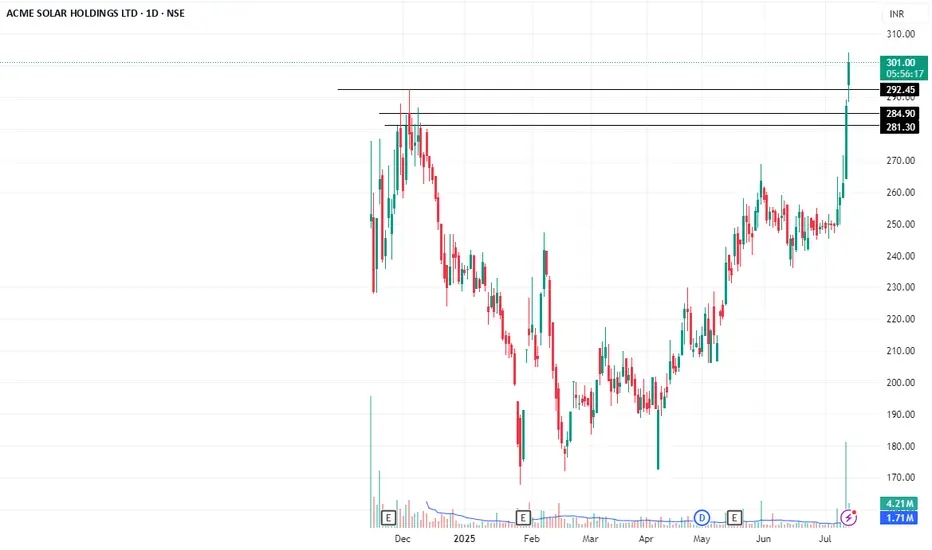
ACME SOLAR BREAKING ALL TIME HIGHAcme solar breaking its all time high for the first time also its IPO opening price.
one can go long with the stop of 275
target is 380 .
Breaking Long term trendlineMuthoot Capital service is all set to breaking out of long term trend line as marked and was not performing during covid where all of the stocks made all time highs. Now its time for muthoot capital services to return 100% in next 2-3 year time frame.

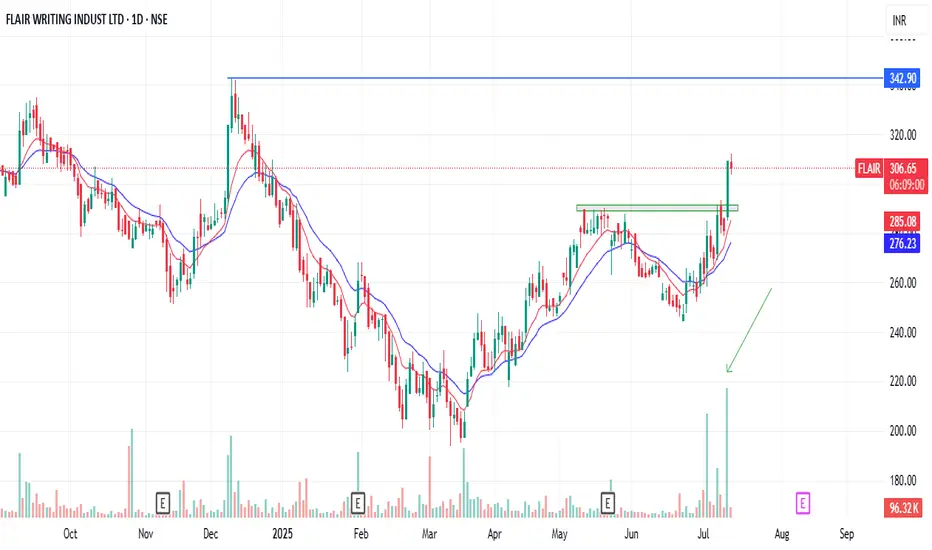
Strong Breakout in Flair writing industriesStrong Breakout in Flair writing industries with strong volume
LUNR: It's time to run!LUNR: It's time to run!
Wait n see!
"The market offers endless opportunities, but your capital is limited — safeguard it wisely."
.
US STOCKS- WALL STREET DREAM- LET'S THE MARKET SPEAK!

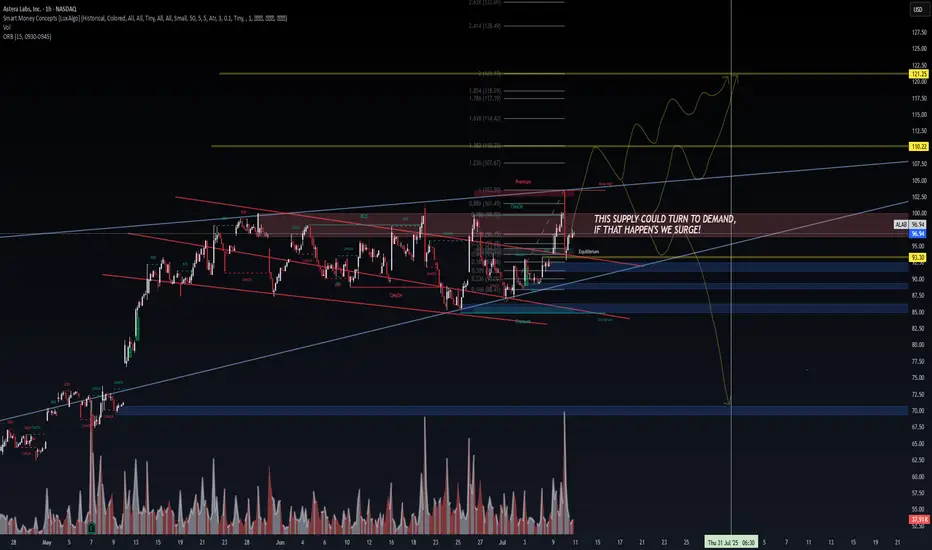
ALAB | Smart Money Compression → Breakout Threat🔭 ALAB | Smart Money Compression → Breakout Threat
Posted by: VolanX Quant Systems | July 10, 2025
We're at a critical inflection point on $ALAB.
The previous supply zone (highlighted in red) is under pressure — one more CHoCH + BOS and it may flip to DEMAND. If that happens, we don’t trickle...
We surge.
🧠 VolanX DSS Notes:
SMC Structure: Multiple CHoCHs + recent BOS confirm internal strength
Volume spike confirms interest at this price level
0.886 Fib rejection zone tagged @ ~$101.49
Equilibrium sits near $95 — ideal backtest zone
Bullish path = target range $110.22 → $122.50
Bearish scenario only resumes below $93.30, where supply holds and volume fades
“This supply could turn to demand — if that happens, we surge!”
🛠️ Risk Layering:
Entry: $96.50–$97.00
Risk: Close below $93.30 invalidates thesis
Reward: Multi-leg rally toward golden pocket + extended fibs
📉 If demand fails to hold, expect retracement into deep discount zones between $72–$77.
🧬 LSTM-backed directional bias: UP (70% confidence)
📊 Options flow is light but positive risk sentiment observed
#SmartMoneyConcepts #ALAB #VolanX #OrderBlock #CHoCH #BreakOfStructure #QuantTrading #SupplyDemand #FibonacciLevels #LSTM #LiquidityZones #WaveAnalysis #TradingView #InstitutionalFlow #DSS
buying zone Look for areas where the price has stalled or reversed: Supply and demand zones occur where there has been a concentration of buying or selling pressure, causing the price to stall or reverse. Look for areas on the chart where the price has struggled to move higher or lower, indicating potential supply or demand zones
Stablecoins, a huge piece of cake to be distributedThe core of stablecoins lies in payment and opening up channels for sovereign currencies to communicate with the US dollar. In other words, whoever can gain an advantage in the field of payment and exchange in the future will be the biggest winner.
CIRCLE has the advantage of first-mover speculation, which is why NYSE:CRCL can soar 300%+ in the secondary market, but the current profit model of USDC is basically only the US dollar interest. In the future, the income will shrink significantly after the Fed cuts interest rates. The market will start to think after calming down.
Market transactions are always based on expectations, not the present. Can USDC dominate the world in the future? I don’t think so. The first obstacle is USDT, which goes without saying. Second, as the entrance to traffic, Binance and TRX have already stood on the side of Trump’s family’s USD1. Grabbing the market through political power is at least very effective during Trump’s term. Third, many sovereign countries around the world are also issuing stablecoins anchored to the US dollar. It is unknown who will win.
If it is short-term speculation, then any target can be traded. For value investment, CRCL faces many challenges and needs to take one step at a time. Heavy gambling is not my trading style.
I will add more views on stablecoins later.

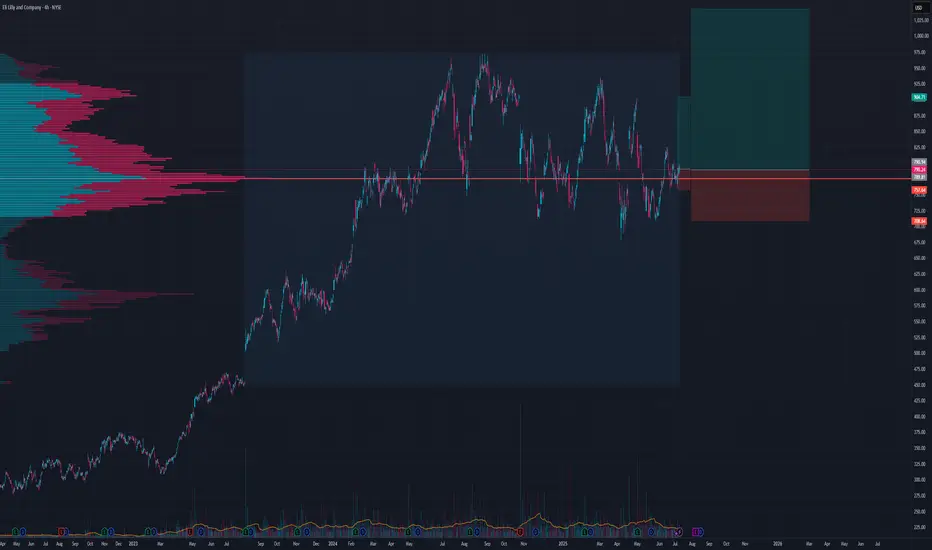
Long Healthcare and BiotechI think we will go for all time highs soon
TP 1 over 900
Got 2 stop losses on chart depending on time horizon and risk apatite
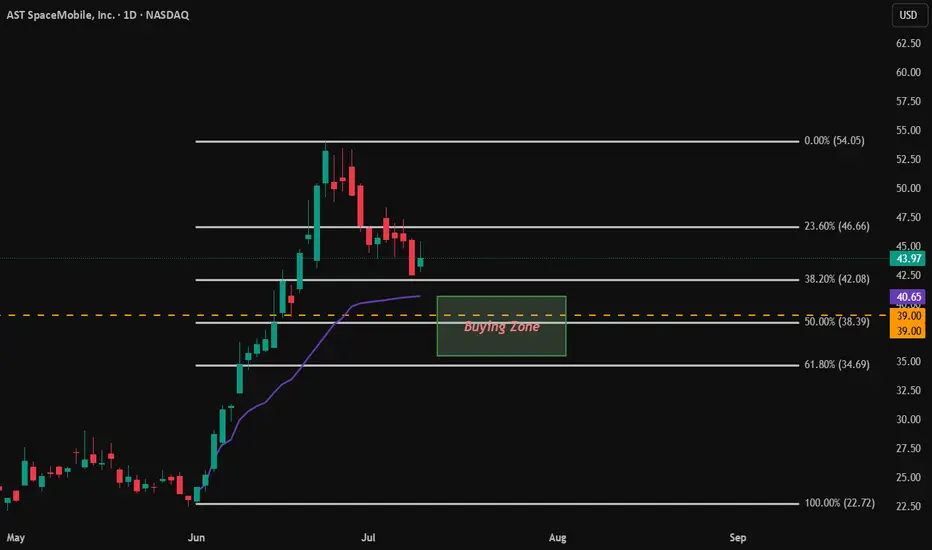
$ASTS Buying the dip. [Long]
Previous bull runs with 50.0% - 61.8% retracements each time.
Stock is still overvalued.
RSI on weekly and monthly confirm this.
50 SMA is still above 200 SMA, and better retracement will be healthy for a stronger bull run continuation.
Buying Zone: $35.50 - $40.65.
Key Levels and points of interest.
Wave 2 completion at 50%-61.8% retracement. This would place Wave 3 around a target range of $85 or higher.
$55-$57 range is around 45% increase from Wave 2 retracement. This happened during the second run and form a H&S pattern. We want our next run up to pass this $55-57 level.
This isn't intended for financial advice, merely personal analysis.
$JD | Potential long setupPotential reversal at the .618
If we just K.I.S.S. we might just get lucky.. at least that’s the idea! Right..??
Trade idea:
Potential long scenario playing out that is worth the shot for me, with proper risk management of course. For discussion purposes this is a very small trade in my portfolio, <1/2% of overall portfolio..
Trade:
I have drawn a Fibonacci from the wick low of ~$20.87 to the wick high of ~$46.81 on the monthly candle chart and you can see that the price is currently trading at the .618 fib. I have taken a trade at this level in anticipation of a reversal, which may or may not occur. There are tons of trades out there like the one I have mentioned, you don’t have to be right all of the time or even a majority of the time, you just have to know how to manage risk and take losses/profits at the right time.
Trade parameters:
Buy at the .618 fib or current market price: $31.22
Risk/Reward: 1:7.31🤑
(Risk 14% for potential 108%)
SL @ next fib zone .786: $26.69
For profit zones I have ran a fib from the top @ $108.44 to the bottom at $20.87 and will be using the fib zones as TP zones. The 3 different zones are listed below:
TP1: .236 fib @ ~$41.33 (~32%)
TP2: .382 fib @ ~$54.16 (~73%)
TP3: .50 fib @ ~$64.43 (~106%)
Estimated time frame for all 3 targets to be hit: 1-3 years
It is best to come up with a strategy before hand as to how much you plan to take at each level. For me, I plan on selling 1/4 at the first zone, 1/2 of what’s remaining at the next zone and then the rest at the final zone (may let a share or 2 ride for fun). Whether or not any of these zones are hit is obviously all up to the stock and whether it cooperates with my thesis! I chose to post this trade because I like the risk/reward opportunity here. If anyone has any opinions, would love to hear them!
Thanks and HaPpY tRaDiNg!
NOT FINANCIAL ADVICE!!!

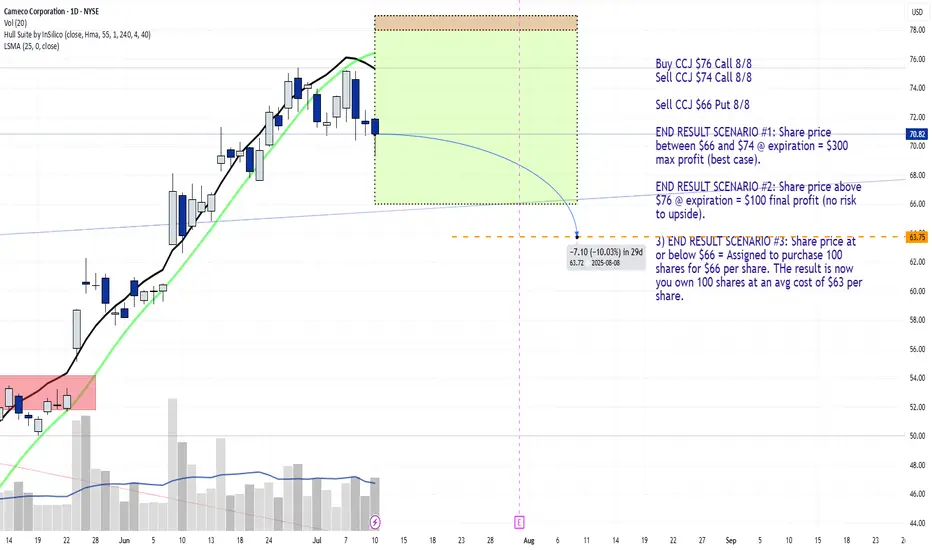
JADE LIZARD TRADE for 8/8 ExpirationNYSE:CCJ JL
Buy CCJ $76 Call 8/8
Sell CCJ $74 Call 8/8
Sell CCJ $66 Put 8/8
END RESULT SCENARIO #1: Share price between $66 and $74 @ expiration = $300 max profit (best case scenario).
END RESULT SCENARIO #2: Share price above $76 @ expiration = $100 final profit (no risk to upside).
3) END RESULT SCENARIO #3: Share price at or below $66 = Assigned to purchase 100 shares for $66 per share. THe result is now you own 100 shares at an avg cost of $63 per share.
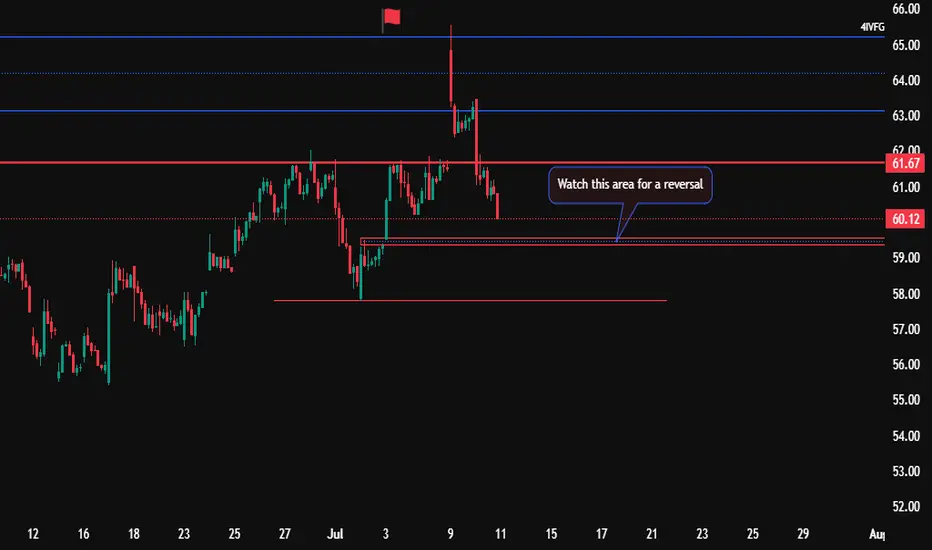
DOCS Potential ReversalWatching DOCS finally broke through 61 ish, coming back to fill the gap around 59.50.
Once it gets there and it will. Be waiting on my reversal pattern on lower time frame. Take 1-1 on the lower tfs. See if it breaks above or wants to go lower. Tight SLS until reversal confirmed on the 15. Take your 1-1s, get paid.
Oxford Industries | OXM | Long at $38.10Oxford Industries NYSE:OXM is an apparel company that designs, sources, markets, and distributes lifestyle brands like Tommy Bahama, Lilly Pulitzer, and Southern Tide. While I am not super bullish on the retail sector given the blaring recession signals, I also don't think this is the end of life as we know it... the anticipated downside is already priced-in for many retail brands.
From a technical analysis perspective, NYSE:OXM has entered my "crash" simple moving average zone. Typically, but not always, this is an area where value investors accumulate shares in anticipation of a future rise in share price. While the price is likely to dip near $28-$30 in the near-term, the last open price gap on the daily chart since the COVID-19 pandemic was closed today. Also, last week, an NYSE:OXM Officer and the CEO bought just over $600,000 in shares near $40 and the stock is currently trading at book value.
Fundamentals:
P/E = 7.4x (apparel sector average = 22.4x)
Forward P/E = 11.4x
Dividend = 7.25%
Debt-to-equity = .2x (healthy)
Regardless of some strong fundamentals, persistent macro volatility, consumer caution, and tariff pressures may delay recovery. Analysts expect flat to declining sales in 2025, with limited organic growth. Like I mentioned above, while there is likely short-term pain here, the fundamentals are there to potentially weather the storm.
Thus, at $38.10, NYSE:OXM is in a personal buy zone with the further decline between $28-$30 likely (where additional share accumulation will occur as long as the fundamentals do not change).
Targets into 2027
$45.00 (+18.0%)
$50.00 (+31.2%)

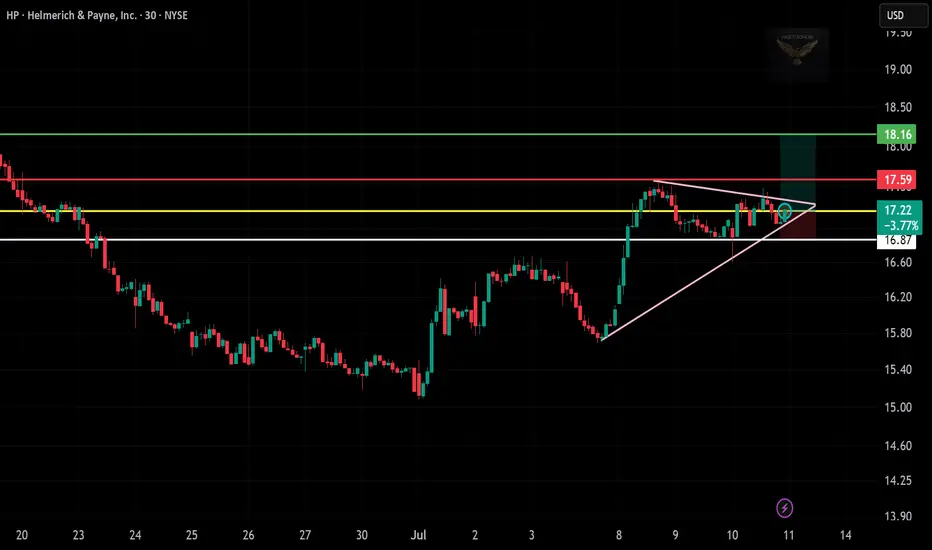
HP Trade Update – July 11, 2025🟢
HP has broken out of a tight symmetrical triangle after consolidating for nearly two days.
📍 Entry activated at $17.22, as price pushed above wedge resistance with bullish confirmation.
🎯 Targets are clear: $17.59 (first zone), $18.16 (extended level).
🛡️ Stop-loss positioned below $16.87 to protect the structure.
Volume is still building, but trendline support remains intact — a solid setup for breakout continuation. Watching closely for follow-through and buyer strength into next session.
🔍 Strategy: Symmetrical Triangle Breakout
📊 Sentiment: Bullish & Active
🗓️ Trade live — price holding breakout level.
COIN Trade Update – July 11, 2025🚀
COIN is climbing with strength, pushing higher inside a rising wedge formation.
Price action is tight but bullish — buyers defending trendline support beautifully.
📍 Entry activated at $388.97 after confirmation near wedge resistance.
🎯 Targets locked in: $393.55 and $399.60
🛡️ Risk managed with stop below $383.00 — structure still intact.
This is a classic breakout anticipation setup with momentum building. Watching closely for volume surge and resistance break. Trade active — bias remains bullish.
🔍 Strategy: Rising Wedge + Breakout Continuation
📊 Sentiment: Bullish Cautious
📅 Holding through the session — price near key breakout level.

PLTR Trade Update – July 11, 2025📅
PLTR held the breakout like a champ. ✅ After a clean move through the triangle resistance yesterday, today’s price action continues to build strength above $142.50.
🔼 Bulls are in control, riding the momentum with higher lows and tight consolidation near breakout levels.
🎯 Targets remain firm at $144.05 and $146.04.
🛡️ Stop-loss still protected below $139.76 — trade remains active and technically strong.
The structure is bullish, volume supports the trend, and PLTR could be gearing up for the next leg higher. Watching closely for a push into resistance zones.
🔍 Strategy: Breakout Continuation
📊 Sentiment: Bullish & Confident
💡 Holding long — eyes on the volume and breakout follow-through.

Nothing changes while price is below 8.01CYBN continues to reject form 4hr EMA12, bulls need to break above this in the next few trading sessions or it will continue to decline and knock the price below support, which would be a big step backwards and would be a clear signal that CYBN is not enjoying the same series of bullish signals that ATAI and MNMD are giving

MNMD closes just below resistanceMNMD with a very bullish close knocking on the door of double-top weekly resistance at 8.21. Hourly RSI cooled off after hours and bulls want to break this level first thing tomorrow and see clear followthrough for continuation.

CMPS Bulls Keeping Control of 4hr UptrendThe 4hr uptrend is our guide on CMPS as it sets a series of higher lows riding EMAs as support. Eventually we will lose the 4hr uptrend, signalling that daily consolidation is underway. Having bounced 70% from the fear dump low, we are anticipating a daily higher low above 2.25 and the size of that pullback will let us know the likelihood of continuation vs a need to chop around in equilibrium while the market finds a new balance.
4hr RSI just touched 70 today for the first time since the dump.
