NYSE:DT (Dynatrace) local stop on its way to 60$+Since April 2025, Dynatrace has established a local uptrend. Based on the daily chart, the recent drop below $53 appears to have fulfilled one of the likely targets for wave iv. This may represent wave iv of a five-wave impulse originating from the April low. If correct, wave v is expected to push above the high of wave iii.
There are two potential trade setups:
Trade 1: Entry at the current price (~$53.00), with a stop-loss at $52.34.
Trade 2: Entry at $51.54, with a final stop-loss at $48.89. This entry level is supported by a price gap and Fibonacci retracement zone, making it technically stronger.
In both cases, the initial target is $57.55. A potential resistance zone lies above $60.70, based on prior selling activity.


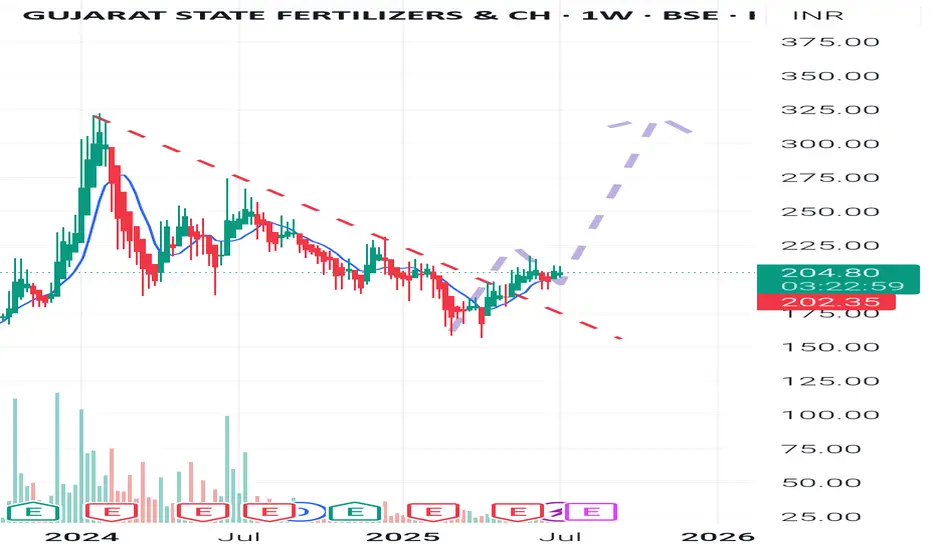
GSFC weekly insightAfter the weekly downtrend breakout and retest the support area .Now ready for another big leg up ......
Don't chase .Travel in it....🙂🙂🙂
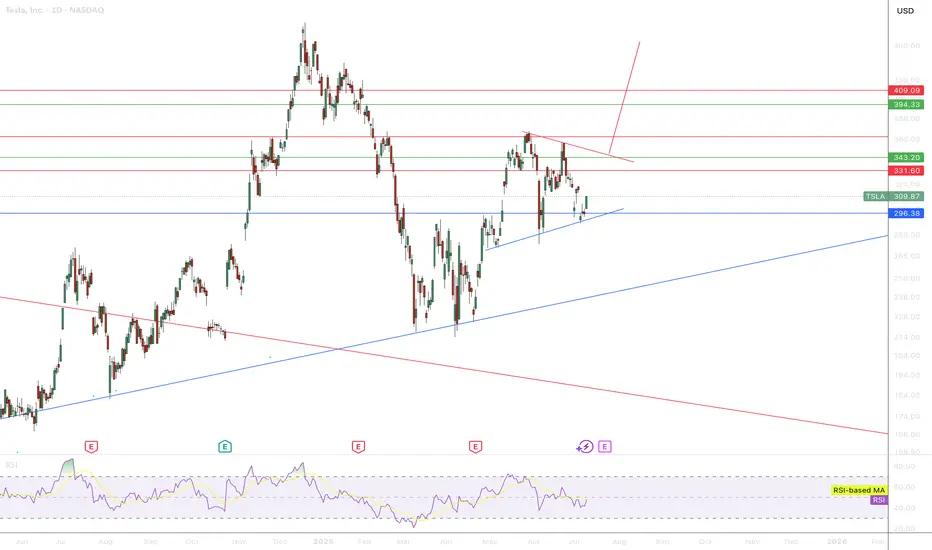
Triangle Pattern in TSLALooking at 4H-1D Chart, there is a triangle pattern emerging which may target 400 area. Good luck.
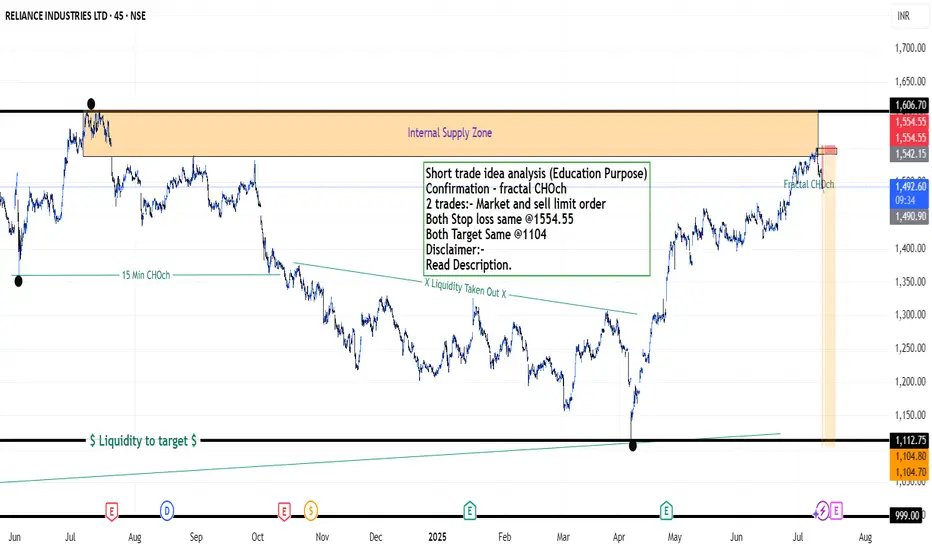
Reliance Industries Stock(India) - {11/07/2025}Educational Analysis says that Reliance Industries (Indian Stock) may give trend Trading opportunities from this range, according to my technical analysis.
Broker - NA
So, my analysis is based on a top-down approach from weekly to trend range to internal trend range.
So my analysis comprises of two structures: 1) Break of structure on weekly range and 2) Trading Range to fill the remaining fair value gap
Let's see what this Stock brings to the table for us in the future.
DISCLAIMER:-
This is not an entry signal. THIS IS FOR EDUCATIONAL PURPOSES ONLY.
I HAVE NO CONCERNS WITH YOUR PROFITS OR LOSS,
Happy Trading,
Stocks & Commodities TradeAnalysis.
My Analysis is:-
Short term trend may be go to the external demand zone.
Long term trend breaks the new high after going from discount zone.
Short trade idea analysis (Education Purpose)
Confirmation - fractal CHOch
2 trades:- Market and sell limit order
Both Stop loss same @1554.55
Both Target Same @1104
Please check the comment section to see how this turned out.
Can Strategic Minerals Transform National Security?MP Materials has experienced a significant market revaluation, with its stock surging over 50% following a pivotal public-private partnership with the U.S. Department of Defense (DoD). This multi-billion-dollar agreement, which includes a $400 million equity investment, substantial additional funding, and a $150 million loan, aims to rapidly establish a robust, end-to-end U.S. rare earth magnet supply chain. This strategic collaboration is designed to curtail the nation's reliance on foreign sources for these critical materials, which are indispensable for advanced technology systems across both defense and commercial applications, from F-35 fighter jets to electric vehicles.
The partnership underscores a profound geopolitical imperative: countering China's near-monopoly over the global rare earth supply chain. China dominates rare earth mining, refining, and magnet production, a leverage it has demonstrably used through export restrictions amidst escalating trade tensions with the U.S. These actions highlighted acute U.S. vulnerabilities and the imperative for domestic independence, propelling the DoD's "mine to magnet" strategy aimed at achieving self-sufficiency by 2027. The DoD's substantial investment and its new position as MP Materials' largest shareholder signal a decisive shift in U.S. industrial policy, directly challenging China's influence and asserting economic sovereignty in a vital sector.
Central to the deal's financial attractiveness and long-term stability is a 10-year price floor of $110 per kilogram for key rare earths, significantly higher than historical averages. This guarantee not only ensures MP Materials' profitability, even against potential market manipulation, but also de-risks its ambitious expansion plans, including new magnet manufacturing facilities expected to produce 10,000 metric tons annually. This comprehensive financial and demand certainty transforms MP Materials from a commodity producer vulnerable to market whims into a strategic national asset, attracting further private investment and setting a powerful precedent for securing other critical mineral supply chains in the Western Hemisphere.

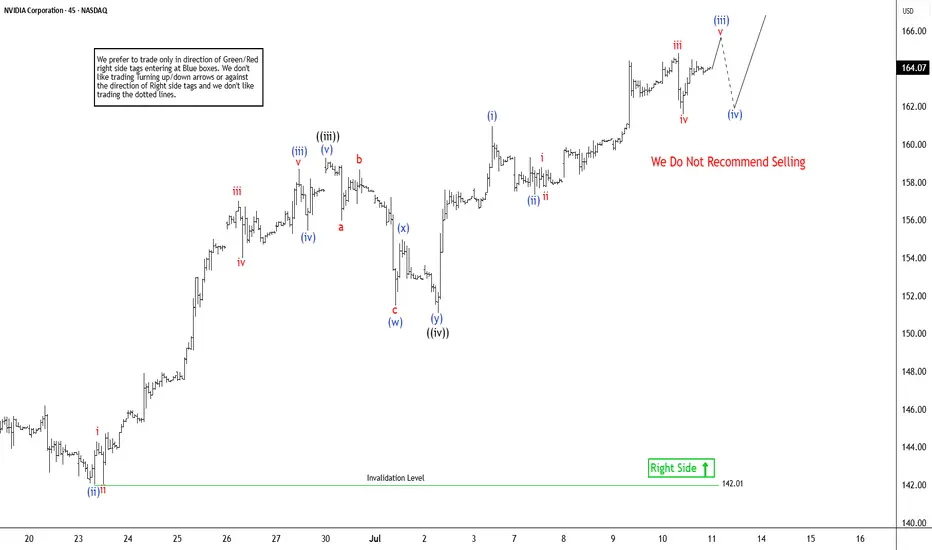
NVIDIA ($NVDA) Elliott Wave Outlook: Larger Pullback on the HoriNvidia (NVDA) continues its remarkable ascent, consistently reaching new all-time highs and reinforcing a robust bullish outlook. The ongoing rally, which began from a significant low on April 7, 2025, remains structured as an impulsive wave pattern, indicative of strong upward momentum. However, despite the potential for further short-term gains, the cycle appears mature. This suggests a larger-degree pullback could be imminent. Investors should exercise caution when considering chasing this rally in shorter time frames, as the risk of a corrective move grows.
In the short term, the cycle initiated from the June 2 low is progressing as a lower-degree impulse. From this low, wave ((i)) peaked at $144, followed by a corrective pullback in wave ((ii)) that concluded at $137.88. The stock then surged in wave ((iii)) to $159.42. The subsequent wave ((iv)) correction unfolded as a double-three structure, with wave (w) ending at $151.49, wave (x) at $154.98, and wave (y) completing at $151.10, finalizing wave ((iv)). Currently, Nvidia is advancing in wave ((v)), exhibiting a five-wave subdivision. Within this, wave (i) of ((v)) reached $160.98, with a minor pullback in wave (ii) concluding at $157.34. As long as the pivotal low at $142.01 holds, any near-term pullbacks are likely to attract buyers in a 3, 7, or 11-swing pattern, supporting further upside potential. This technical setup underscores Nvidia’s strength but highlights the need for prudent risk management.
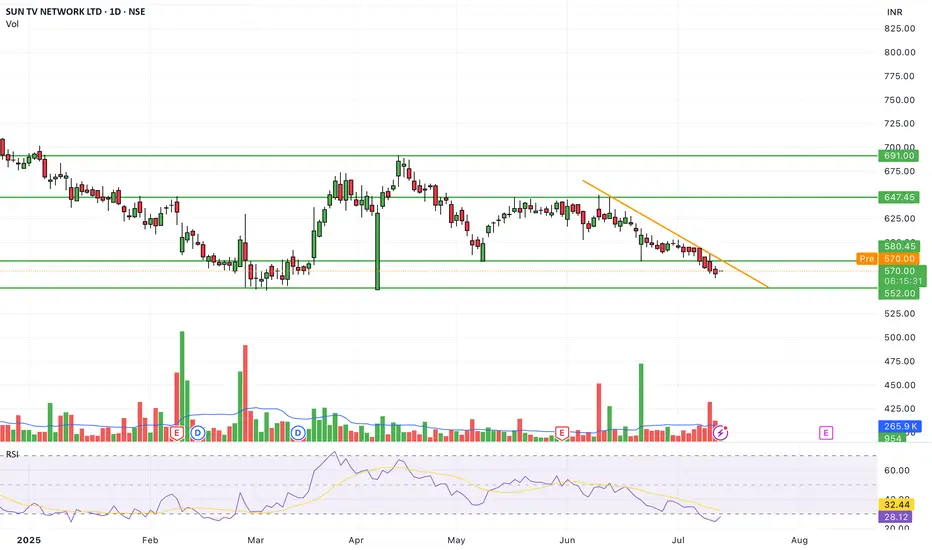
MTL will be caped todayMTL will be capped today, as it has given a breakout of its downtrend falling channel.

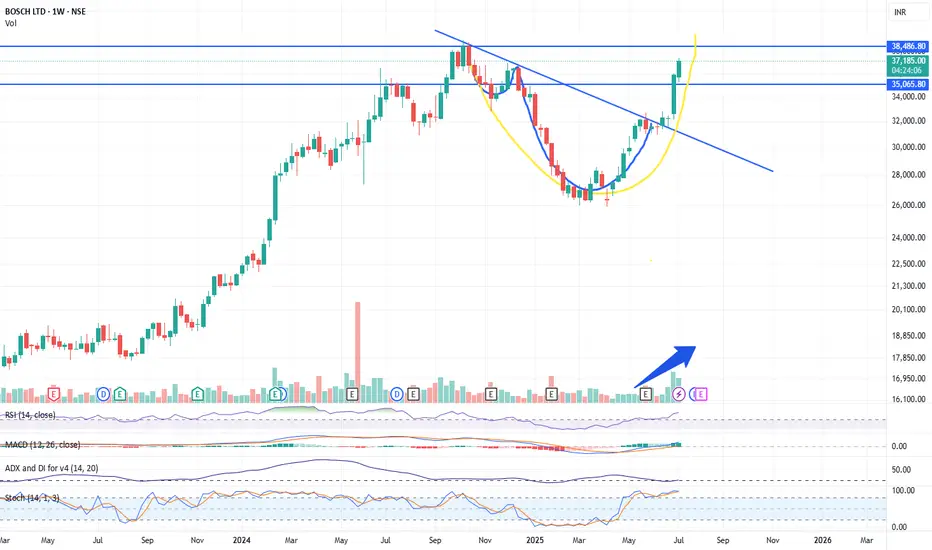
Ye Chart Kuch Kehta Hai - BOSCH LimitedBOSCH Ltd demonstrates a strong bullish setup on the weekly chart, making it a compelling investment for the next few months. The breakout from a cup and handle pattern, supported by volume and momentum indicators, suggests the stock could outperform in the medium term. Consider a 3–6 month investment horizon, with ₹35,000 as a key support and ₹38,500–₹40,000 as the next target zone.
Key Technical Reasons
Cup and Handle Breakout
The chart displays a classic "cup and handle" pattern, a bullish continuation signal. The price has broken out above the handle resistance, suggesting the start of a new upward trend.
Strong Volume Confirmation
The breakout is accompanied by a notable increase in trading volume, which validates the strength of the move and indicates strong buying interest.
Trendline Break
The stock has decisively broken above a long-term descending trendline, signaling a shift from consolidation to a new bullish phase.
Momentum Indicators
RSI (Relative Strength Index): The RSI is above 70, indicating strong bullish momentum. While this can sometimes suggest overbought conditions, in the context of a breakout, it often signals the start of a sustained rally.
MACD: The MACD line is well above the signal line, further confirming bullish momentum.
Stochastic Oscillator: The stochastic is also in the overbought zone, which, during strong trends, can persist for extended periods.
Moving Averages
The price is trading above the 21-week EMA, reinforcing the bullish bias and indicating that the medium-term trend has turned positive.
Clear Resistance and Target Levels
The breakout level near ₹35,065 now acts as a strong support.
The next major resistance and potential target is around ₹38,486, as marked on the chart.
Suggested Investment Time Frame
Medium-Term (3–6 Months):
Given the strength of the breakout and supporting indicators, BOSCH Ltd is well-positioned for further gains over the next 3 to 6 months. The technical pattern suggests a medium-term rally towards the ₹38,500–₹40,000 zone, provided broader market conditions remain supportive.
Ye chart kuch ketha hai - ACME SolarThe combination of a strong uptrend, bullish momentum indicators (RSI, ROC, Supertrend), price action above key moving averages, and positive analyst sentiment all point to a bullish outlook for Acme Solar over the next few months. These technical factors suggest that the stock is likely to continue its upward trajectory unless there is a significant reversal in trend or broader market conditions
Key Bullish Signals from Weekly Chart
Strong Uptrend and Momentum
The weekly chart of Acme Solar shows a sustained uptrend, with the stock delivering positive returns over the last 12 weeks and a 3-month gain of over 49%. This persistent upward movement is a classic sign of bullish momentum.
Technical Indicators Supporting Bullishness
RSI (Relative Strength Index): The weekly RSI is at 74.20, which is in the bullish-to-overbought zone. While high, this level often accompanies strong trends and suggests buyers are in control.
ROC (Rate of Change): The ROC stands at 18.71, indicating strong positive momentum and continued buying interest.
Supertrend: The Supertrend indicator is well above the current price, reinforcing the ongoing bullish trend.
MACD: The MACD is at 0, which is neutral, but other momentum indicators are positive, supporting the bullish outlook.
Stochastic Oscillator: At 45.59, this is in the neutral-to-bullish range, suggesting there is still room for further upside before overbought conditions dominate.
Moving Averages
The stock price is trading above key moving averages (such as 50 DMA and 200 DMA), which is a strong bullish signal and indicates that the medium- to long-term trend remains positive.
Analyst Sentiment
Multiple analysts have issued strong buy recommendations recently, with price targets above current levels, reflecting positive sentiment for the coming months.

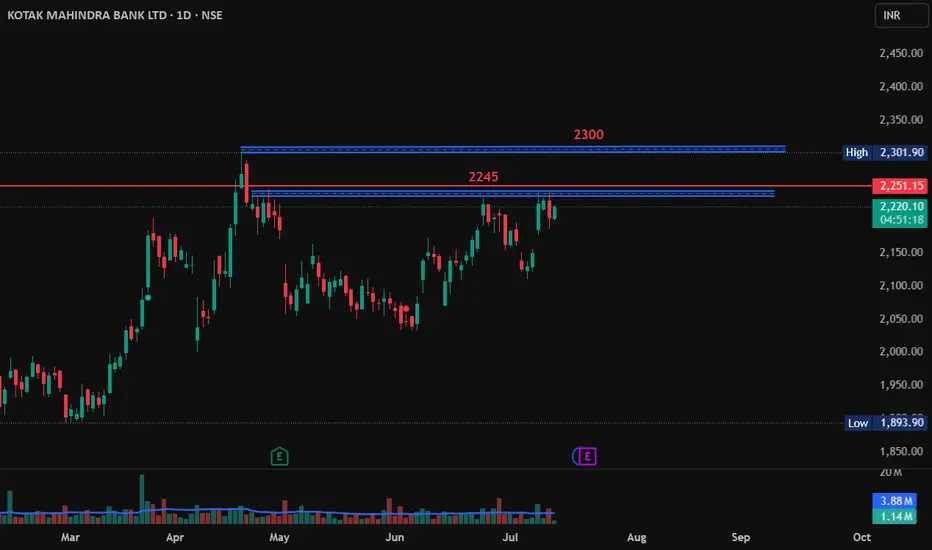
Kotak Mahindra Bank Long Positional ViewKotak Mahindra Bank is breaks 2245 and close above 2250 then it may go long till 2300 from here.
Buy above 2250
Target 2300
SL - 2230
Hindustan Unilever Long TargetHindustan Unilever has broke its resistance at 2440 and blasted 90 points. If it sustains 2500 levels then chances of it reach 2600 is pretty high.
So, if it sustains 2500 and close above 2500 then go long.
Target - 2600
SL - 2490

Balrampur Chini: Eyeing All-Time High! 🚀 Balrampur Chini: Eyeing All-Time High! 🚀
📉 CMP: ₹619
🔒 Stop Loss: ₹575
🎯 Target: ₹700
🔍 Why Balrampur Chini Looks Promising?
✅ Technical Strength: Trading above 61.8% Fibonacci level post-correction, indicating strong support
✅ Consolidation Base: Tight range between ₹615–₹580 signals accumulation before a potential breakout
✅ Upside Potential: Breakout from current range could take the stock to all-time high levels
💡 Strategy & Risk Management:
📈 Staggered Entry: Accumulate in phases as the market remains sideways; avoid expecting sharp moves
🔒 Strict SL: Maintain stop loss at ₹575 to manage risk effectively
📍 Outlook: Strong base formation with Fibonacci support makes Balrampur Chini an attractive swing opportunity towards ₹700.
📉 Disclaimer: Not SEBI-registered. Please do your own research or consult a financial advisor before investing.
#BalrampurChini #SugarStocks #TechnicalAnalysis #BreakoutTrade #SwingTrading #StockMarketIndia #InvestmentOpportunities

#hindcopper bouncing from demand zone1)price in 75 min demand zone and demand zone is confirmed with high volume zone if we take swing from 242 to 286
2)Price rejected from 61.8 retracement level
3)Price crossing above 21 dema
4)RSI trendline breakout in 75 min timeframe
5)stock already outperforming nifty

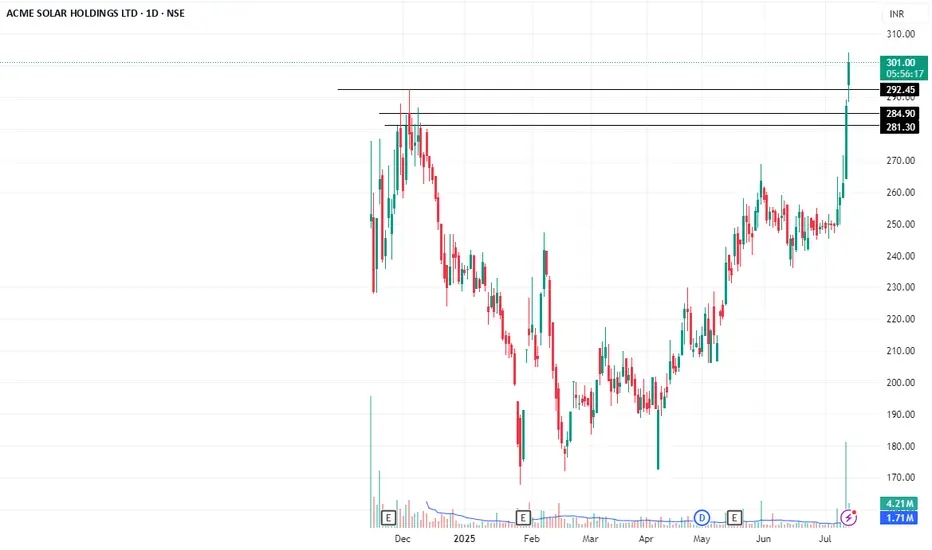
ACME SOLAR BREAKING ALL TIME HIGHAcme solar breaking its all time high for the first time also its IPO opening price.
one can go long with the stop of 275
target is 380 .
Breaking Long term trendlineMuthoot Capital service is all set to breaking out of long term trend line as marked and was not performing during covid where all of the stocks made all time highs. Now its time for muthoot capital services to return 100% in next 2-3 year time frame.

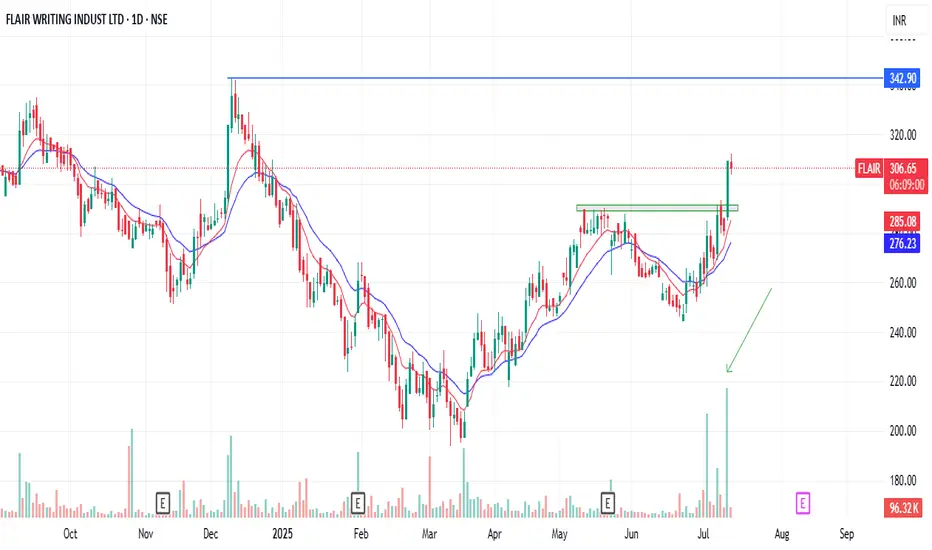
Strong Breakout in Flair writing industriesStrong Breakout in Flair writing industries with strong volume
LUNR: It's time to run!LUNR: It's time to run!
Wait n see!
"The market offers endless opportunities, but your capital is limited — safeguard it wisely."
.
US STOCKS- WALL STREET DREAM- LET'S THE MARKET SPEAK!

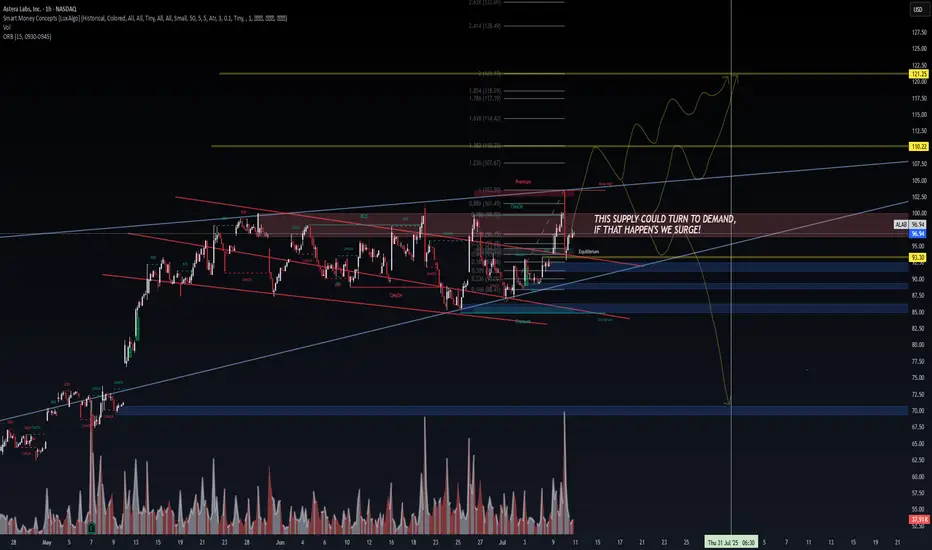
ALAB | Smart Money Compression → Breakout Threat🔭 ALAB | Smart Money Compression → Breakout Threat
Posted by: VolanX Quant Systems | July 10, 2025
We're at a critical inflection point on $ALAB.
The previous supply zone (highlighted in red) is under pressure — one more CHoCH + BOS and it may flip to DEMAND. If that happens, we don’t trickle...
We surge.
🧠 VolanX DSS Notes:
SMC Structure: Multiple CHoCHs + recent BOS confirm internal strength
Volume spike confirms interest at this price level
0.886 Fib rejection zone tagged @ ~$101.49
Equilibrium sits near $95 — ideal backtest zone
Bullish path = target range $110.22 → $122.50
Bearish scenario only resumes below $93.30, where supply holds and volume fades
“This supply could turn to demand — if that happens, we surge!”
🛠️ Risk Layering:
Entry: $96.50–$97.00
Risk: Close below $93.30 invalidates thesis
Reward: Multi-leg rally toward golden pocket + extended fibs
📉 If demand fails to hold, expect retracement into deep discount zones between $72–$77.
🧬 LSTM-backed directional bias: UP (70% confidence)
📊 Options flow is light but positive risk sentiment observed
#SmartMoneyConcepts #ALAB #VolanX #OrderBlock #CHoCH #BreakOfStructure #QuantTrading #SupplyDemand #FibonacciLevels #LSTM #LiquidityZones #WaveAnalysis #TradingView #InstitutionalFlow #DSS
buying zone Look for areas where the price has stalled or reversed: Supply and demand zones occur where there has been a concentration of buying or selling pressure, causing the price to stall or reverse. Look for areas on the chart where the price has struggled to move higher or lower, indicating potential supply or demand zones
Stablecoins, a huge piece of cake to be distributedThe core of stablecoins lies in payment and opening up channels for sovereign currencies to communicate with the US dollar. In other words, whoever can gain an advantage in the field of payment and exchange in the future will be the biggest winner.
CIRCLE has the advantage of first-mover speculation, which is why NYSE:CRCL can soar 300%+ in the secondary market, but the current profit model of USDC is basically only the US dollar interest. In the future, the income will shrink significantly after the Fed cuts interest rates. The market will start to think after calming down.
Market transactions are always based on expectations, not the present. Can USDC dominate the world in the future? I don’t think so. The first obstacle is USDT, which goes without saying. Second, as the entrance to traffic, Binance and TRX have already stood on the side of Trump’s family’s USD1. Grabbing the market through political power is at least very effective during Trump’s term. Third, many sovereign countries around the world are also issuing stablecoins anchored to the US dollar. It is unknown who will win.
If it is short-term speculation, then any target can be traded. For value investment, CRCL faces many challenges and needs to take one step at a time. Heavy gambling is not my trading style.
I will add more views on stablecoins later.

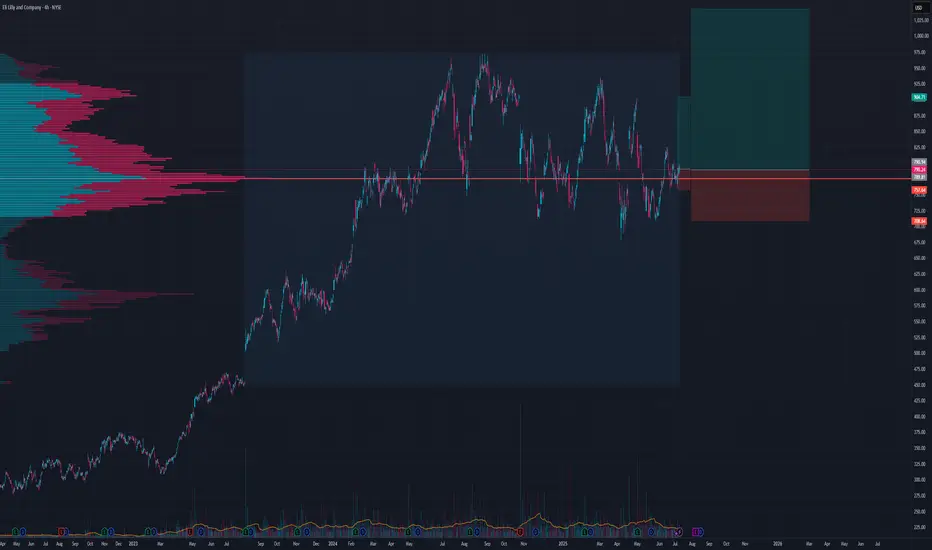
Long Healthcare and BiotechI think we will go for all time highs soon
TP 1 over 900
Got 2 stop losses on chart depending on time horizon and risk apatite
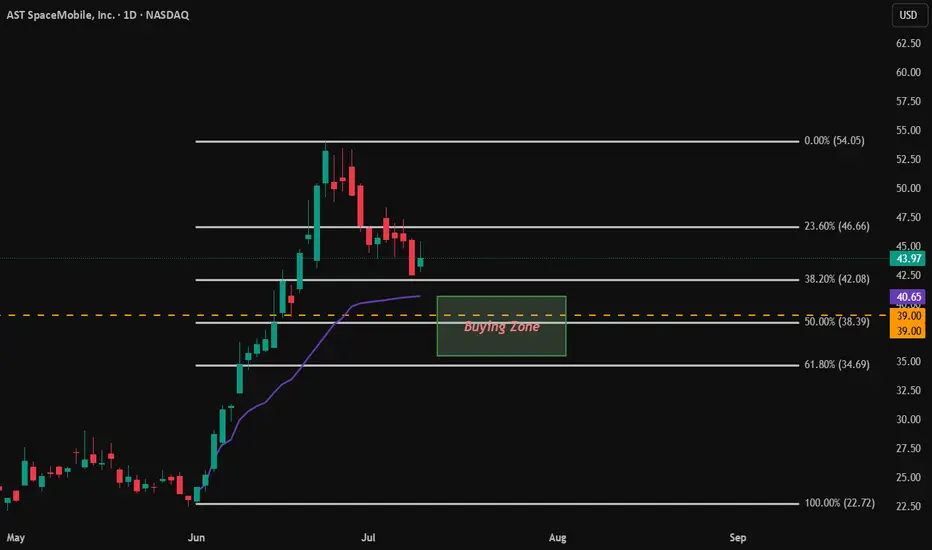
$ASTS Buying the dip. [Long]
Previous bull runs with 50.0% - 61.8% retracements each time.
Stock is still overvalued.
RSI on weekly and monthly confirm this.
50 SMA is still above 200 SMA, and better retracement will be healthy for a stronger bull run continuation.
Buying Zone: $35.50 - $40.65.
Key Levels and points of interest.
Wave 2 completion at 50%-61.8% retracement. This would place Wave 3 around a target range of $85 or higher.
$55-$57 range is around 45% increase from Wave 2 retracement. This happened during the second run and form a H&S pattern. We want our next run up to pass this $55-57 level.
This isn't intended for financial advice, merely personal analysis.