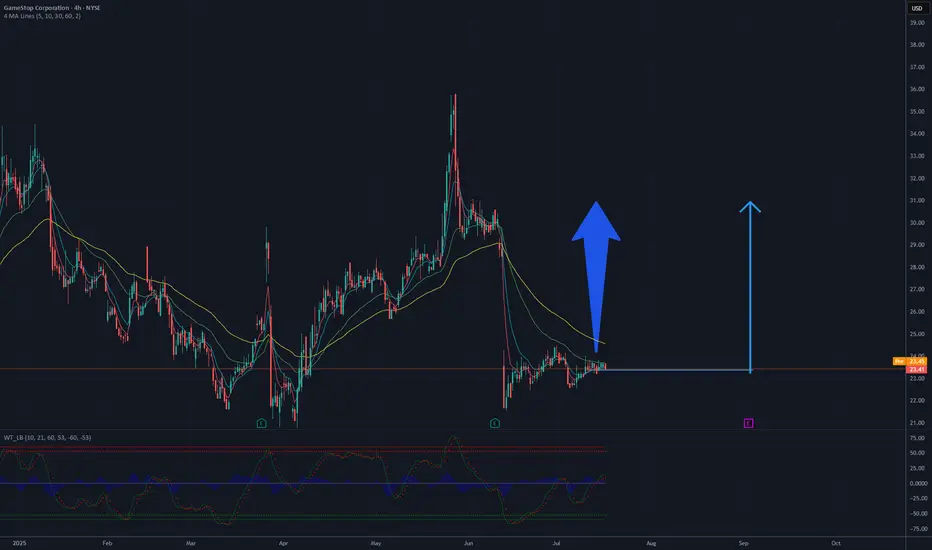
Is it a time for GAMESTOP? 30 $ in the sightAnalysis of the GameStop (GME) chart suggests a potential rise to 30 USD, based on current trends and technical levels. The 4-hour chart shows a recent decline following a sharp increase, with the price currently fluctuating around 23-24 USD. Key support is located at approximately 22 USD, which could act as a floor if the price starts to drop. The moving averages (e.g., 50-day and 200-day) indicate a previous upward trend, and current levels may represent a consolidation phase before the next upward move.
Breaking through resistance around 25-26 USD, which aligns with a previous peak, could pave the way for further growth. If demand increases and trading volume rises, the price could head toward 30 USD, a psychological and technical resistance level. Additional bullish signals, such as green candles or an increase in the oscillator (e.g., RSI) from current levels, could support this scenario. However, the risk of a sudden reversal should be monitored, especially if support at 22 USD is breached.
Potential TP: 30 USD
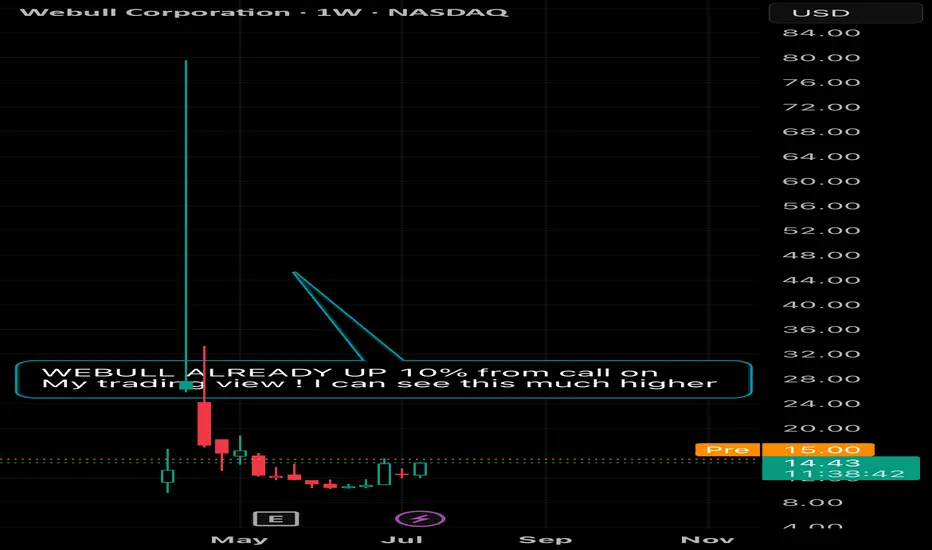
BULL Webull price action has been very nice the past day. My people are DCAing into webull as we look at similar launch patterns to robinhood.
With crypto bills passed. Yorkville acquiring a deal and partnership with webull. And stocks market increasing in interest. I can see this being a very nice gain to 50$
BSE at resistance, Long TradeBSE is closes above 2550 then it may give a good up ward move of 50 to 100 points.
On a bullish candle stick pattern and breakout at 2550 a Long call can be taken.
Entry after 2550 ( bullish candle stick pattern and breakout)
SL 2500
Target1: 2600
Target2: 2650.

Canara Bank FVG filled, Long TradeFVG created in Canara Bank is completely filled, if it sustains and breaks 116 then it may go up from here.
Entry at 116 on bullish candle stick pattern.
SL 112
Target 120+

Hindustan Unilever Long TargetHindustan Unilever has broke its resistance at 2440 and blasted 90 points. If it sustains 2500 levels then chances of it reach 2600 is pretty high.
So, if it sustains 2500 and close above 2500 then go long.
Target - 2600
SL - 2490

A possible trend change after a 3-year slideEAND has been in a downtrend since April 2022, but we could be witnessing the start of a reversal into an uptrend. Price has been consolidating since the beginning of 2025 and now shows signs of a breakout, supported by a strong recent earnings report.
Key Highlights
✔️ Robust earnings growth
✔️ Strong balance sheet
✔️ Technical setup showing breakout potential
✔️ Positive sentiment returning to the sector
This could be a turning point for EAND, a break above key resistance may signal further upside.
Do your own research and manage risk accordingly.

GMDC, Long 1D, Breakout, VolumesGMDC has shown a good volume in the stock today and has taken support from the previous low. If it breaks its recent high of 428 with Bullish candlestick patterns like Bullish Engulfing, Hammer & Inverted Hammer, Piercing Line, Morning Star, Three White Soldiers, Tweezer Bottoms or Bullish Harami, then take a long trade on this stock.
Entry: 428 (on Bullish candlestick pattern)
Target1: 445
Target2: 450 till 480.

Bikaji Food Triangular Pattern, Long, 1DBikaji Food is following a triangular pattern. If it breaks the level of 780 with Bullish candlestick patterns like Bullish Engulfing, Hammer & Inverted Hammer, Piercing Line, Morning Star, Three White Soldiers, Tweezer Bottoms or Bullish Harami, then take a long trade on this stock with first target of 815 and second target of 851.
Entry: 780 (on Bullish candlestick pattern)
Target1: 815
Target2: 851

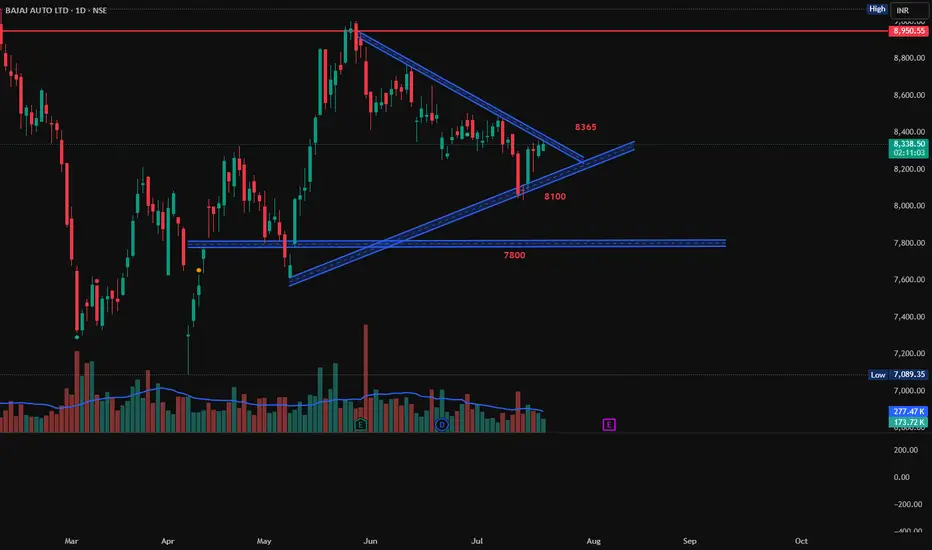
Bajaj Auto, Triangular PatternBajaj Auto is following a nice triangular pattern. Is both short and long side trade is possible on this stock. If it breaks above the pattern then enter on the breakout of 8365 with target 8950. If it break down below 8100 then target will be 7800.
Long
Entry: 8365
Target: 8950
Short
Entry: 8100
Target: 7800
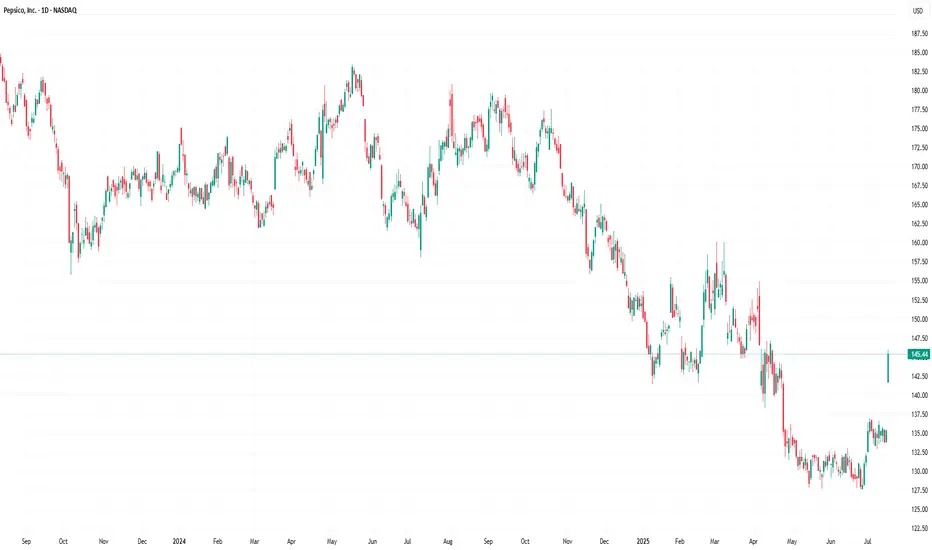
PepsiCo (PEP) Stock Rallies 7.4% Following Earnings ReportPepsiCo (PEP) Stock Rallies 7.4% Following Earnings Report – What Comes Next?
Yesterday, PepsiCo Inc. (PEP) released its quarterly earnings report, which significantly exceeded market expectations:
→ Earnings per share (EPS) came in at $2.12, surpassing the forecast of $2.02.
→ Gross revenue reached $22.7 billion, above the projected $22.3 billion.
In addition, PepsiCo reaffirmed its full-year guidance: the company expects earnings per share to remain virtually unchanged compared to the previous year, while organic revenue is anticipated to grow by a few percentage points.
Executives also outlined development plans for their brand portfolio, emphasising a focus on the growing demand for healthier snacks and a strategic initiative to reduce costs.
These factors contributed to PepsiCo Inc. (PEP) becoming one of the top-performing stocks on the market yesterday – its price surged by 7.4%, reflecting strong investor sentiment. What could come next?
Technical Analysis of PEP Stock Chart
A strong bullish candle formed on the chart yesterday, signalling a spike in demand:
→ The session opened with an impressive bullish gap, decisively breaking through the July resistance level around $137.
→ The share price continued to climb steadily throughout the day, forming a long-bodied candle.
→ The session closed near its high, confirming sustained upward momentum.
Notably, on 27 June (highlighted by an arrow on the chart), the stock posted gains on the highest trading volume of 2025 so far (according to Nasdaq data), which can be interpreted as a potential sign of sentiment reversal driven by institutional investors.
However, the broader picture remains bearish. PEP stock continues to trade within a long-term downward channel, shaped by declining demand for PepsiCo products and intensifying market competition.
Given the above, the following scenario should not be ruled out: the upper boundary of the long-term descending channel may act as resistance in the near term. As the post-earnings euphoria fades, the price could undergo a pullback – for instance, towards the $140 level, which previously served as support.
At the same time, the strong fundamental backdrop, reflecting the company’s operational success, could fuel persistent bullish interest. This may empower buyers to challenge and potentially break the long-standing downtrend in PEP shares.
This article represents the opinion of the Companies operating under the FXOpen brand only. It is not to be construed as an offer, solicitation, or recommendation with respect to products and services provided by the Companies operating under the FXOpen brand, nor is it to be considered financial advice.
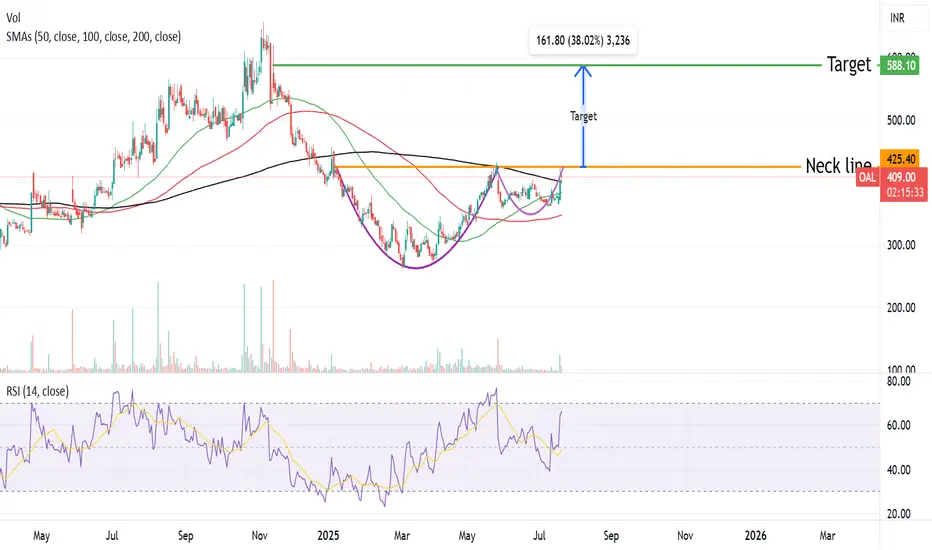
Oriental aromatic forming a CUP & HANDLE pattern Oriental aromatic forming a CUP & HANDLE pattern ,Breakout of this pattern will be above 425 level ,One can accumulate the stock with a stoploss of 360 for a Target of 580.
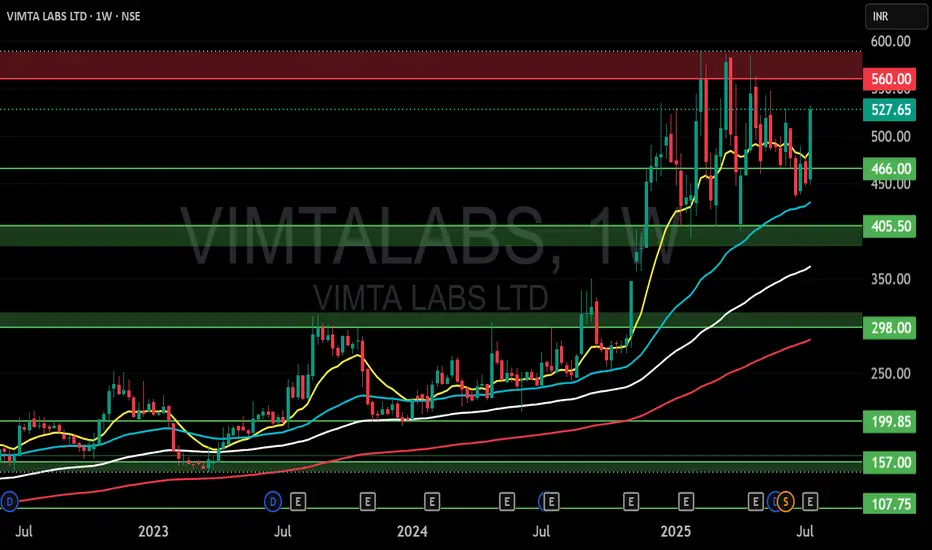
VIMTALAI (VIMTA LABS LTD) S/RSupport and Resistance Levels:
Support Levels: These are price points (green line/shade) where a downward trend may be halted due to a concentration of buying interest. Imagine them as a safety net where buyers step in, preventing further decline.
Resistance Levels: Conversely, resistance levels (red line/shade) are where upward trends might stall due to increased selling interest. They act like a ceiling where sellers come in to push prices down.
Breakouts:
Bullish Breakout: When the price moves above resistance, it often indicates strong buying interest and the potential for a continued uptrend. Traders may view this as a signal to buy or hold.
Bearish Breakout: When the price falls below support, it can signal strong selling interest and the potential for a continued downtrend. Traders might see this as a cue to sell or avoid buying.
MA Ribbon (EMA 20, EMA 50, EMA 100, EMA 200) :
Above EMA: If the stock price is above the EMA, it suggests a potential uptrend or bullish momentum.
Below EMA: If the stock price is below the EMA, it indicates a potential downtrend or bearish momentum.
Trendline: A trendline is a straight line drawn on a chart to represent the general direction of a data point set.
Uptrend Line: Drawn by connecting the lows in an upward trend. Indicates that the price is moving higher over time. Acts as a support level, where prices tend to bounce upward.
Downtrend Line: Drawn by connecting the highs in a downward trend. Indicates that the price is moving lower over time. It acts as a resistance level, where prices tend to drop.
Disclaimer:
I am not a SEBI registered. The information provided here is for learning purposes only and should not be interpreted as financial advice. Consider the broader market context and consult with a qualified financial advisor before making investment decisions.
Catch the bounce on NVDAHi, I'm The Cafe Trader.
We’re taking a deeper dive into NVIDIA (NVDA) — one of the leaders in the MAG 7 — with a short-term trade setup you can apply to both shares and options.
Setup Context:
NVDA is pushing into all-time highs, and we’re now approaching the average analyst price target (around $180). While we don’t know how price will react at this level, traders should be watching for pullbacks and trend continuations — prime zones for entry.
If we get a strong move down, I see $153 as a high-probability bounce area — where buyers are likely to step in aggressively.
Price Target Outlook:
The final price target will depend on how price moves into this zone:
- If NVDA runs to $200 before pulling back, targets shift higher.
- If it tops out around $180, we adjust accordingly.
That said, an initial bounce toward $169–$170 looks reasonable.
Options Note:
If NVDA sells off hard and fast, implied volatility (IV) will spike, making options expensive and reducing your edge. This is a setup that could play out over 2–3 weeks, but the first bounce could be quick — so timing matters.
Strategy: Staggered Entry Using Two Contracts
Use two contracts — one short-term, one mid-term — to maximize reward while managing time decay.
Contract 1: Short-Term (3–5 Days to Expiry)
Trigger Entry: As soon as price taps the demand zone (~$153)
Strike Entry Price ^^Target Price
155 $2.00 ^^ $6.00
157.5 $1.50 ^^ $4.50
160 $0.75 ^^ $2.50
You’re looking for a quick reaction: get in, take profit, and step aside while the market finds new balance.
Contract 2: Medium-Term (7–10 Days to Expiry)
Timing Tip: Wait for NVDA to stall or consolidate after the initial bounce — this is when IV comes down and contracts get cheaper.
Strike Entry Price ^^Target Price
155 $3.00 ^^ $15.00
157.5 $2.50 ^^ $12.50
160 $1.80 ^^$9.00
Important: Be careful trading too close to earnings. Contracts tend to get overpriced right before and after earnings drops.
That wraps up the short-term NVDA view.
Stay tuned for more trades and setups across the MAG 7.
@thecafetrader
Take care, and happy trading!

Nike is a screaming BUY with target above 80$ in the short termSummary: In short NKE is on reversal mode to the upside and 80$ is on the horizon and 100$+ by next quarter Earnings call which is an upside over 40% NYSE:NKE
Nike (NKE): Technical Strength Above the 200 SMA 🟢
Nike (NKE): Recent Earnings Overview 🏅
Above the 200-Day Simple Moving Average (SMA) 🟩
NKE’s price is currently holding above the key 200-day simple moving average (SMA).
The 200 SMA is widely followed by investors as a long-term trend indicator.
Sitting above this level signals a bullish phase, as it often marks a shift from bearish to bullish market sentiment.
Historically, when a stock breaks and sustains above its 200 SMA after a downtrend, it attracts attention from institutional buyers and can act as a strong support area for further upside .
Key Takeaways from the Earnings Call
China Recovery 🐉
Positive business trends are emerging in greater China, supporting Nike’s international momentum.
Brand Momentum 🚀
Investments in product innovation, branding, and digital transformation remain central to growth.
Shareholder Return 💰
The continuation of share buybacks and regular dividends signals Nike’s commitment to delivering value.
How This Supports the Bullish Thesis
Momentum Confirmation:
Trading above the 200 SMA supports the idea that recent gains are not just a short-term bounce, but reflect a possible trend reversal toward sustained growth.
Institutional Buying Signal:
Many long-term investors and funds use the 200 SMA as a buy trigger, increasing the likelihood of strong follow-through buying.
Risk-Reward:
Being above the 200 SMA, with support from lower moving averages, strengthens the case for manageable downside risk and a clear technical floor.
Combined with recent Earnings, the technical breakout above the 200 SMA aligns with Nike’s solid Q4 earnings results, margin improvement, and positive guidance, all reinforcing confidence in the current rally.
Nike’s position above the 200-day simple moving average—combined with recent strong fundamentals—strengthens the bullish outlook for the stock at this key juncture..
Why This Matters for the Buy Thesis
Earnings Beat: Supports the recent surge in Nike’s stock price and adds conviction to a bullish outlook.
Margin Resilience: Operational improvements reduce risk, even in a tough retail environment.
Brand and Digital Strength: Focus on innovation and digital sales provides confidence for long-term investors.
In short NKE is on reversal mode to the upsie and 80$ is on the horizon and 100$+ by next quarter Earnings call

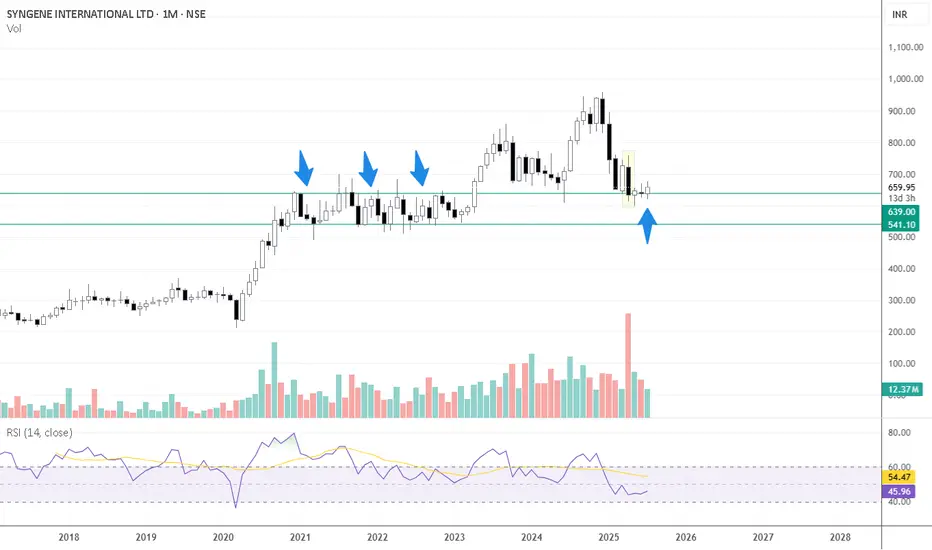
SYNGENE INTERNATIONAL LTD at Old Peaks Key Support 📈 Monthly Chart – Key Support at Old Peaks
The stock has recently revisited the ₹600–₹610 range, which corresponds to a previous consolidation and monthly swing-low zone (~₹607) from November 2020 to April 2023 on the monthly timeframe
This zone isn’t just another support level—it represents an area where price historically spent over 2.5 years, making multiple tests before breaking higher. Such zones often act as strong demand zones when revisited
A sustained hold above ₹607 would reinforce this support, signaling a potential base for a multi-month reversal or bounce
🕯️ April Monthly Candle – Selling Exhaustion?
Large bearish candle in April (FY25 Q4 results month).
High volume, which often signals capitulation or Selling climax.
Price has since stayed within the range of this candle-no breakout above or below.
Indicates a potential exhaustion of sellers if the stock holds above the low of that candle, this structure often represents a volatility compression after a sharp move-like a spring coiling.
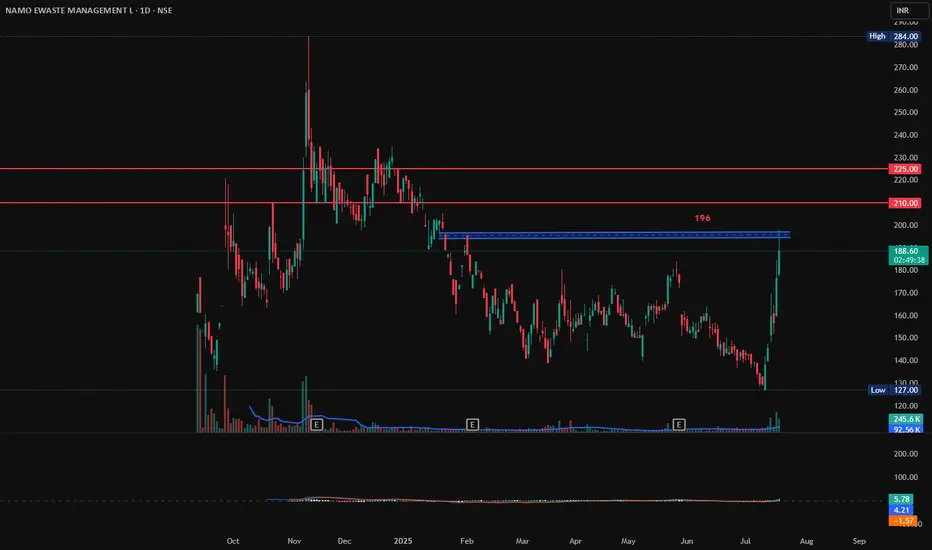
NAMO EWASTE MANAGEMENT, Long, Breakout, 1DNAMO EWASTE MANAGEMENT has gain 6% today with good volumes. If it breaks and sustains 196 with Bullish candlestick patterns like Bullish Engulfing, Hammer & Inverted Hammer, Piercing Line, Morning Star, Three White Soldiers, Tweezer Bottoms or Bullish Harami, then there are good chances for it to go further up from here. First target will be 210 and second target 225.
Entry: 196 (on Bullish candlestick pattern)
Target1: 210
Target2: 225.
SL: 185
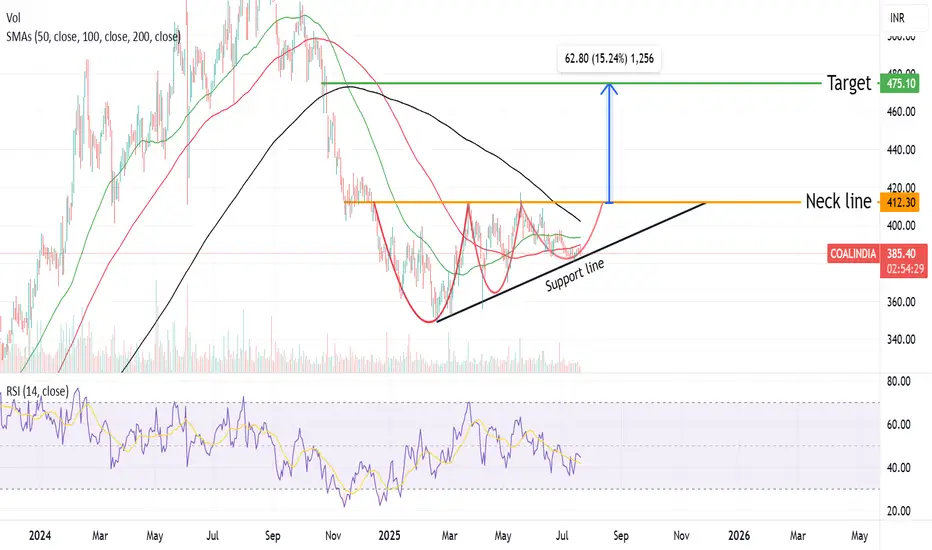
Coal India CUP & HANDLE Pattern formation going on Coal India currently forming a CUP & Handle pattern ,Breakout of this pattern will be above 410 level .Target price will be arround 470 level .One can start accumulation in Coal India .Stoploss will be arround 360 level
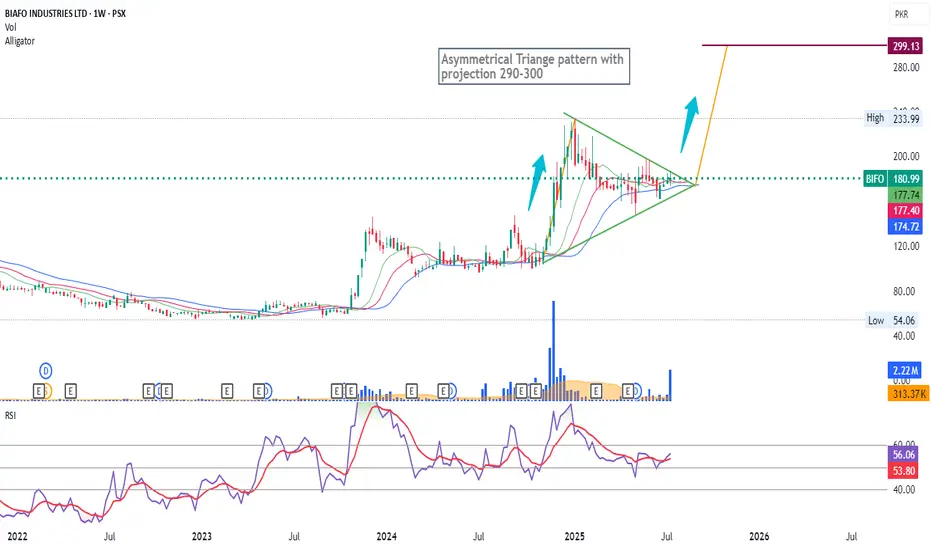
BIFO WEEKLY LONG POSITIONA bit medium to long term perspective. Projection marked at the end of the Triangle's intersection for now, plz note. Accumulation going will take some time to materialize. keep fingers crossed.....
Lets c how it plays further
Investment cum Trading IdeaDELHIVERY LTP 330 Tgt:370/430/470 🤞🏻🤞🏻🤞🏻 Purely long-term investment may add on dips or hold calmly Will Review at price range of 480-500 for further move

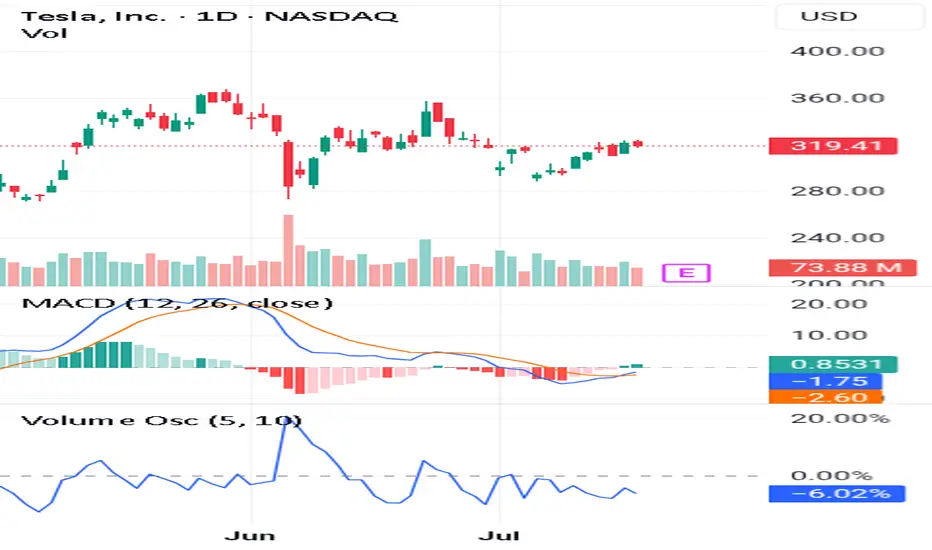
(Learn More)Use These 3 Steps To Spot Long-Lasting Trends👉Trade before the earnings report
👉Make sure the volume oscillator is below zero
👉Make sure the MACD lines give you a Bullish signal
If you look at this chart you can see all the steps alignment.
This is very important because you want to catch a long term trend.
Also it has to follow the 3step rocket booster strategy.
In order for you to learn more about this strategy 🚀 Rocket Boost This Content.
Disclaimer ⚠️ Trading is risky please learn how to use Risk Management And Profit Taking Strategies. Also feel free to use a simulation trading account before you use real money.
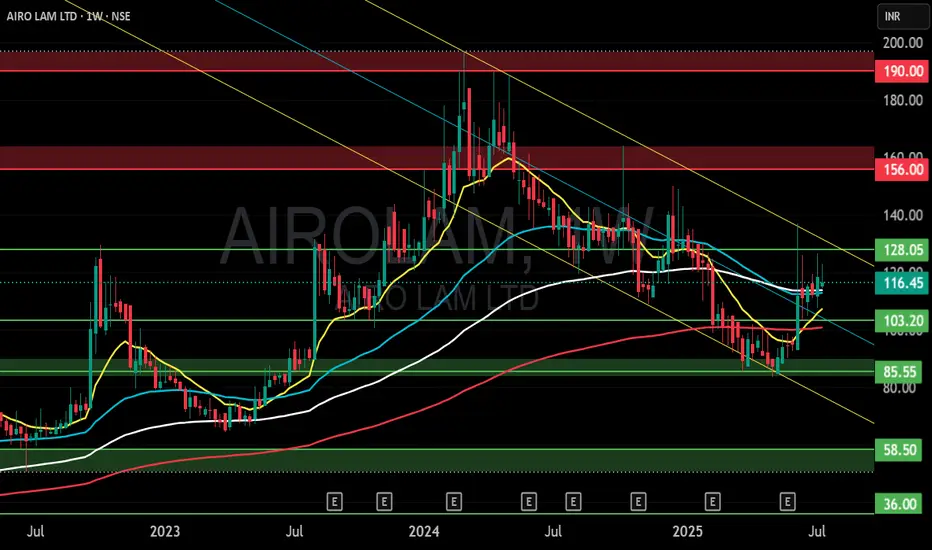
AIROLAM (AIRO LAM LTD) S/RSupport and Resistance Levels:
Support Levels: These are price points (green line/shade) where a downward trend may be halted due to a concentration of buying interest. Imagine them as a safety net where buyers step in, preventing further decline.
Resistance Levels: Conversely, resistance levels (red line/shade) are where upward trends might stall due to increased selling interest. They act like a ceiling where sellers come in to push prices down.
Breakouts:
Bullish Breakout: When the price moves above resistance, it often indicates strong buying interest and the potential for a continued uptrend. Traders may view this as a signal to buy or hold.
Bearish Breakout: When the price falls below support, it can signal strong selling interest and the potential for a continued downtrend. Traders might see this as a cue to sell or avoid buying.
MA Ribbon (EMA 20, EMA 50, EMA 100, EMA 200) :
Above EMA: If the stock price is above the EMA, it suggests a potential uptrend or bullish momentum.
Below EMA: If the stock price is below the EMA, it indicates a potential downtrend or bearish momentum.
Trendline: A trendline is a straight line drawn on a chart to represent the general direction of a data point set.
Uptrend Line: Drawn by connecting the lows in an upward trend. Indicates that the price is moving higher over time. Acts as a support level, where prices tend to bounce upward.
Downtrend Line: Drawn by connecting the highs in a downward trend. Indicates that the price is moving lower over time. It acts as a resistance level, where prices tend to drop.
Disclaimer:
I am not SEBI registered. The information provided here is for learning purposes only and should not be interpreted as financial advice. Consider the broader market context and consult with a qualified financial advisor before making investment decisions.
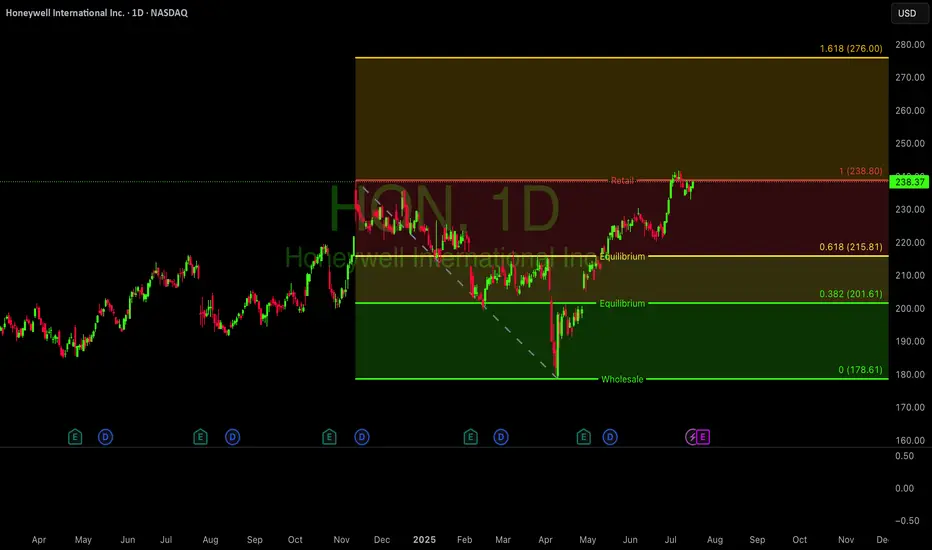
$HON Honey are you well NASDAQ:HON looking strong. Weekly chart is in a clear Stage 2 uptrend, now consolidating near all-time highs.
The 4-hour chart is holding key support around the $230-$233 level, with the Stochastic oscillator turning up from oversold territory. A decisive break above the $240 resistance could signal the next major leg higher.
#Honeywell #TechnicalAnalysis #Trading #Stocks
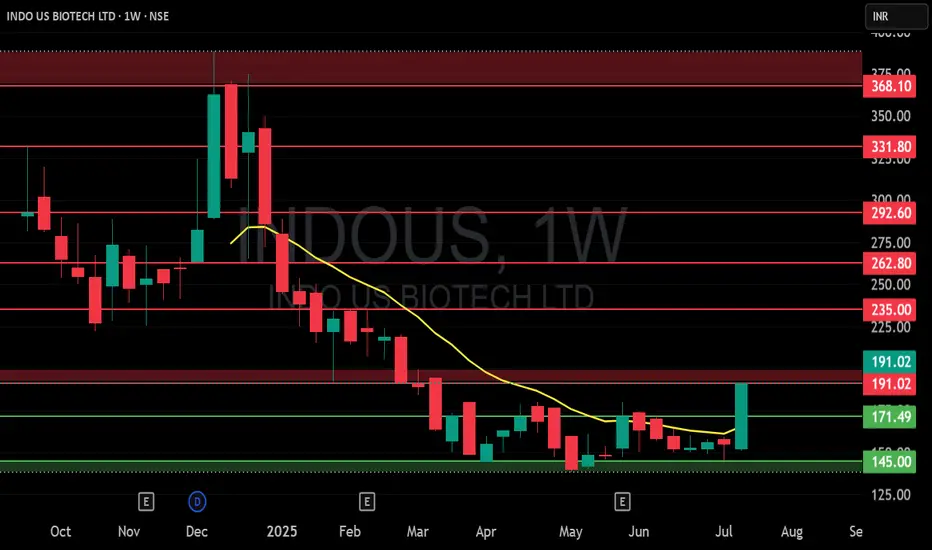
INDOUS (INDO US BIOTECH LTD) S/RSupport and Resistance Levels:
Support Levels: These are price points (green line/shade) where a downward trend may be halted due to a concentration of buying interest. Imagine them as a safety net where buyers step in, preventing further decline.
Resistance Levels: Conversely, resistance levels (red line/shade) are where upward trends might stall due to increased selling interest. They act like a ceiling where sellers come in to push prices down.
Breakouts:
Bullish Breakout: When the price moves above resistance, it often indicates strong buying interest and the potential for a continued uptrend. Traders may view this as a signal to buy or hold.
Bearish Breakout: When the price falls below support, it can signal strong selling interest and the potential for a continued downtrend. Traders might see this as a cue to sell or avoid buying.
MA Ribbon (EMA 20, EMA 50, EMA 100, EMA 200) :
Above EMA: If the stock price is above the EMA, it suggests a potential uptrend or bullish momentum.
Below EMA: If the stock price is below the EMA, it indicates a potential downtrend or bearish momentum.
Trendline: A trendline is a straight line drawn on a chart to represent the general direction of a data point set.
Uptrend Line: Drawn by connecting the lows in an upward trend. Indicates that the price is moving higher over time. Acts as a support level, where prices tend to bounce upward.
Downtrend Line: Drawn by connecting the highs in a downward trend. Indicates that the price is moving lower over time. It acts as a resistance level, where prices tend to drop.
Disclaimer:
I am not a SEBI registered. The information provided here is for learning purposes only and should not be interpreted as financial advice. Consider the broader market context and consult with a qualified financial advisor before making investment decisions.