UNH... a double bottom would be niceso it doesn't have to happen, but I would love to see a double bottom around 245-250. it's just a technical idea that would give "ok we are ready to head back to 400." neckline would be 320-325.
watching and puts below 295. or rejects against 300.

Natural Gas - The Epic Reversal? Natural gas had an astonishing move to the upside. Closing up over 5% today.
This volatility can make all tarders head spin if youre not used to it.
Why did Nat gas pop today?
Partly from being oversold and into really good technical support, Natural gas inventories were released today at 10:30am.
The inventories showed a smaller build than the market expected which implies stronger demand. 56B consensus vs 53B actual.
This could potentially be the start to a new bullish trend.
Names like EQT & AR hit some major support today. Some call options on these names have been accumulated.


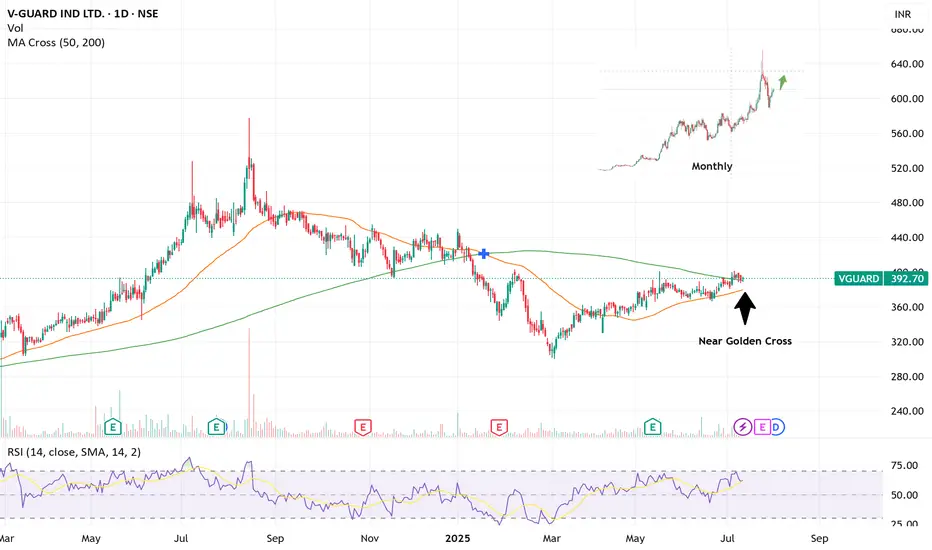
Guard you portfolio with VGUARD!- Price above 50, 200 DMA
- Nearing Golden Crossover
- Fundamentally decent stock
Only for education. This is not a buy/sell recommendation
Will Boeing experience a price drop with China buying Airbus?My experience in simulating the price from price growth to the diamond ceiling drawn in the Boeing analysis, I think we should expect the price to grow to the $224 price range in the short term!
Good luck!
MJ.REZAEI

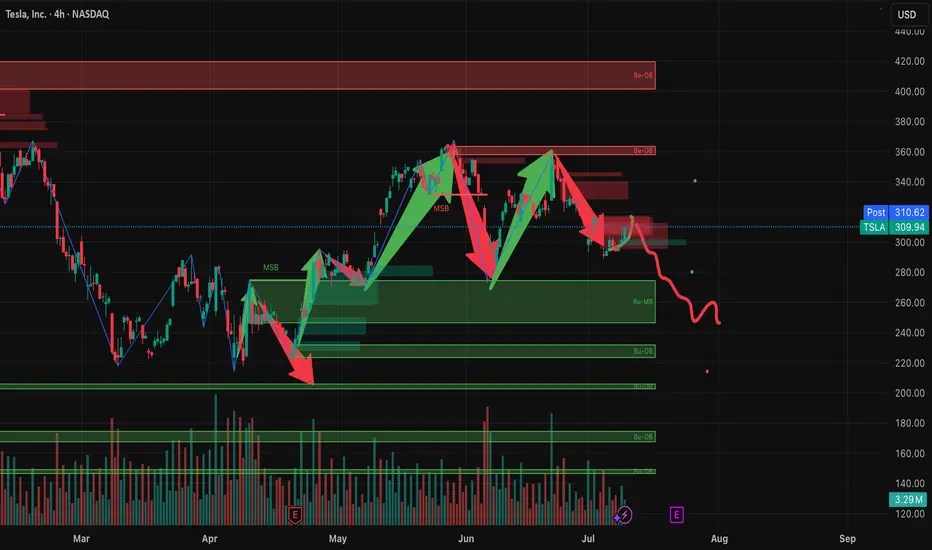
Why TSLA will Crash based On Copper TarrifsHere’s why that bearish outlook is gaining traction:
Copper costs are surging: Tesla uses over 180 pounds of copper per vehicle. With prices spiking 13% in a single day and a 50% tariff looming, production costs are rising fast.
Analysts are cutting price targets: UBS, JPMorgan, and Bank of America have all lowered their forecasts for Tesla, citing margin pressure and weakening demand3.
Brand sentiment is shaky: Tesla’s recent delivery miss and political controversies around Elon Musk have added to investor unease.
Tariff ripple effects: The broader trade war is expected to disrupt supply chains and inflate costs across the EV sector5.
That said, some analysts still see long-term upside if Tesla can pivot quickly—especially with its AI and autonomous driving ambitions. But for now, the market is reacting to the immediate risks.
Overall Enter Short for Gains of 3-5 percent.
SOLB | Confirmed Descending Triangle Breakout – 32% Target📍 Ticker:
SOLB (Solvay SA – Euronext Brussels)
📆 Timeframe: 1D (Daily)
📉 Price: €30.14
📈 Pattern: Descending triangle breakout confirmed on daily close
📊 Breakout Probability estimation: ~73% (short-term triangle breakout upward)
🔍 Technical Setup (Updated on Daily Chart):
Solvay has now confirmed the breakout on the daily timeframe, closing above both the horizontal support and the descending trendline. This marks a multi-timeframe confluence breakout, increasing confidence in the projected move toward upper resistance levels.
✅ Daily candle close above descending resistance
✅ RSI breakout above 55, building momentum
📉 Stop clearly defined under €27.90 → optimal risk profile
📊 Volume expanding, validating move
🧠 Updated Trade Plan:
📥 Entry Zone: €29.90–€30.50 (daily confirmation)
⛔ Stop-Loss: Below €27.90
🔁 Hold while structure remains above descending trendline support
🎯 Upside Targets & Potential Return (from €30.14)
🎯 Target Price Return
Target 1 €33.84 +12.06%
Target 2 €39.76 +32.21%
📊 Pattern Probability – Daily Structure:
📐 Pattern: Descending Triangle Breakout
🔺 Upward breakout probability: ~73%
🎯 Full measured move supports Target 2 if buyers remain active
⚠️ Technical Signals to Watch:
🔎 Retest of descending line on lower volume = strong
✅ RSI > 55 with bullish structure
📈 Rising volume → growing institutional interest
📊 Price reclaiming structure from broader daily consolidation
💬 Solvay is transitioning from a textbook 4H breakout to a multi-day continuation setup. The alignment of pattern, structure, and momentum makes this one of the cleaner swing setups on the European market right now.
🔔 Follow @TargetTraders for high-probability technical trades.
#SOLB #BreakoutSetup #DescendingTriangle #TechnicalPattern #SwingTrade #Euronext #TargetTraders #VolumeBreakout #ChartAnalysis

More Upside in Wheaton Precious Metals? Wheaton Precious Metals has consolidated for more than a month, and some traders may think it’s poised to continue higher.
The first pattern on today’s chart is the April 21 high of $87.42. The silver company stayed below that level through June 2. It then shot above it and held the same price over the following month. That could suggest old resistance has become new support.
Second, WPM appears to have broken a falling trendline.
Third, the 8-day exponential moving average (EMA) has stayed above the 21-day EMA. That may reflect a bullish short-term trend.
Finally, Bollinger Band Width in the lower study highlights tighter movement. Will that price compression give way to price expansion?
Check out TradingView's The Leap competition sponsored by TradeStation.
TradeStation has, for decades, advanced the trading industry, providing access to stocks, options and futures. If you're born to trade, we could be for you. See our Overview for more.
Past performance, whether actual or indicated by historical tests of strategies, is no guarantee of future performance or success. There is a possibility that you may sustain a loss equal to or greater than your entire investment regardless of which asset class you trade (equities, options or futures); therefore, you should not invest or risk money that you cannot afford to lose. Online trading is not suitable for all investors. View the document titled Characteristics and Risks of Standardized Options at www.TradeStation.com . Before trading any asset class, customers must read the relevant risk disclosure statements on www.TradeStation.com . System access and trade placement and execution may be delayed or fail due to market volatility and volume, quote delays, system and software errors, Internet traffic, outages and other factors.
Securities and futures trading is offered to self-directed customers by TradeStation Securities, Inc., a broker-dealer registered with the Securities and Exchange Commission and a futures commission merchant licensed with the Commodity Futures Trading Commission). TradeStation Securities is a member of the Financial Industry Regulatory Authority, the National Futures Association, and a number of exchanges.
TradeStation Securities, Inc. and TradeStation Technologies, Inc. are each wholly owned subsidiaries of TradeStation Group, Inc., both operating, and providing products and services, under the TradeStation brand and trademark. When applying for, or purchasing, accounts, subscriptions, products and services, it is important that you know which company you will be dealing with. Visit www.TradeStation.com for further important information explaining what this means.

LIFE 360 legendary dealLife360 helps families stay connected and safe. It lets you share your location in real-time with loved ones, get alerts when someone arrives or leaves a specific spot, and even warns you if there's a car accident. Plus, it offers roadside assistance and identity theft protection. This could also have several applications in the industry and location of important packages.
Life360 is on a roll financially, with growing revenues and plans to expand with new tech, like a global satellite tracking network and services for pets in 2025 and seniors in 2026. They're also reducing losses and boosting income, which is a great sign for the future. With smarter advertising on the way, they're set to keep growing and innovating.
With this introduction, Life360 is a strong candidate for a long-term investment. However, our goal is to achieve fast profits with minimal risk, while continuing to search for other opportunities.
Last week, Life360 closed within a well-defined support zone around the 39.60 level. Purchasing at this level offers the potential for a 20% gain in the coming days , with a limited downside risk of only 3% to 4% (stop-loss zone).
Boosting the Trade to a Risk-Free Position
A common outcome for a multiple-bottom support pattern like this is a breakout, often followed by a rapid price decline. However, there is a strategy to capitalize on this scenario :
1. Buy 50% of the position with a take-profit (TP) at the first target.
2. Buy the remaining 50% with a TP at the second target area.
If the price rebounds to the first TP, we will s ecure a 6% profit, effectively ensuring a risk-free trade . In fact, this would result in an overall return of (6% × 50%) + (-4% × 50%) = 1% profit for the entire initial position.
If the price arrives to the 2nd target, a profit of over 13% will be done in few days combining both positions.

Cup & Handle to 81$ (and much more)Breakout successful from the red descending channel where we had left it in the previous idea.
The price is now completing the 'handle' of the pattern in question.
Resistance is around $81.5, and a close above it, accompanied by strong volume, could push the price back toward $100

Need a little pullback before long entryI am watching for a pull back to around the $191 area for a possible long entry. Keep on your
watchlist and I will update here if/when I initiate a trade.

STNG | Inverted H&S Breakout –Target +44% at 65 Major resistance📍 Ticker: NYSE:STNG (Scorpio Tankers Inc. – NYSE)
📆 Timeframe: 1D (Daily)
📉 Price: $45.62
📈 Pattern: Inverted Head & Shoulders + Breakout from Long-Term Falling Resistance
📊 Breakout Probability (estimated): 93% breakout success, 83% to measured target
🔍 Technical Setup:
STNG has completed a confirmed breakout from a textbook Inverted Head and Shoulders pattern, reinforced by a multi-month descending trendline break. This aligns with a multi-technical confluence zone, with the neckline holding as support.
✅ Classic reversal structure
📈 Strong breakout candle with volume > 2x average
🟢 RSI above 64 and no bearish divergence
📐 Measured move projection suggests two major upside targets
📏 Target Projections (from breakout at $41):
🎯 Target Price Return
Target 1 $51.98 +22.5%
Target 2 $65.83 +44.0%
📌 Both targets align with prior horizontal resistance and upper descending trendline intersections
🧠 Trade Plan:
📥 Entry Zone: $44.50 – $46.00 (post-breakout, wait for confirmed structure)
⛔ Stop-Loss (Trailing): Start below $40.00 → trail as price confirms above $48.00
🔁 Partial stop logic: Use under neckline, then adjust dynamically with trend support
📊 Estimated Probabilities:
📐 Pattern: Inverted Head & Shoulders
🔺 Breakout success rate: 93%
🎯 Target met probability: 83%
🔁 Throwback chance: 68% → ideal entry if price retests $41
⚠️ Technical Signals to Monitor:
🔎 Volume remains elevated → confirms institutional interest
✅ RSI trending above 60 → bullish momentum intact
📉 Wide base and upward neckline = higher success probability
📈 Price now in upward sloping channel → bias continues up unless trendline fails
💬 STNG is delivering a clean multi-pattern breakout, backed by volume, RSI confirmation, and a textbook technical structure. If momentum holds, this setup may be one of the highest-probability mid-term swing plays on the NYSE right now.
Follow @TargetTraders for high-probability technical trades
#STNG #TechnicalBreakout #InvertedHeadAndShoulders #PatternTrading #ChartPatterns #NYSEStocks #VolumeBreakout #SwingSetup #BreakoutTrade #SwingTrade #TargetTraders

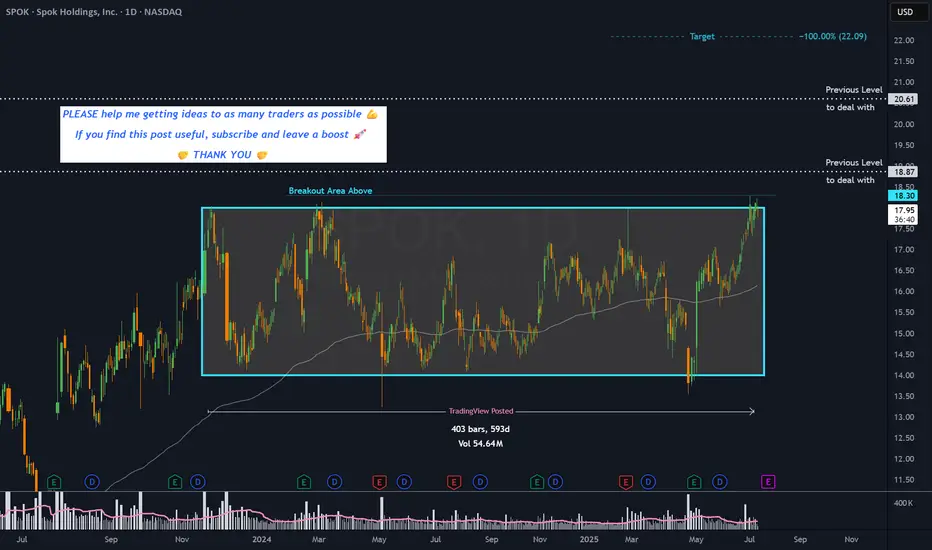
SPOK - 19 months RECTANGLE══════════════════════════════
Since 2014, my markets approach is to spot
trading opportunities based solely on the
development of
CLASSICAL CHART PATTERNS
🤝Let’s learn and grow together 🤝
══════════════════════════════
Hello Traders ✌
After a careful consideration I came to the conclusion that:
- it is crucial to be quick in alerting you with all the opportunities I spot and often I don't post a good pattern because I don't have the opportunity to write down a proper didactical comment;
- since my parameters to identify a Classical Pattern and its scenario are very well defined, many of my comments were and would be redundant;
- the information that I think is important is very simple and can easily be understood just by looking at charts;
For these reasons and hoping to give you a better help, I decided to write comments only when something very specific or interesting shows up, otherwise all the information is shown on the chart.
Thank you all for your support
🔎🔎🔎 ALWAYS REMEMBER
"A pattern IS NOT a Pattern until the breakout is completed. Before that moment it is just a bunch of colorful candlesticks on a chart of your watchlist"
═════════════════════════════
⚠ DISCLAIMER ⚠
Breakout Area, Target, Levels, each line drawn on this chart and any other content represent just The Art Of Charting’s personal opinion and it is posted purely for educational purposes. Therefore it must not be taken as a direct or indirect investing recommendations or advices. Entry Point, Initial Stop Loss and Targets depend on your personal and unique Trading Plan Tactics and Money Management rules, Any action taken upon these information is at your own risk.
═════════════════════════════
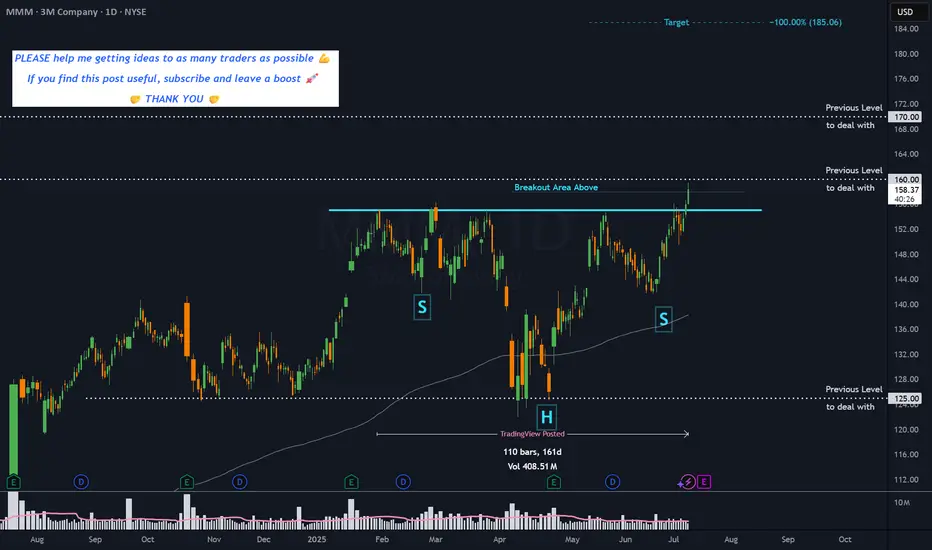
MMM - 5 months HEAD & SHOULDERS CONTINUATION══════════════════════════════
Since 2014, my markets approach is to spot
trading opportunities based solely on the
development of
CLASSICAL CHART PATTERNS
🤝Let’s learn and grow together 🤝
══════════════════════════════
Hello Traders ✌
After a careful consideration I came to the conclusion that:
- it is crucial to be quick in alerting you with all the opportunities I spot and often I don't post a good pattern because I don't have the opportunity to write down a proper didactical comment;
- since my parameters to identify a Classical Pattern and its scenario are very well defined, many of my comments were and would be redundant;
- the information that I think is important is very simple and can easily be understood just by looking at charts;
For these reasons and hoping to give you a better help, I decided to write comments only when something very specific or interesting shows up, otherwise all the information is shown on the chart.
Thank you all for your support
🔎🔎🔎 ALWAYS REMEMBER
"A pattern IS NOT a Pattern until the breakout is completed. Before that moment it is just a bunch of colorful candlesticks on a chart of your watchlist"
═════════════════════════════
⚠ DISCLAIMER ⚠
Breakout Area, Target, Levels, each line drawn on this chart and any other content represent just The Art Of Charting’s personal opinion and it is posted purely for educational purposes. Therefore it must not be taken as a direct or indirect investing recommendations or advices. Entry Point, Initial Stop Loss and Targets depend on your personal and unique Trading Plan Tactics and Money Management rules, Any action taken upon these information is at your own risk.
═════════════════════════════
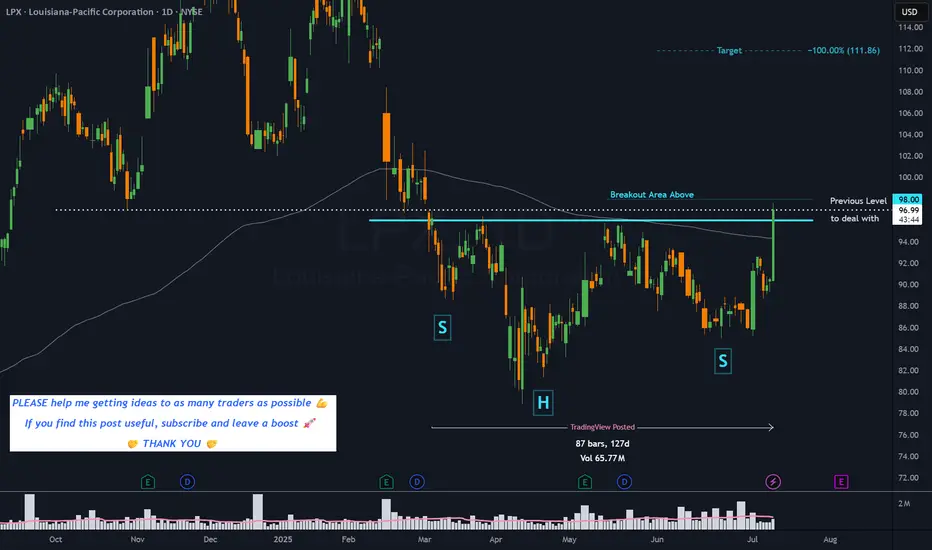
LPX - 4 months HEAD & SHOULDERS══════════════════════════════
Since 2014, my markets approach is to spot
trading opportunities based solely on the
development of
CLASSICAL CHART PATTERNS
🤝Let’s learn and grow together 🤝
══════════════════════════════
Hello Traders ✌
After a careful consideration I came to the conclusion that:
- it is crucial to be quick in alerting you with all the opportunities I spot and often I don't post a good pattern because I don't have the opportunity to write down a proper didactical comment;
- since my parameters to identify a Classical Pattern and its scenario are very well defined, many of my comments were and would be redundant;
- the information that I think is important is very simple and can easily be understood just by looking at charts;
For these reasons and hoping to give you a better help, I decided to write comments only when something very specific or interesting shows up, otherwise all the information is shown on the chart.
Thank you all for your support
🔎🔎🔎 ALWAYS REMEMBER
"A pattern IS NOT a Pattern until the breakout is completed. Before that moment it is just a bunch of colorful candlesticks on a chart of your watchlist"
═════════════════════════════
⚠ DISCLAIMER ⚠
Breakout Area, Target, Levels, each line drawn on this chart and any other content represent just The Art Of Charting’s personal opinion and it is posted purely for educational purposes. Therefore it must not be taken as a direct or indirect investing recommendations or advices. Entry Point, Initial Stop Loss and Targets depend on your personal and unique Trading Plan Tactics and Money Management rules, Any action taken upon these information is at your own risk.
═════════════════════════════
Franco-Nevada Breakout — Is $160 the Launchpad?With gold breaking to new all-time highs and capital rotating into high-quality royalty names, Franco-Nevada looks poised to lead the charge in the next leg of the bull market.
After spending nearly 3 years in a wide consolidation ($106–160), FNV has now posted a clean monthly close above $160 — the key resistance level that capped every rally since 2020. This is not just any breakout — it's the classic "base + breakout" structure that often precedes major upside moves.
🔍 Technical Highlights:
✅ Multi-year base breakout confirmed on monthly close
✅ Strong confluence of Ichimoku, MAs & low-volume node just above $160
✅ $160 flips from resistance to structural support (role reversal)
🎯 Measured Move Target: $230
📍 Initial Target Zone: $208–215
📈 Retest of $160 offers a ~30% upside with tight risk
🛑 Risk Management: A pullback that holds $160 on weekly/monthly close would validate the breakout.
Breakdown below $160 on volume would put the move on hold and reintroduce range risk.
💡 Bottom Line: This is a textbook breakout with asymmetric risk/reward. While gold gets the headlines, Franco-Nevada may quietly be leading the charge in royalty sector performance.

UNH setting up for a big moveUNH wedge... gaps to fill... obviously some uncertainty and earlier tried to break out, but an eventual breakout to the upside is written on the wall

SMCI BULL FLAG PART 2smci bull flag, reclaimed bullish emas recently, volume starting to come back in, imo has potential to run to 60+

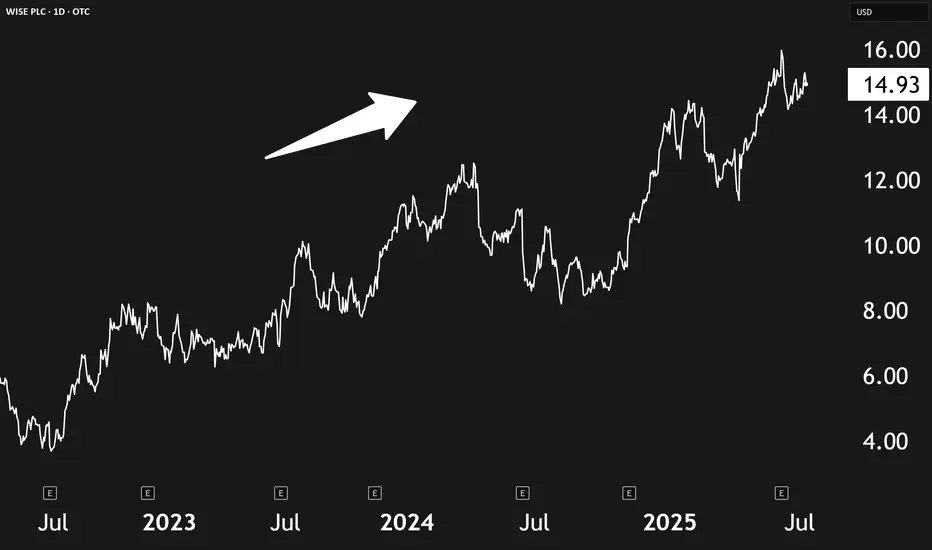
Wise Is Poised To Capture A Multi-Trillion Dollar OpportunityA few months back, we highlighted key investment trends for the next decade—among them, cross-border finance and fintech disruption. Now, Wise plc OTC:WIZEY , a British fintech leader, is showing strong alignment with both themes, and it may soon benefit from even more investor attention as it plans to move its listing from the UK to the U.S.
🌍 What Wise Does
Wise offers low-cost, tech-driven cross-border payment services. Rather than sending money physically across borders, it uses a network of local money transfer entities to settle transactions locally. This allows the company to avoid high bank fees and offer fast, affordable currency exchanges. Currently, 65% of its international payments are settled instantly, and 95% are completed within 24 hours.
Its infrastructure, built over the past decade, gives Wise a strong moat—few competitors can replicate its speed and pricing. The company also offers personal and business multi-currency accounts, a debit card, and an investing feature called "Wise Assets." Additionally, Wise licenses its payment rails to institutions like Morgan Stanley and Monzo, creating another layer of growth potential.
📈 Financials & Growth
Wise has seen explosive growth:
- Revenue has more than tripled since 2021.
- Profits are up 7.2x during the same period.
- Active users, transfers, and customer balances are all climbing steadily.
Management expects mid-teens growth in both revenue and profits, though we see this as conservative given Wise’s network effects.
💰 Valuation & U.S. Relisting Potential
Currently valued at ~$17.8 billion with a P/E of ~24.7x, Wise trades more cheaply than many U.S. fintech peers. If EBIT projections hold—$900M in 2026 and $1.1B in 2027—the multiple could compress to ~17x, making it even more attractive.
Relisting in the U.S. could spark multiple expansion as it gains visibility and liquidity among U.S. investors. Wise trades at about 5x sales today; even a modest bump closer to 10x could signal major upside.
⚠️ Risks to Watch
Low U.S. liquidity: Shares currently trade over-the-counter under WIZEY, which comes with low volume and potential slippage.
Emerging competitors: Rivals like Remitly (RELY) are growing.
Security risks: Any breaches, like the one it faced years ago, could damage trust.
✅ Final Take
Wise stands out as a rare combination of profitability, growth, and competitive edge in a massive, underpenetrated market. With a planned U.S. relisting and strong financials, it’s well-positioned for continued upside.
Rating: Strong Buy
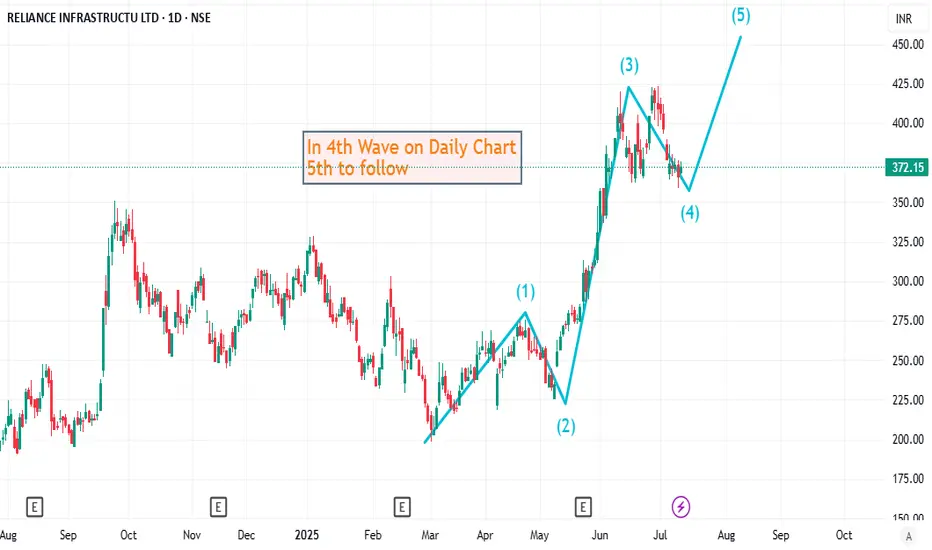
Elliott Wave Analysis of RELINFRAThe stock is currently in 4th wave on daily chart. The flat 4th wave correction seems to be almost complete. 5th up to follow from here.
Gold royaltyI am following long diagonal trend line in the chart of GROY. There is some divergence in RSI, and support in the distance from MA. A company with good value and probable triple bottom.
With two new producing royalties from this year growth looks inevitable.
Do your own research!

ServiceNow Is Our Top Tech Compounder PickIn a tech world often driven by hype and speculation, ServiceNow NYSE:NOW stands out as a reliable growth engine—a true compounder. Unlike flashier tech names, ServiceNow delivers steady revenue growth and expanding margins, all while offering mission-critical software to businesses.
📈 What’s a Compounder, Anyway?
Compounders are companies that grow steadily over time by reinvesting profits at high returns. They may not make headlines, but they consistently outperform by:
- Growing demand for their shares
- Reducing share supply (or keeping dilution low)
These are the businesses long-term investors love: predictable, resilient, and scalable.
🧩 Why ServiceNow Fits the Bill
ServiceNow has quietly built a powerful B2B software business, helping organizations streamline operations. Here’s why it qualifies as a compounder:
Strong Revenue Growth: From $3.3B in 2020 to $11.4B today
Rapid Profit Growth: Net income jumped from $34M to $1.54B in the same period
Operating Leverage: Margins have grown from 3.4% to 13.2%, thanks to stable 80%+ gross margins and low incremental costs
Recurring subscription revenue is rising fast—up 20% YoY—driven by the mission-critical nature of its software and increasing AI capabilities.
💸 The Valuation Case
Although many quant models give NOW a weak grade for valuation, context matters. Historically, the stock is trading in the middle of its typical range—about 18x sales and 58x free cash flow.
Looking ahead:
Analysts forecast 20% annual EPS growth through 2027
That implies a forward P/E of 42x, with potential to drop further as margins expand
Combine that with AI-powered upselling and potential share buybacks, and NOW’s valuation starts to look compelling.
⚠️ Risks to Watch
Premium Price Tag: If markets decline, richly valued stocks like NOW could fall harder
Tough Competition: Rivals like Salesforce and Palantir are aggressively chasing similar markets
✅ Bottom Line
ServiceNow may not be flashy, but its financial performance, recurring revenue model, and growth runway make it a solid long-term bet. If management reins in share dilution and continues margin expansion, this stock could deliver serious compounding over the next decade.
Rating: Buy

Empress Royalty – Undervalued Precious Metals Royalty🔹 Fundamental Outlook:
Empress Royalty offers exposure to gold and silver through a diversified portfolio of streaming and royalty agreements, with a focus on earlier-stage producers and developers. Backed by strategic partnerships with Endeavour Financial and Terra Capital, the company leverages deep deal flow and structuring expertise, while keeping overhead lean.
Cash flowing from several active royalties
EV/EBITDA (TTM): ~2.3 – indicating deep value
Free Cash Flow: ~$33M
Float: Only ~43M shares – tightly held
No major debt concerns (cash/debt ratio ~1.44)
The recent appointment of Mark Ashcroft as Business Development Advisor (North America) further boosts Empress’ ability to scale its portfolio with quality assets in the region.
✅ Undervalued vs peers on cash flow and earnings
✅ Royalty model limits operational risk
✅ Exposure to gold and silver (a rare mix)
✅ Insiders and partners with long-standing mining credentials
✅ Benefiting from a rising silver sentiment and the search for non-dilutive capital by small/mid-tier miners
🔹 Risks:
Operator dependency (as a royalty company)
Exposure to early-stage projects with potentially higher execution risk
Thin trading volume at times, which may increase volatility
📈 Conclusion:
Empress Royalty is a fundamentally solid, technically bullish small-cap royalty play. With silver sentiment turning and precious metals investors rotating into high-leverage names, EMPR offers both growth potential and asymmetric reward/risk.
