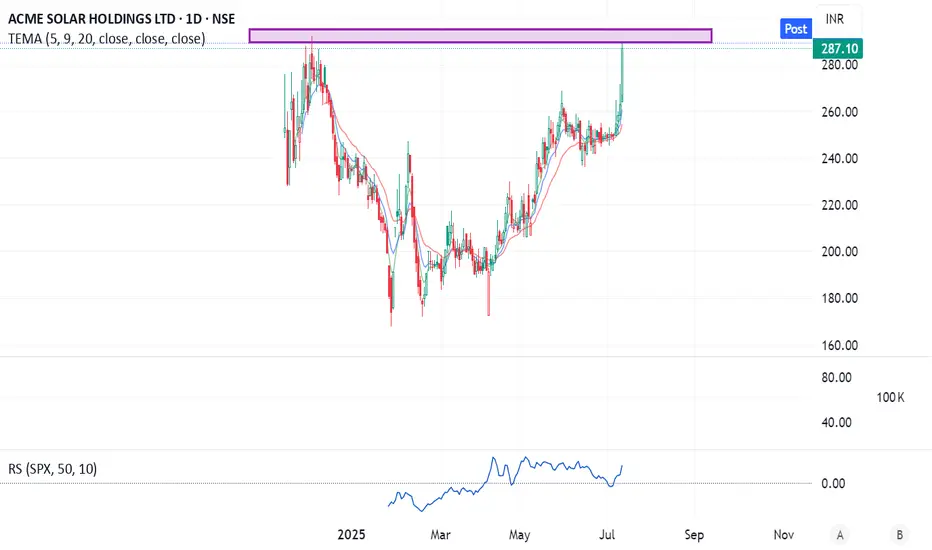
Positional trade setup for ACME Solar Holdings Ltd Technical Analysis (Daily Chart)
CMP: ₹287 approx
Pattern: Approaching major resistance zone at ₹290–295 (prior highs). Watch for a breakout or rejection.
EMA 5‑9‑20 Setup: EMAs are stacked bullish and trending upward, showing improved momentum.
Trade Entry: Wait for a decisive close above ₹295 (breakout confirmation).
Stop-Loss: Place below the breakout zone—daily close under ₹282.
Target Zones:
🎯 Target 1: ₹320 (next swing high)
🎯 Target 2: ₹360+ (momentum continuation zone)
🏭 Fundamental Snapshot
Metric Value
Market Cap ~₹17,000 Cr
P/E (TTM) ~60×
P/B Ratio ~3.3×
ROE (TTM) ~9.7%
ROCE ~7.5–7.8%
Dividend Yield ~0.1%
Debt to Equity ~2.3×
Altman Z‑Score ~1.1 (suggests financial stress)
Free Cash Flow Negative (investing-heavy)
Business Highlights:
One of India’s top 10 renewable IPPs with 1.8 GW operational capacity and 3.25 GW under construction.
Strong pipeline with big wins such as battery storage orders & FDRE (firm/dispatchable renewables) projects.
Recent growth: Revenue ~₹15,750 Cr (+19% YoY), Net Profit ₹2,520 Cr.
Backing industry push into energy storage—recent 3.1 GWh BESS order supports diversification.
Key Risks:
High leverage (Debt/Equity >2×), low Altman Z‑score indicates stress.
Negative free cash flow due to capex into expansion.
Valuation steep: P/E ~60×, limited dividend yield.
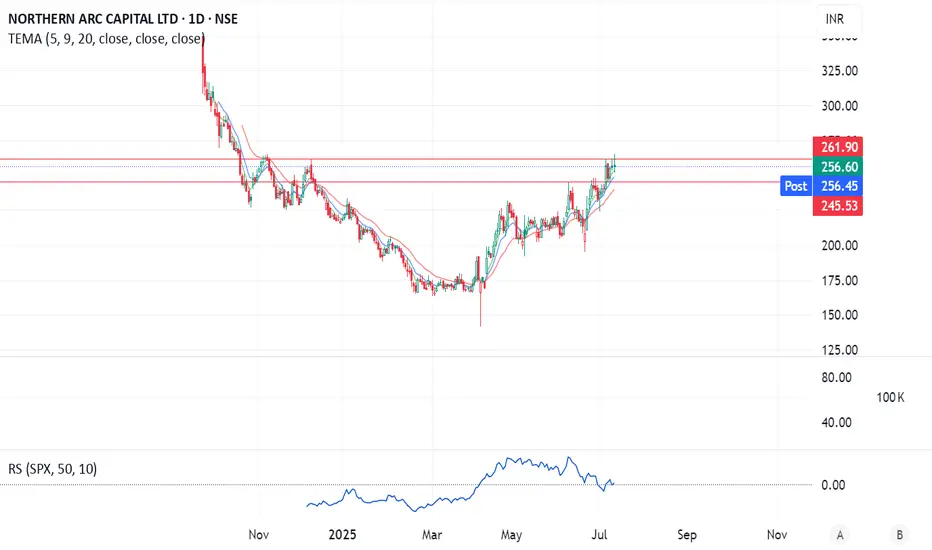
Positional setup for Northern Arc Capital Ltd (NSE: NORTHARC)Technical Analysis (Daily Chart)
CMP: ₹256.60
Structure: Recently broke above resistance around ₹245–255 on steady volume, with tight 5‑9‑20 EMA alignment signaling momentum shift to bullish.
Support Level: ₹245–250 (former resistance, now support).
Stop‑Loss: Daily close below ₹245.
Targets:
🥅 Target 1: ₹285 (next resistance)
🥅 Target 2: ₹320+
🏦 Fundamental Insights (Latest Numbers)
Metric Value
Market Cap ₹4,200 Cr (~₹4.1K Cr)
Screener
P/E Ratio ~12×
P/B Ratio ~1.2×
ROCE / ROE ~10% / ~12%
Net Profit CAGR (5Y) ~31%
Q4 Net Profit ₹47 Cr (Qs: ₹95 Cr → ₹47 Cr)
Dividends None currently
Interest Coverage Low—margin for higher finance cost
Summary: Northern Arc is a niche NBFC focusing on underserved credit. It offers strong growth (~31% profit CAGR) and attractive valuation (~12x P/E), but has limited dividend income and faces interest cost pressures.
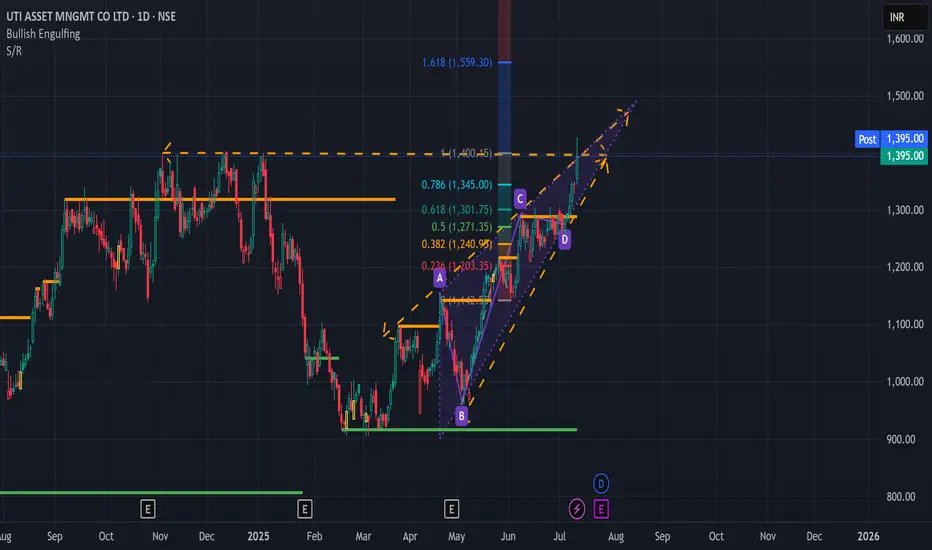
Going into Wave 4 for a predicted shallow retracement Going into Wave 4 for a predicted shallow retracement before wave 5 extending to 0.618 past wave 3 top (@$5.18)

UTIAMC in Multi Month BreakoutNSE:UTIAMC in Multi Month Breakout. You can enter at current Point. 1st target would be 1500 and with Trailing stop loss we can make a Second target of 1550.
CRC | Long | Strong Cash Flow | (July 2025)CRC | Long | Strong Cash Flow & Carbon Transition Story | (July 2025)
1️⃣ Short Insight Summary:
CRC is showing solid momentum as it combines strong cash flow from oil & gas with an expanding carbon capture strategy. Price action suggests a possible breakout on its second attempt at resistance.
2️⃣ Trade Parameters:
Bias: Long ✅
Entry: Watching current resistance zone closely on the 4-hour chart; money inflows confirmed on daily.
Stop Loss: Around $44 (invisible stop loss level to manage risk).
TP1: $53 💰
TP2: $57 💰
Partial Exits: Letting a portion run towards $63 for extended upside potential.
3️⃣ Key Notes:
We see strong institutional support, recent acquisition synergies from Aera Energy, and potential tailwinds from the Carbon TerraVault (CTV) project. Watch for volume confirmation and the upcoming Q2 earnings report on August 5, which could act as a catalyst. Be cautious of commodity price volatility and regulatory timelines for CCS projects.
4️⃣ Optional Follow-up Note:
Will monitor closely and share updates as the trade develops, especially if earnings significantly shift sentiment.
Please LIKE 👍, FOLLOW ✅, SHARE 🙌 and COMMENT ✍ if you enjoy this idea! Also share your ideas and charts in the comments section below! This is the best way to keep it relevant, support us, keep the content here free and allow the idea to reach as many people as possible.
Disclaimer: This is not a financial advise. Always conduct your own research. This content may include enhancements made using AI.

CWSM – LONG TRADE | 10 JULY 2025CWSM – LONG TRADE | 10 JULY 2025
CWSM previously traded in a distribution phase (light blue channel) before descending into a bearish downtrend (light pink channel). The price has now rebounded from an extreme low (blue line), forming a compelling long-term entry setup. The structure indicates a potential shift in control, with momentum building toward multiple quantified upside targets.
📢 Disclaimer: Do not copy or redistribute signals without prior consent or proper credit to The Chart Alchemist (TCA).
✨ Kindly support our efforts by boosting and sharing this idea!

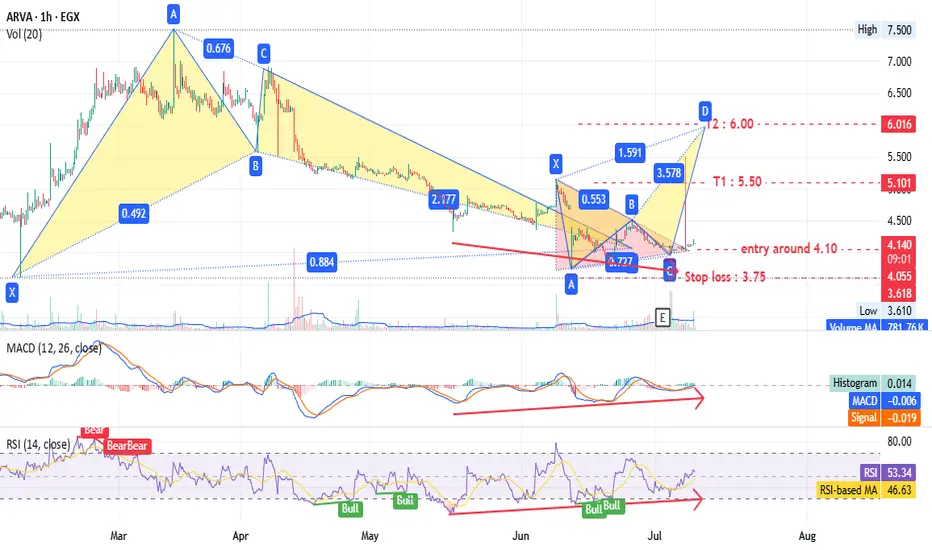
ARVA - many patterns give one target - Amazing EGX:ARVA timeframe 1 hour
Entry around 4.10
Stop loss at 3.75 (10% loss).
Targets at 5.50 and 6.00 (up to 44% profit).
Hourly chart shows a triangle pattern and bearish Gartley pattern.
Daily timeframe also indicates a bullish pattern with the same targets.
MACD and RSI support this analysis.
Note: This is not investment advice—only my analysis based on chart data. Consult your account manager before investing. Good luck!
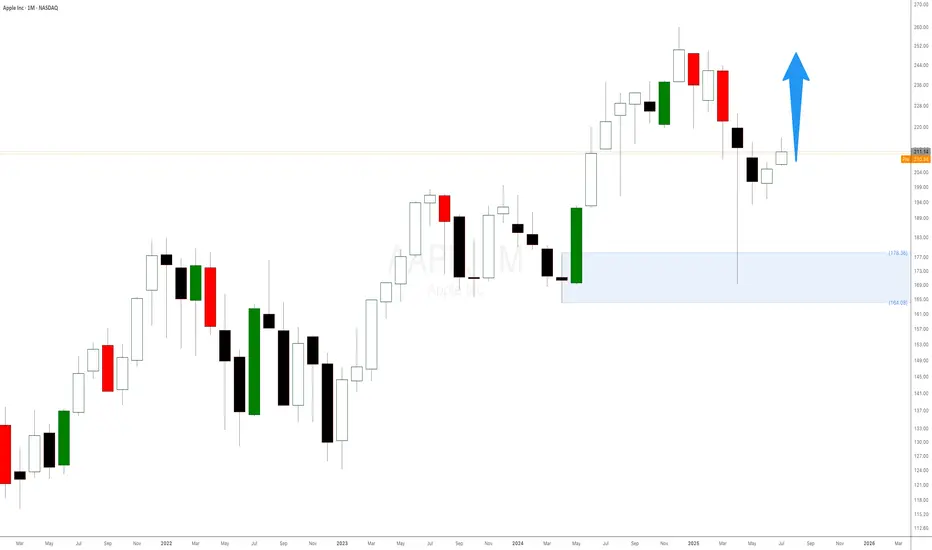
Apple Stock Is Surging! Here’s What Most People MissWhen it comes to trading, we don’t care about the latest news headlines or whether some analyst has upgraded or downgraded Apple stock. We focus on one thing and one thing only: the undeniable forces of supply and demand imbalances on higher timeframes.
Right now, Apple’s monthly chart is a textbook example of how waiting for a strong demand imbalance pays off. That $178 monthly level is no random number. It’s the exact origin of a massive bullish impulse that happened in June 2024 — the kind of move that only happens when smart money and big institutions step in, creating an imbalance that pushes the price away rapidly.
📈 It’s Not About Fundamentals. It’s About Imbalances.
Most retail traders waste time chasing news, earnings, or rumours about iPhone sales. But if you think about it, all those factors are already priced in once a strong imbalance is formed. Institutions don’t wait for tomorrow’s news — they plan their positions weeks or months ahead, and those footprints are visible right on your chart.
The $178 level indicates a significant drop in supply and a surge in demand large enough to propel Apple higher, marked by consecutive large bullish candlesticks. That’s our signal — nothing more, nothing less.
NVIDIA: Sell ideaSell idea on NVIDIA as you can see on the chart if only and only if we have the breakout with force the support line and the vwap indicator by a big red candle follow by a large red volume.

Nvidia Market Capitalisation Reaches $4 TrillionNvidia Market Capitalisation Reaches $4 Trillion
Yesterday, Nvidia’s (NVDA) share price surpassed $162 for the first time in history. As a result, the company’s market capitalisation briefly exceeded $4 trillion during intraday trading (according to CNBC), making Nvidia the first publicly listed company to reach this milestone.
The rise in NVDA’s share price is being driven by both bullish sentiment across the broader equity market—which appears optimistic ahead of the upcoming Q2 earnings season—and evidence of sustained demand for Nvidia’s products, as artificial intelligence technologies continue to gain widespread adoption.
Noteworthy developments include:
→ Nvidia may begin producing a specialised AI chip for the Chinese market this autumn, potentially circumventing current export restrictions;
→ Perplexity, a company backed by Nvidia, is launching an AI-powered browser aimed at competing with Google Chrome.
Technical Analysis of NVDA Chart
In our previous analysis of NVDA’s price action, we:
→ Drew an ascending channel;
→ Highlighted bullish conviction in overcoming the $145–150 resistance zone.
The channel remains valid, with the current price trading near its upper boundary. However, the RSI indicator is showing signs of bearish divergence, suggesting that the stock may be vulnerable to a near-term correction—potentially towards the median line of the existing upward channel.
At the same time, a major shift in the prevailing bullish trend appears unlikely. The $145–150 range may serve as a key support zone for NVDA in the foreseeable future.
This article represents the opinion of the Companies operating under the FXOpen brand only. It is not to be construed as an offer, solicitation, or recommendation with respect to products and services provided by the Companies operating under the FXOpen brand, nor is it to be considered financial advice.

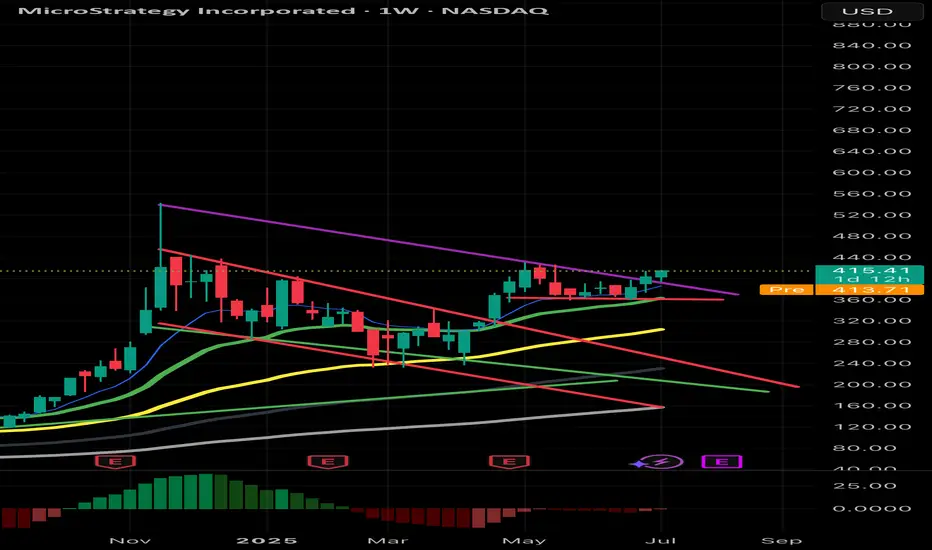
$mstr can’t get better than this setup Just look how beautiful the chart is. Breakout was imminent after waiting for the right time. This shows how effective the falling wedge pattern always gets out as a winner and everyone loves it because all bitcoin and related stocks mainly depend on falling wedge patterns. Trust the process!!
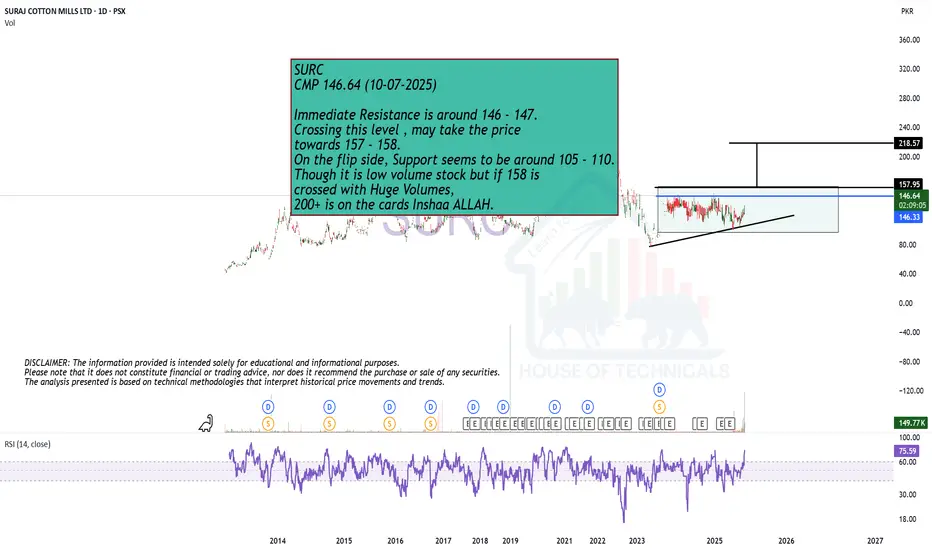
Breakout Expected.SURC
CMP 146.64 (10-07-2025)
Immediate Resistance is around 146 - 147.
Crossing this level , may take the price
towards 157 - 158.
On the flip side, Support seems to be around 105 - 110.
Though it is low volume stock but if 158 is
crossed with Huge Volumes,
200+ is on the cards Inshaa ALLAH.
$CLSK Resistance Ready to break?NASDAQ:CLSK is attempting to push above the resistance at $12.4 continuing the path from the recent analysis.
A breakthrough could push it rapidly to the High Volume Node resistance at $18.
Safe trading

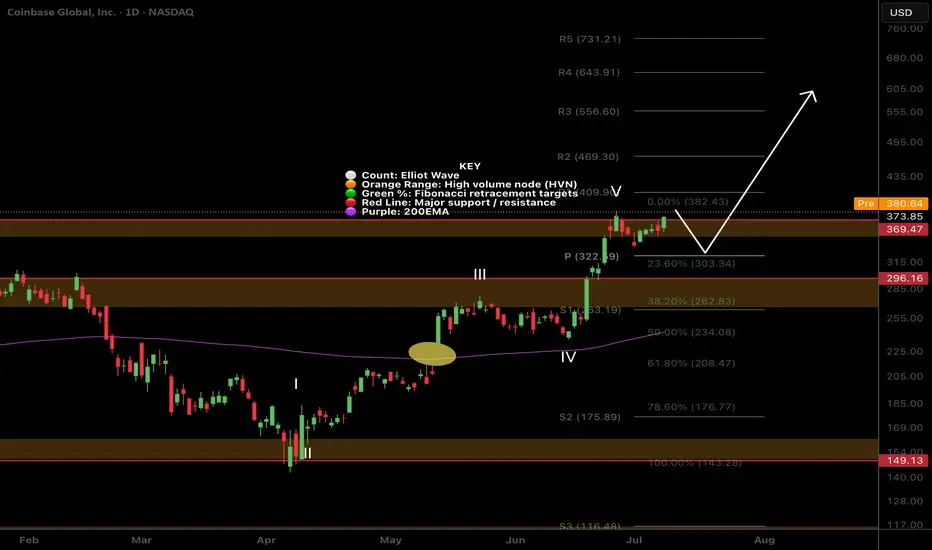
$COIN Price discovery?I was looking for a deeper pullback on NASDAQ:COIN but it appears to be heading into price discovery!
The pivot at $322 was my target but sentiment must be bullish if investors are impatient! Still... i wouldn't count out another sell off as a bear trap on a poke above the swing high.
Safe trading
FivnThe inverse head and shoulders pattern, combined with high volume, activates upon breaking above $30.36, targeting the $40 level.

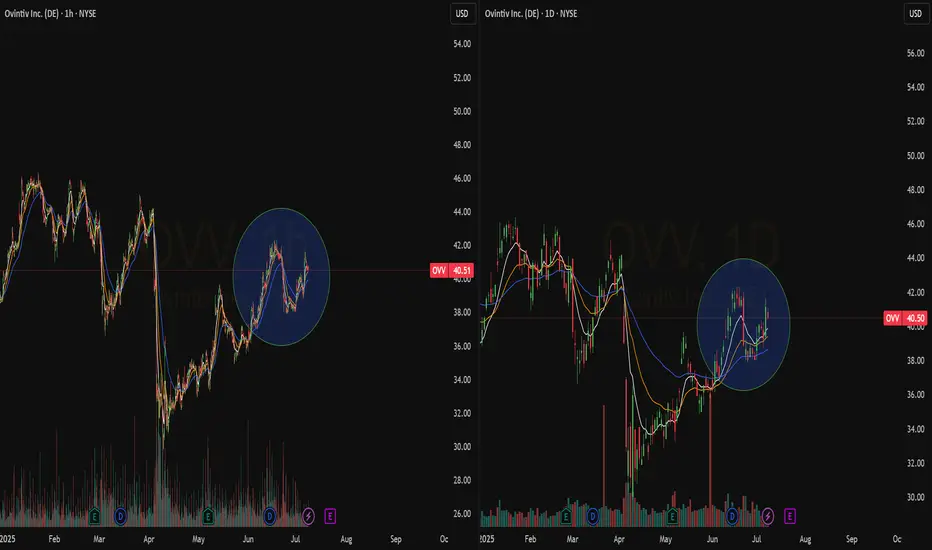
Quick View: $OVV- New bullish crossover in play confirmed by a nice pullback on the daily chart
- Waiting for some volume
$MARA at Resistance!NASDAQ:MARA continues its rally and has come into the High Volume Node resistance target and R2 daily pivot.
Daily 200EMA was tested as support after price smashed through. I expect continuation to the upside $24 target at the R5 daily pivot after some consolidation at this resistance.
Analysis is invalidated way below wave 2 at $13
Safe trading

Lupin At Best Support !! This is the 4 hour chart of Lupin .
Lupin appears to be forming a potential Three Drives bullish reversal pattern, with both drives terminating at the 1.27 Fibonacci extension level, indicating a possible exhaustion of the downtrend.
Lupin is trading within a well-defined descending channel. It has once again approached the lower boundary of the channel, which lies around the 1865–1880 zone, and is showing signs of a bounce.
If this level is sustain , then we may see higher prices in Lupin.
Thank You !!

$MSTR Continues on last weeks path!NASDAQ:MSTR continues to breakout above the channel after a retest as support.
High Volume Node at $440 may proof tough but if price breaks through we could see a strong FOMO induced breakout into price discovery.
Analysis is invalidated below the channel at $358.
Safe Trading

ALTN – LONG TRADE | 10 JULY 2025ALTN – LONG TRADE | 10 JULY 2025
ALTN has been in a prolonged downtrend with multiple selling climaxes on declining volume. After a Wyckoff-style stopping action, the stock marked a low of Rs. 10.40 and entered a consolidation phase within a light blue channel. The latest price action shows early signs of reversal, suggesting the beginning of an upward leg.
📢 Disclaimer: Do not copy or redistribute signals without prior consent or proper credit to The Chart Alchemist (TCA).
✨ Kindly support our efforts by boosting and sharing this idea!

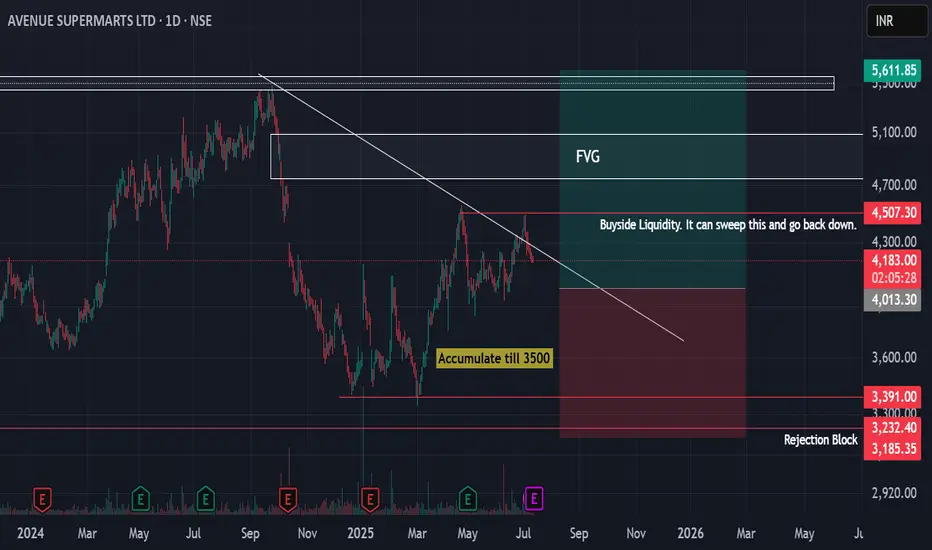
DMART Looking for some upside if everything goes smoothIn the short term, we can see a sweep of the buyside liquidity which has been marked.
For a longer term - atleast a year - one can accumulate for 5400-500 or higher levels.
A rejection block has been marked in case things go south
Hero MotoCorp — Daily Chart Breakout Trade SetupHero MotoCorp — Daily Chart Breakout Trade Setup
Range Bound: The stock has been consolidating between ₹4,170–₹4,400 for the past several weeks.
Structure: This is a classic rectangle consolidation, often a continuation pattern.
Volume: Watch for volume expansion on the breakout; prior breakouts lacked follow-through due to low volumes.
Higher Timeframe (Weekly/Monthly) charts show a bullish continuation since mid-May, with high-volume candles across weekly and monthly charts
Key resistance zones: Weekly resistance lies between ₹4,930–₹5,000.
Strong fundamental macro tailwinds: March sales show robust performance in both domestic ICE and EV segments (Vida)
🔍 Key Confirmation Signals for a Potential Trade
✅ Strong daily candle close above ₹4,420
✅ Above-average volume on breakout
✅ RSI crossing 60 on breakout adds momentum confirmation
⚠️ Risk Management Notes
Avoid early entry within the range (false breakouts possible)
Wait for EOD close above resistance for confirmation
Consider a trailing SL once the stock crosses ₹4,500

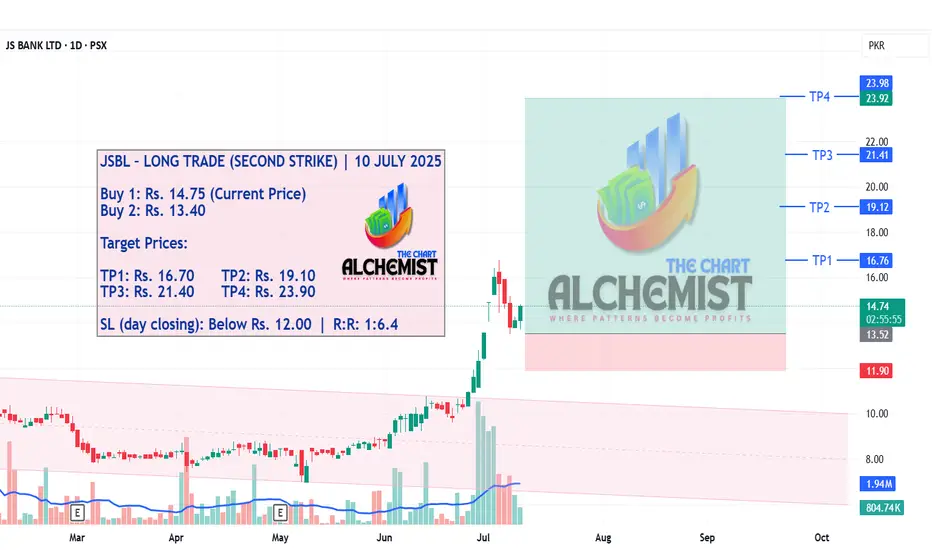
JSBL – LONG TRADE (SECOND STRIKE) | 10 JULY 2025 HIGH PRBABILITYJSBL – LONG TRADE (SECOND STRIKE) | 10 JULY 2025
We previously issued a successful buy call on JSBL that met all targets. Following a healthy pullback, the stock now looks primed for another upward move. The structure suggests a renewed wave of momentum, targeting fresh highs with an excellent risk-reward setup.