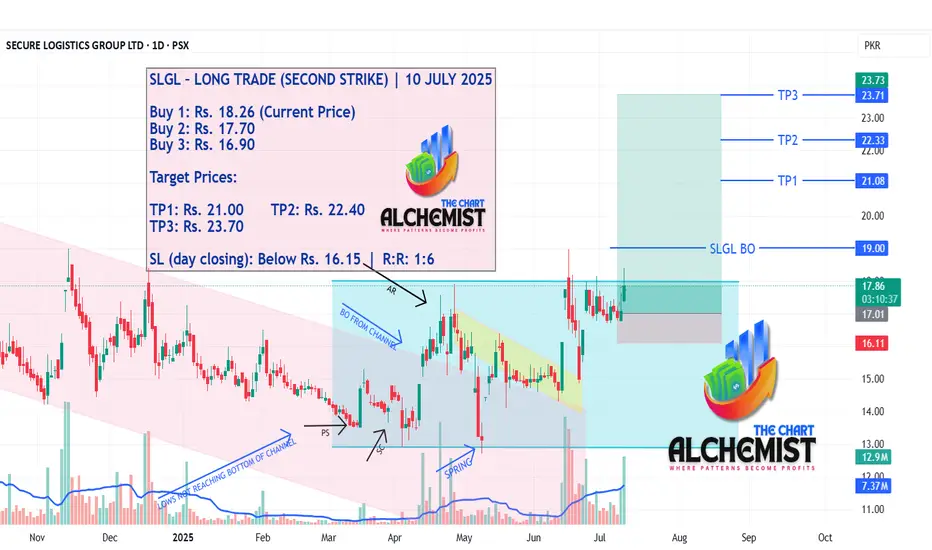
SLGL – LONG TRADE (SECOND STRIKE) | 10 JULY 2025SLGL – LONG TRADE (SECOND STRIKE) | 10 JULY 2025
Our previous buy call on SLGL achieved all targets within a single day. The stock has been trading in multiple embedded channels, with the most critical breakout emerging from a yellow channel. This breakout triggered a new uptrend, and the current setup presents another strong opportunity for a continuation move.
📢 Disclaimer: Do not copy or redistribute signals without prior consent or proper credit to The Chart Alchemist (TCA).
✨ Kindly support our efforts by boosting and sharing this idea!
Quick View: $AAPL- Great Crossover on the Daily chart with the ema9 and 21 that are moving above the ema50
- Consolidation area on the Hourly.

MAMATA - Head & Shoulder patternComment below what you observe in the chart.
All details are given on chart for educational purpose only. If you like the analyses please do share it with your friends, like and follow me for more such interesting charts.
Disc - Am not a SEBI registered analyst. Please do your own analyses before taking position. Details provided on chart is only for educational purposes and not a trading recommendation

SAGILITY 1D📈 Current Technical & Market Overview
Stock price: ₹43.95 – ₹44 range, with significant trading volumes (~38 million shares)
TradingView
+15
Moneycontrol
+15
The Economic Times
+15
52‑week range: ₹27.02 (low) to ₹56.40 (high – all‑time high)
Investing.com
+2
Investing.com
+2
ICICI Direct
+2
The stock is trading above all its key moving averages (5/20/50/100/200‑day), signaling strong bullish momentum
MarketsMojo
+1
The Economic Times
+1
🔍 Analyst Forecasts
TradingView consensus: ₹59 target (min ₹54, max ₹64)
Munafasutra
+3
TradingView
+3
Screener
+3
TipRanks consensus: ₹58.33 average target — ~33% upside
TipRanks
+1
Munafasutra
+1
AlphaSpread (Wall Street): Average ₹61.2, high-end ₹74.55 — suggesting up to ~68% upside
INDmoney consensus: ₹58.33 target — ~36% upside
Investing.com India
+10
Indmoney
+10
Trendlyne
+10
📰 Recent Events & Concerns
On May 27, 2025, promoter initiated a large stake sale (~₹2,671 Cr) via Offer For Sale, pushing the stock down ~5% to ₹40.70
Investing.com
+2
Investing.com India
+2
The Economic Times
+2
While this added short-term selling pressure, analysts remain optimistic given long-term fundamentals.
🧭 Outlook & Will It Break Its All‑Time High?
Technical strength: Strong upward trend and sustained high volumes – bullish short-to-mid term
Analyst price targets clustering in the ₹58–₹61 range: this would surpass the current high (~₹56), potentially setting a new all-time high.
Recent dip due to promoter selling is likely a short-term event, with support around ₹40–₹42 based on price history.
✅ Summary
Yes, Sagility India is showing strong signs of breaking its previous all-time high (~₹56).
Consensus analyst targets (~₹58–₹61+) imply room to run ~30–38% higher from current levels.
Risks remain: watch for promoter actions, macroeconomic changes, or sector-specific news.
🔎 What You Can Do Now
Watch support levels: ₹40–₹42 is a key short-term support zone.
Set target range: Entry near ₹44, aim for ₹58–₹60.
Monitor volumes & moving averages—continued high volumes above the 50/100 DMA would reinforce the uptrend.
Stay alert to news around promoter stake sale or earnings updates (Q1 performance expected soon).
Disclaimer: The information provided is for educational and informational purposes only and should not be considered as financial advice. Investing in the stock market involves risk, and past performance is not indicative of future results. Please consult with a certified financial advisor or conduct your own research before making any investment decisions. We are not responsible for any losses incurred as a result of using this information. Stock market investments are subject to market risks; read all related documents carefully.

TSLA BUY 253.8Recently, TSLA has maintained a volatile operation. Currently, we can pay attention to the area around 253.8 below, which is a potential buying position for a bullish Gartley pattern. At the same time, this position is within the previous demand area.

TAPG - VCP (11W 18/4 3T)IDX:TAPG - VCP
(+):
1. Low risk entry point on a pivot level.
2. Volume dries up.
3. Price has been above the MA 50 for over 10 weeks, with values exceeding 150, 200, and 300.
4. Price is within 25% of its 52-week high.
5. Price is over 30% of its 52-week low.
6. The 200-day MA has been trending upwards for over a month.
7. The RS Rating is above 70 (86).
8. There has been a significant breakout with substantial volume
**EPS Growth:**
a. Quarterly QoQ: -46.42%.
b. Quarterly YoY: +117.27%.
c. TTM YoY: +111.05%.
d. Annual YoY: +94.02%.
(-)
1. Trump Implements a 32% Increase in Tariffs on Indonesia
2. The market is volatile due to the ongoing war

SMCI - Bull Flag Breakout SetupSMCI formed a strong bullish impulse followed by a bull flag pattern.
A breakout above the flag structure may signal continuation if confirmed with strong price action.
Trade Plan:
• Entry: On breakout or retest
• Stop Loss: Below flag support
• TP1: Recent high
• TP2: Measured flagpole extension
This setup is worth monitoring for potential bullish continuation.
Disclaimer: This is not financial advice. For educational purposes only.

Using the New 2025 TradingView Screener to find Golden CrossesIn this video, I show you how to use the new TradingView 2025 screener to quickly find stocks forming a golden cross and how to add the 50 and 200 simple moving averages to your charts for clear visual confirmation. A golden cross happens when the 50 moving average crosses up through the 200 moving average. Many traders (both fundamental and technical) watch for this pattern as a sign that a stock (or even whole market) may be shifting from a downtrend to a new uptrend.
Using the TradingView Screener we can quickly find Golden crosses to help filter for potential momentum setups without having to scan hundreds of charts manually. They are not magic signals, but when combined with your own analysis, they can help you spot bigger picture trends that are gaining strength. I walk through step-by-step how to set up your screener to catch these crossovers and add them to your watchlist.
If you want to keep your trading process simple while still catching moves early, this is a practical tool worth adding to your workflow. I also show a few quick tips on how to clean up your filters to reduce the number of stocks you have to go through.
Hope you find this useful. Please like and follow if you do :)

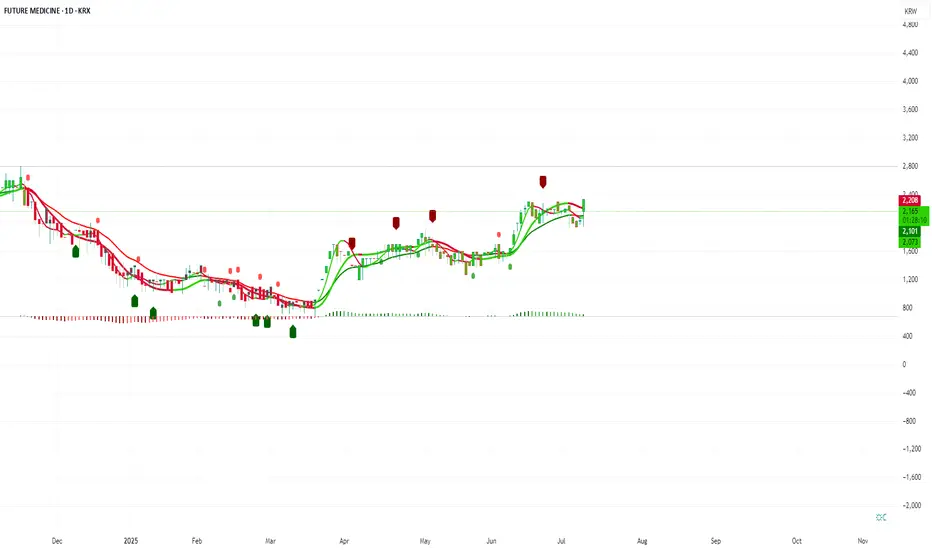
Walk This Way...This S. Korean company focuses on treatment of cystic fibrosis and chronic kidney disease, et al. Future Medicine, Limited.
Godspeed to this company as they search for cures for primary biliary cirrhosis; colorectal, prostate, and lung cancers and rheumatoid arthritis, et al. They target metabolic cancers, inflammatory and autoimmune diseases, to produce anticancer drugs, anti-fibrotics and antiviral remedies. Not only persistent, but painful diseases, as well. Who on earth wouldn't want this company to succeed ?
Selling Volume has completely Dried-up and the stock is in the process of setting Higher-Lows. MACD, StochasticsRSI, Rate-of-Change, and %r are all additive tenets of confirmation for the astute and intrepid investor.
Go Long.... it's at the 20... the 10... the 5... and Touchdown
AMBUJA CEMENT FOR SWINGA Good opportunity in Ambuja Cement for swing trade, weekly resistance break and retesting, so add in your watchlist.

$SGRY | Surgery Partners – Confirmed Breakout NASDAQ:SGRY | Surgery Partners – Confirmed Breakout
NASDAQ:SGRY has broken out of a tight consolidation base after reclaiming key EMAs and building momentum across multiple sessions.
Technical Breakdown
Confirmed breakout above $22.20 base with strong candle close and volume
RSI has pushed above 57 with trend momentum building
EMAs have flipped bullish, with price holding above the ribbon
Low-volume zone above allows room to trend toward next supply shelf
Targets & Structure
First target hit: $23.25 (+3.8%)
Next target: $24.50 (+9.7%) — aligns with previous structure and Fib confluence
Invalidation level: Breakdown back below $22
Strategy Insight
This is a classic breakout continuation pattern from a low-volume zone.
If momentum holds, price has room to push toward $24.50.
A clean backtest to $22.20 could present a lower-risk entry before the next leg up.

SMCI buy cycle in progress into yr endStrong buy rates on order flow indicating buy-side targets as follows
tp1 = 88
tp2 = 96
tp3 = 105
...by end of 2025
Still expecting strong sell wave sometime by mid-2026 all the way back to 20's as the semiconductor space continues dealing with growing bearish forces. Recent weakness should be seen as "shots across the bow" or warning shots. Next set of highs will be opportunities to EXIT and go short imo.

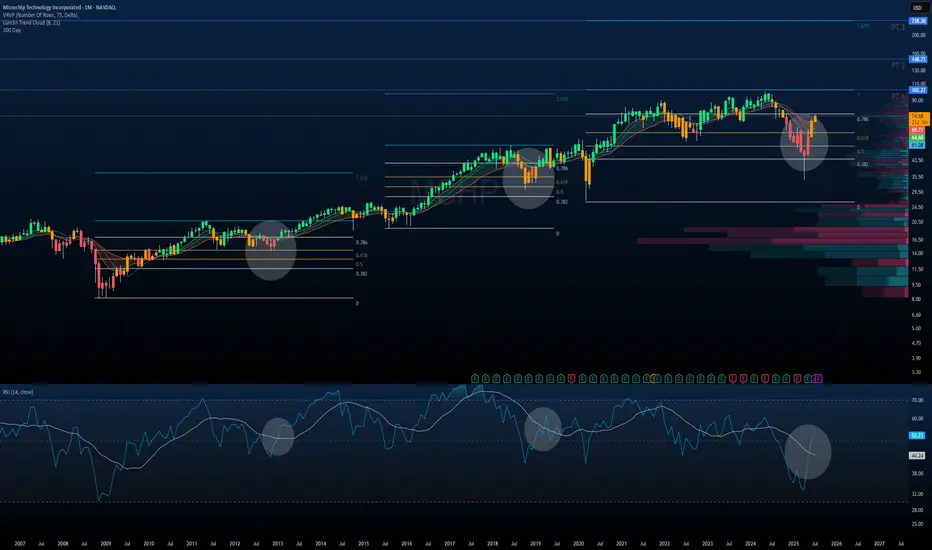
$MCHP | Microchip Technology — Monthly Macro PlaybookNASDAQ:MCHP | Microchip Technology — Monthly Macro Playbook
This chart illustrates the multi-decade rhythm of NASDAQ:MCHP , highlighting how past cycles and technical structure provide clarity on the current setup.
Historical Market Cycles & RSI Trends
Each gray circle marks a key market structure low with:
A bounce from macro Fibonacci retracement zones
A bullish RSI crossover through its signal line (white MA)
A recovery from oversold or mid-40 RSI levels, signaling trend reversal
We’ve now entered the fourth identical cycle dating back to 2009.
Current Technical Structure
Price just bounced off the 0.618–0.786 retracement zone from the 2020–2021 cycle.
Strong reversal candle printing off volume support, reclaiming major EMAs.
RSI is breaking through its signal line, just as it did in 2012, 2016, and 2019 — each of which led to multi-year rallies.
Fibonacci-Based Price Targets
Using prior extensions from similar fractals:
PT1: $102.77 — 1.0 extension of the last impulse
PT2: $148.71
PT3: $238.30
These are not short-term targets, but structural projections if this macro cycle repeats.
Macro Thesis
When price + momentum + Fib structure + RSI rhythm align like this, it usually sets the stage for multi-year compounding upside.
This chart doesn’t predict the future.
It just reminds us the past leaves footprints.
And NASDAQ:MCHP ’s footprint says: “This is where cycles begin.”
ADBE PUMP soonGood day traders!
As I See ADBE is in leading diagonal wave 1.
Currency, we are in wave correction2
And the price will go in wave 3 which i expect impulse wave the target as shown in chart y←
Good luck for all

4H Chart: How Meta's Double Top Turned Into a Reversal Buy How Meta's Double Top Turned Into a Reversal Buy Signal on the 4H Chart
Meta Platforms Inc. (META) recently formed a classic double top pattern, which is often interpreted as a bearish reversal signal.
The price touched a key resistance level twice and then pulled back, triggering caution among technical traders. However, the
stochastic RSI on the 4-hour timeframe is now flashing a potential reversal buy signal that could shift market sentiment.
This hidden momentum may catch short sellers off guard. Here’s a breakdown of the setup:
Technical Breakdown
1. Double top formation
Resistance was tested two times, forming a temporary ceiling.
Typically, this signals a possible trend reversal.
However, there has been no strong bearish follow-through after the second top.
2. Stochastic RSI buy signal on the 4H chart
The %K line has crossed above the %D line in oversold territory.
This suggests a potential bullish reversal.
RSI is also recovering from a low zone, pointing to increasing buying pressure.
3. Support is holding
The neckline of the double top remains unbroken.
Price action shows higher lows forming just below resistance, a bullish sign.
Strategy Outlook: Contrarian Reversal Play
While the double top suggests weakness, the stochastic RSI indicates a rebound. Traders may be witnessing a bear trap, where the market tempts sellers before reversing higher.
If the price moves above both the 50 EMA and 200 EMA on the 4-hour chart, it could trigger what some i call a rocket booster setup —strong upside momentum backed by moving average alignment.
A bullish confirmation candle with volume could solidify the reversal case.
Conclusion
Meta’s chart pattern might look bearish at first glance, but momentum indicators tell a different story. A reversal from here could lead to a breakout if bulls step in with strong follow-through.
Disclaimer: Trading is risky. Use a simulation trading account before you trade with real money and learn risk management and profit-taking strategies.
---

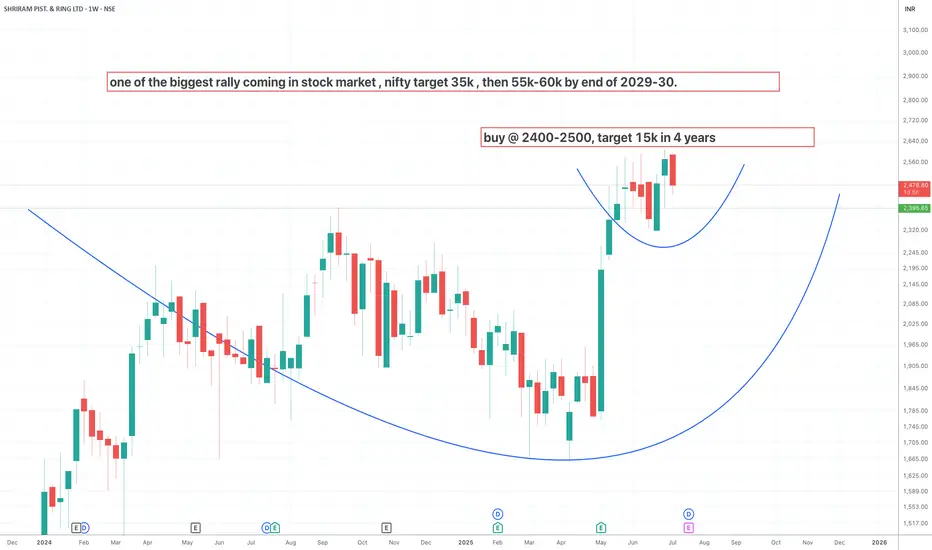
shriram piston buy at cmp 2500, target 15,000buy shriram piston at cmp , lomng term target 15,000 in 3 years.
cup and handle
INDIGO READY TO FLYINDIGO is nearing to all time high and now ready to FLY to make new Higher Highs.

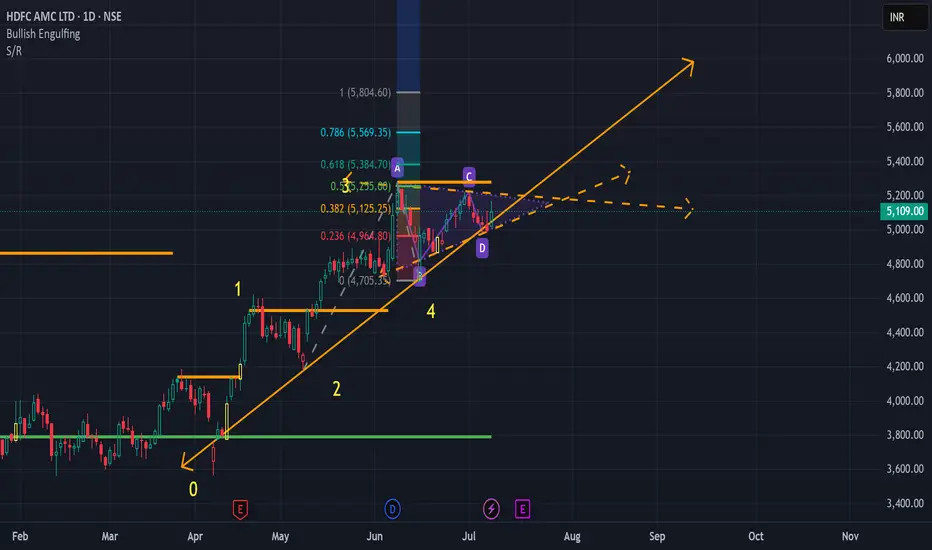
HDFCAMC in Pennant Trend PatternNSE:HDFCAMC shows a breakout of a Pennant Trend Pattern. Please Buy once there is a Bullish breakout. Target would be 5750
How to Use TradingView Alerts to Catch Momentum Shifts Here’s a quick video on setting alerts in TradingView.
I use alerts for stocks I’m interested in but want to give more time to set up. Instead of using a basic price alert, I prefer setting alerts on MACD crossovers to signal when momentum is shifting back in my favor. As a rule of thumb, the deeper the crossover, the better the value and potential momentum. Crossovers below the MACD zero line are particularly useful, especially for stocks that had strong momentum and were making new highs before pulling back.
This approach helps confirm that the stock has had time to build a solid base before I enter. TradingView will then send me an email alert or play a chime if I have it open, letting me track multiple stocks and setups without constantly checking charts. It’s also great for monitoring take-profit and stop-loss levels.
You can apply the same strategy with nearly any indicator on TradingView to time your entries and exits with more confidence.

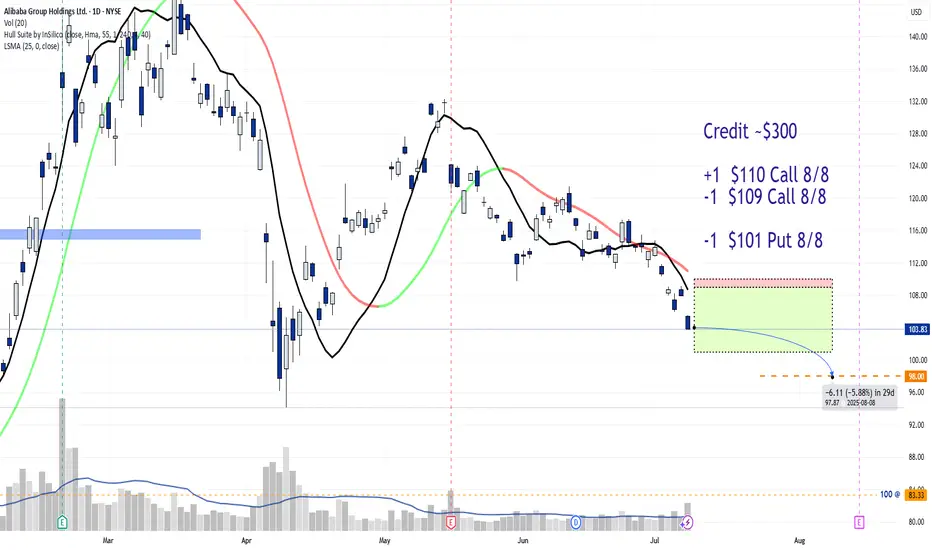
JADE LIZARD Trade for an Aug 8th expirationCredit ~$300
+1 $110 Call 8/8
-1 $109 Call 8/8
-1 $101 Put 8/8
AT EXPIRATION:
PRICE > $110 = profit of $200
PRICE between $101-$109 = profit of $300 (max)
PRICE < $101 = Assigned to purchase 100 shares of BABA @ $98 per share, (avg cost).