DHUNSERI TEA & IND. LTD. swing/ Positional Trade opportunity### 📌 Positional Swing Trade Idea – DHUNSERI TEA & IND. LTD (DTIL) | Cup & Handle Pattern Forming
DHUNSERI TEA & INDUSTRIES LTD (NSE\:DTIL) is forming a classic **Cup and Handle** pattern on the daily chart, indicating a potential bullish breakout opportunity.
🔍 **Technical Highlights:**
* The cup is well-rounded, indicating strong accumulation over time.
* The handle is forming as a short consolidation/pullback, typical before a breakout.
* Price is approaching the **neckline resistance**, which if broken with volume confirmation, can signal a strong upward move.
📈 **Trade Setup:**
* **Breakout Zone:** Watch for a breakout above the neckline with volume.
* **Support:** Handle base acting as support.
* **Target:** Measured move based on cup depth offers a healthy upside.
This structure suits **positional and swing traders** looking for breakout trades with a defined structure and favorable risk-reward.
⚠️ **Disclaimer:** This idea is for educational purposes only. Please do your own analysis before making any trading decisions.

Exail Technologies European Drone Warfare and Robotics. Exail Technologies (previously Groupe Gorge S.A.) is a French tech company specializing in drones, robotics, and maritime autonomous systems, with growing exposure to defense and industrial markets.
It’s on a clear uptrend, sitting well above its 50 and 200-day EMAs with momentum firmly in play. Volume is steady, with recent trading activity picking up compared to its long-term averages, reflecting consistent investor interest.
If you’re looking for a high-growth, high-momentum play in the drone warfare / European tech space, Exail is showing strength. Just keep an eye out for a pullback, which could offer a cleaner entry without chasing the current highs.
Might be worth a watch.

AMSC eyes on $40.18: Golden Genesis fib holding up new ATHAMSC has been bobbing into a Golden Genesis fib at $40.18
Look for a Break-n-Retest to start next leg of uptrend.
Beware of a possible rejection for a high velocity dip.
.
Previous Analysis that gave a PERFECT SWING trade:
Hit the BOOST and FOLLOW for more such a PRECISE and TIMELY charts.
==============================================================
.

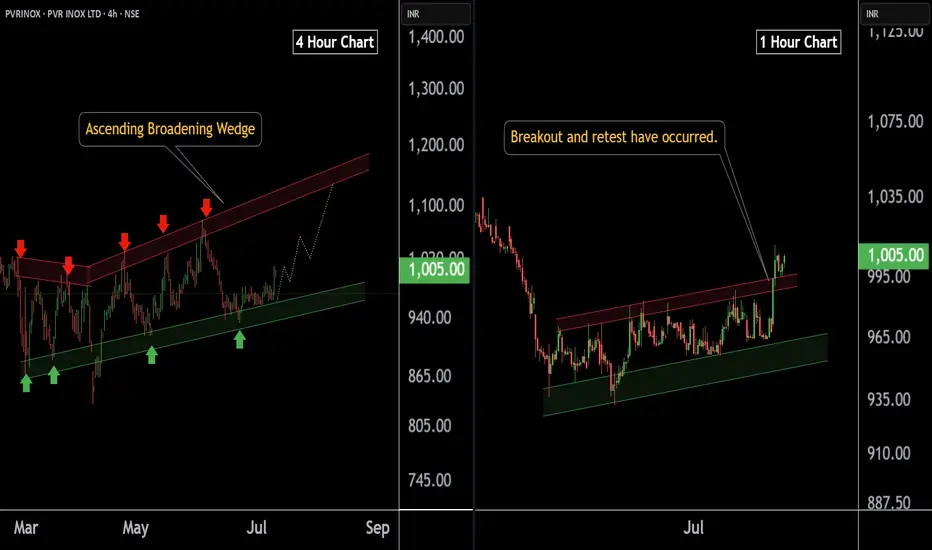
PVR INOX LTD at Best Support !! Breakout Alert !!Here are two charts of PVERINOX — one in the 4-hour timeframe and the other in the 1-hour timeframe.
4-Hour Timeframe Chart:
In the 4-hour timeframe, Power Inox is respecting its lower boundary, with a support range between 930–950.
ChatGPT said:
1-Hour Timeframe Chart:
In the 1-hour timeframe, the stock has given a breakout and has now completed a retest at 980-990 level.
If this level is sustain then , we may see higher in PVRINOX.
Thank you !!
IBKR watch $57.42-58:19: Double Golden Fib zone holding in OrbitIBKR has been in a strong uptrend but now consolidating.
Currently orbiting a Double Golden zone $57.42-58.19
This could be a TOP or a ReCharge zone for next leg.

VOLTAS In breakoutNSE:VOLTAS in breakout. As it approaches the key level of 1390, I recommend buying once it decisively crosses that threshold. With bullish momentum building, we can set our sights on the first target at 1480 and an ambitious second target at 1565!
Remember, investing requires careful analysis and risk management. Stay informed, and let’s navigate this market together! What are your thoughts? Are you eyeing VOLTAS or any other stocks for potential growth? Let’s discuss in the comments below! 💬💰 #StockMarket #InvestmentStrategy #VOLTAS #BreakoutTrading

Analyzing the Bearish Trend in $COIN with AI & Smart Money Insig📅 Posted on July 8, 2025 by WaverVanir International LLC
Today, our advanced predictive model highlighted a potential short-term decline in NASDAQ:COIN (Coinbase Global Inc.), leveraging AI-driven forecasts and Smart Money Concepts (SMC) analysis to validate the trend.
📊 Insights from AI Model:
- Current Price: $353.30
- Expected Movement: Decline to $284.67
- Confidence Level: 60%
- Timeframe: 1 hour
📉 Noteworthy Observation:
- VolanX Alpha Layer detected a significant -19.42% probability spike.
📉 SMC Analysis Overview:
- Identified distribution pattern in premium zone
- Rejection of weak high levels
- Anticipated liquidity gap below equilibrium point ($306.10)
- Imbalance in volume profile awaiting resolution
🧠 Key Takeaway:
The alignment of AI predictions and market structure signals a substantial institutional impact. WaverVanir remains proactive in the face of volatility, strategically reallocating resources based on high-probability scenarios.
⚠️ Risk Advisory:
Kindly note, this information is not financial advice but derived from our internal Decision Support System (DSS) and AI technologies. It is essential to prudently manage position sizes and account for potential scenario variations.
📡 Connect with WaverVanir for further insights into market dynamics, strategic signals, and structured trading approaches.
#WaverVanir #COIN #VolanX #SmartMoneyConcepts #AITrading #InstitutionalEdge #MarketStructure #LinkedInFinance #TradingAI #DSS #LiquidityHunting

CMG watch $55.76: Golden fib maybe good support for Next Leg UPCMG trying to recover from loss of CEO and tariff worries.
Uptrend showing signs of strength, retesting a key support.
$55.76 a possible long entry with $54.84 fib for stop loss.
.
Previous analysis that caught THE BOTTOM:
====================================================
.

Pop Mart Rockets 600%, Riding Labubu Hype and Overseas SalesPop Mart International Group Ltd has shown remarkable growth, driven by the popularity of its Labubu collectibles and strategic IP collaborations.
The stock has surged nearly 600% over the past year, supported by strong overseas revenue growth (183% YoY) and celebrity endorsements. However, regulatory risks from China's potential crackdown on blind-box toys pose short-term volatility.
HSBC raised its target price to HK$331.5, citing robust sales potential, while Morgan Stanley removed it from its focus list.
The company's cultural initiatives, like the DIMOO-themed aircraft, highlight its cross-cultural appeal, making it a high-growth but high-risk play.
Might be worth a look.

WENTEL TRY TO TELL SOMETHING?Chart - downtrend
If the price breaks 0.33 with high volume, this counter can be put in watchlist.
Entry: No entry yet. Just wait & see

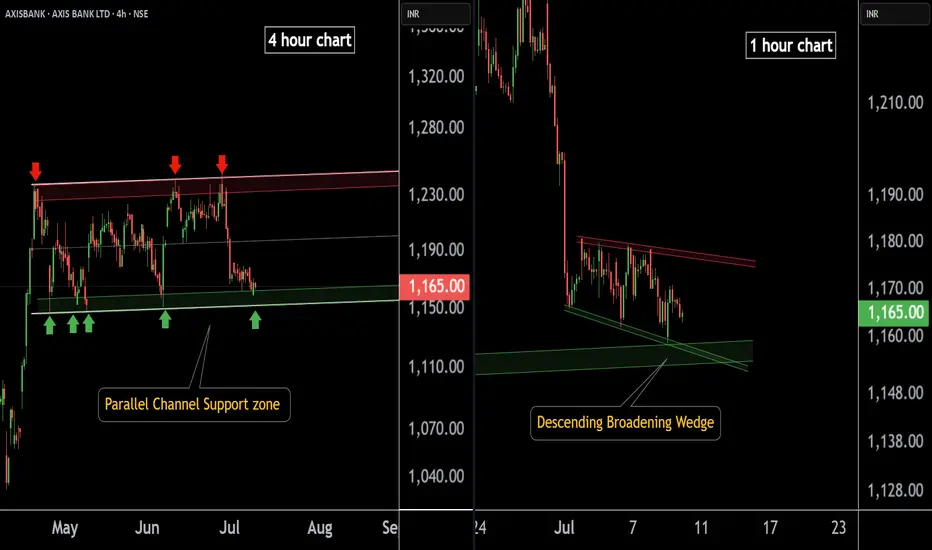
AXIS BANK at Best Support !!Here are two charts of Axis Bank — one in the 4-hour timeframe and the other in the 1-hour timeframe.
4-Hour Timeframe Chart:
In this chart, Axis Bank is moving within a parallel channel, with the support zone lying in the 1150–1160 range.
1-Hour Timeframe Chart:
Axis Bank is forming a descending broadening wedge pattern, with support near the 1150–1155 zone.
If this level is sustain ,then we may see higher prices in Axis Bank.
Thank You !!
OSK eyes on $125.42/52: Double Golden Fibs likely to Orbit a bitOSK has been rising with the market and industrials.
It is hst just hit Dual Golden fibs at $125.42-125.52
Expecting a few orbits and possible dip from here.
.
This pair of Fibs called THE PREVIOUS TOP:
.
The smaller Golden Sisters also called THE BOTTOM:
Hit the BOOST and FOLLOW for more such PRECISE and TIMELY charts.
=============================================================
.

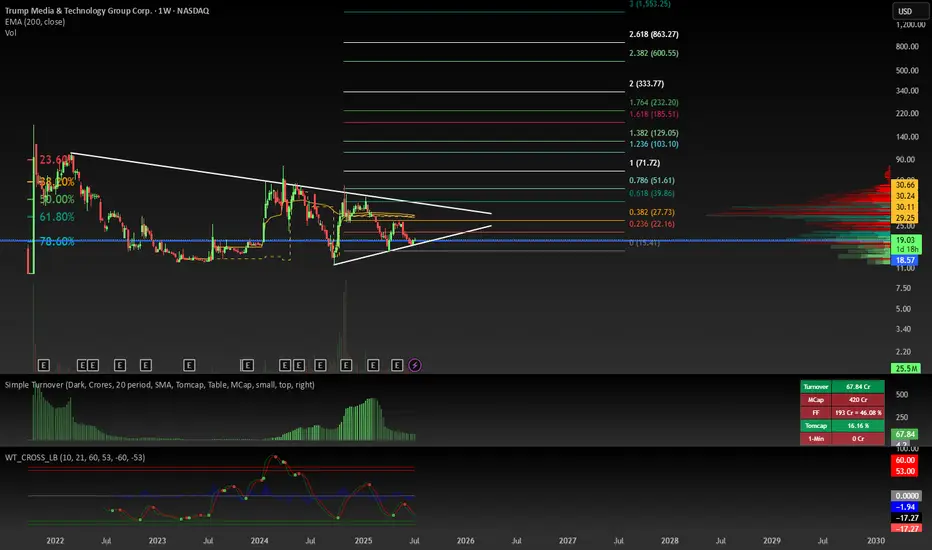
$DJT You May Not Like It But It Will Go Up🟢 Why someone might buy DJT stock
Massive buyback plan – Recently approved a $400M buyback (≈10% of shares) using non-crypto funds, signaling confidence in its value
Aggressive Bitcoin playbook – Raised ~$1 B in convertible bonds to fund a $2.5–3 B Bitcoin reserve, tapping into the crypto surge .
Election-fueled volatility – Historically sees surges tied to political events (e.g., 18% spike pre-election)
Tight float, big upside potential – Low institutional ownership, huge insider/trust holdings = a thin float that could exaggerate price moves
Technical momentum in play – Short-term MACD and pivot bottom “buy” signal recently triggered
🏦 Bond offering — Low-risk lender perks
DJT issued zero-coupon convertible senior secured notes due May 29, 2028:
$1B principal @ 4% discount (≈$960M net proceeds)
Secured by Bitcoin + cash collateral, with strict collateral ratios (loan must remain ≤ value) .
Conversion feature at $34.72/share (≈135% premium to current price!)—if price hits that, investors can convert to equity
Optional early repurchase right in Nov 2026 (~18 months in)
✨ Why it’s a fun but risky play
High-reward setup: A small bet now, big upside if crypto rally unfolds or DJT stock surges due to political or earnings catalysts.
Upside triggers: Successful Bitcoin accumulation, buyback impact, user growth of Truth Social/Truth+.
Risks remain: Bleak fundamentals—massive losses, minimal ad revenue, and little institutional backing
🎯 In summary
DJT is not for the faint of heart—it blends political buzz, crypto ambition, and strategic capital moves. If you believe in Bitcoin’s next wave, see value in the stock being repurchased, and buy the narrative—and you're okay braving volatility—this play could pay off big.
I had Ai organize some thoughts lol. I will see you at 30 :)
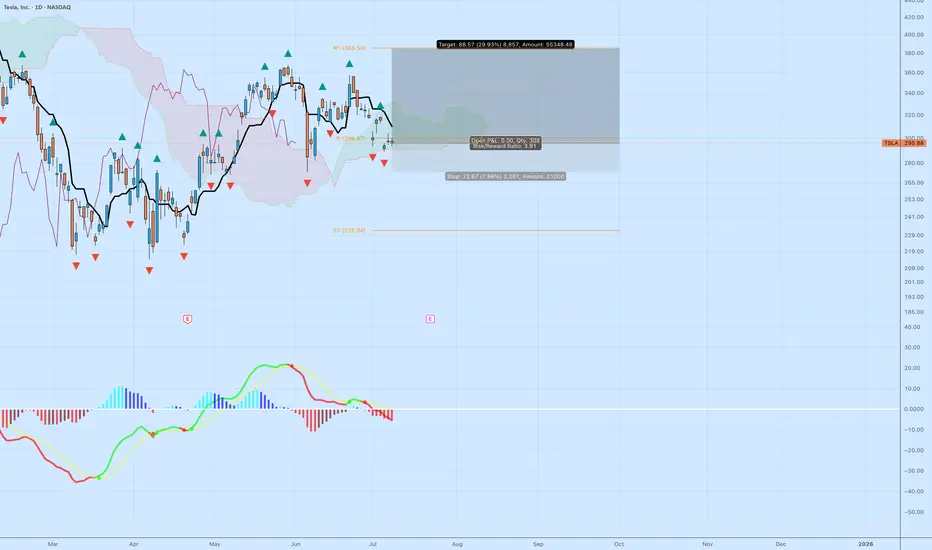
TSLA: High R/R Bounce Play Off the Cloud EdgeTesla NASDAQ:TSLA is sitting at a decision point — testing the edge of the Ichimoku cloud while momentum resets. The setup isn’t confirmed, but the risk/reward is compelling for those watching structure.
🔍 Technical Breakdown
Cloud Support: Price is holding right at the top of the cloud. A breakdown would signal trend weakness, but for now, it's a potential bounce zone.
MACD: Momentum has cooled off, but no bullish crossover yet. Early signs of a flattening histogram could suggest a pivot.
Structure: Horizontal support near $292–295 has held multiple times. If this zone holds again, the upside target opens up quickly.
🎯 Trade Specs
Entry: $296.88
Target: $385.50 (+29.93%)
Stop: $274.21 (–7.66%)
Risk/Reward: 3.91 — solid asymmetry
💡 Trading Insight:
This isn’t about calling bottoms — it’s about defining risk. When price compresses at known support, and you’ve got a 3.9 R/R profile, you don’t need to be right often to be profitable.
Mean Reversion Trade: $LIN1. RSI in oversold region
2. Price likely to rebound back the the mean
Trade Rules:
Entry Trigger - RSI has cross below oversold region, enter limit buy at close price
Exit Trigger - Close at market when close price is cross above exit trigger (Red step line)

TGT: Breakout From a 6-Month Base — Structure, MomentumThis NYSE:TGT setup is a great example of how structure + signal alignment can give traders a clean, high-probability play without chasing hype.
🔍 Breakdown: Why This Setup Matters
6-Month Base Breakout
Target spent half the year building a rounded base just below the Ichimoku cloud. The breakout above $100 is more than a number — it’s a psychological + structural shift. Buyers are finally in control.
Ichimoku Confirmation
Price cleared the cloud with a bullish TK cross weeks ago. Now, we’ve broken R1 pivot resistance and are sitting cleanly above the cloud. The trend is now officially flipped.
MACD Momentum
The MACD has been rising steadily, supporting the move. Green bars are growing in strength — no divergence or fade.
Risk/Reward
Entry: $102.43
Target: $127.07 (+23.31%)
Stop: $94.09 (–8.14%)
R/R: 2.87 — not extreme, but solid and realistic

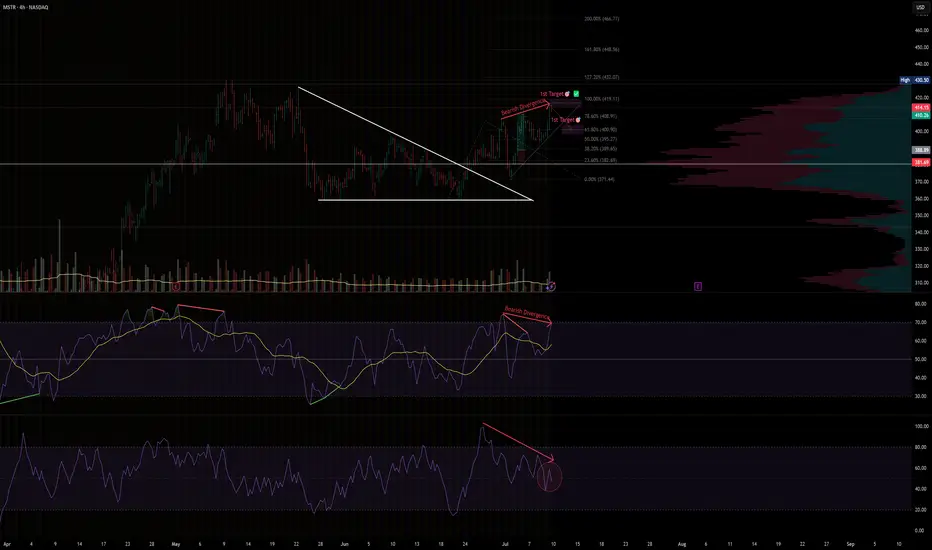
MSTR · 4H —Early Bearish Divergence Detected Near Key Fib TargetSetup Breakdown
Price recently broke out from a falling wedge and hit both technical targets — first at ~$409 (78.6%) and then ~$419 (100%).
However, momentum is weakening despite price hovering near the highs.
We're now seeing early bearish divergence on multiple timeframes and oscillators, signaling potential reversal or pullback.
⚠️ Bearish Signals
RSI Divergence
Price made higher highs while RSI made lower highs — classic bearish divergence.
Double confirmation
Both RSI with MA and pure RSI show declining momentum.
Volume drop
Price is rising but volume is not following — another early warning sign.
🔻 Potential Breakdown Trigger
If price closes below $407–405, that would break short-term structure and confirm the divergence risk.
Watch for RSI to drop below 50 and volume to spike on red candles — that would likely accelerate the correction.
📉 Downside Zones to Watch
$400
=> 61.8% Fib retracement + consolidation base
$395
=> 50% Fib retracement
$389
=> 38.2% Fib retracement + prior breakout support
✅ Summary
Divergence is still early but meaningful — momentum does not support current price highs.
A breakdown from current levels could open a short window down to $386 or even $371 if confirmed.
Watch RSI + volume + candle structure for confirmation before acting.
Disclaimer: This is not financial advice. Always manage your own risk and follow your trading plan.
#MSTR #BearishDivergence #RSI #Fibonacci #MomentumShift #VolumeAnalysis #TradingView #TechStocks #4HChart
NKE Pullback-I'm Buying the DipNike (NKE) is under pressure — post-earnings volatility, macro noise, and sentiment all weighing in. But for swing traders, this looks like a textbook accumulation setup.
📌 Entry Zones I’m Targeting:
🔹 $70.00
🔹 $65.00
🔹 $60.00
Profit Targets (Taking wins before 88):
✅ $78.80
✅ $82.50
Let the market come to you — no chasing, just precision.
💬 Drop your thoughts below — are you buying NKE here or waiting for blood?
Disclaimer: This post is for informational and educational purposes only. It does not constitute financial advice or a recommendation to buy or sell any securities. Always do your own research and consult with a licensed financial advisor before making any investment decisions. Trading involves risk, and past performance is not indicative of future results

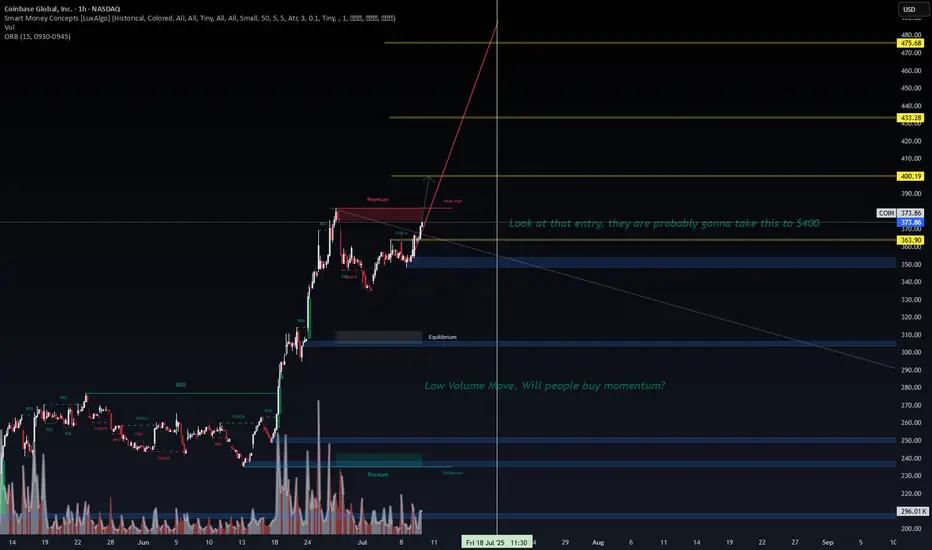
$COIN – Smart Money Lining Up a $400 Magnet?📈 NASDAQ:COIN – Smart Money Lining Up a $400 Magnet?
Narrative:
After a clean BOS (Break of Structure) and multiple CHoCHs (Change of Character), NASDAQ:COIN has reclaimed premium territory with precision.
What’s more telling?
➡️ The recent low-volume accumulation followed by a sharp breakout into the prior supply zone.
📌 The entry zone (highlighted) was surgical—likely smart money loading long exposure just below $365.
You don’t get that kind of entry without intent.
🔍 Technical Highlights:
Price reclaimed the weak high and flipped it into a potential continuation breakout.
Next clear magnet = $400 psychological + liquidity level
Volume behavior = “low-volume push” → likely testing market’s willingness to chase momentum.
🧠 AI System Insight:
While my LSTM model initially flagged this zone as exhaustion (which led to my prior failed put play), options flow and structure now confirm:
→ The market is likely rotating toward bullish momentum.
"Look at that entry… they’re probably gonna take this to $400."
⚠️ Watchlist Considerations:
Volume surge + price above $380 = confirmed squeeze
Failure below $365 = trap → back to EQ or discount zones
Options traders are bidding → flow supports bullish continuation
📌 I’m not in this trade yet—but watching for either a breakout confirmation or pullback retest for entry.
Don’t fade the strength unless you see absorption + reversal candle.
—
Prabhawa Koirala (Pravo)
Founder – WaverVanir International LLC
#COIN #SmartMoneyConcepts #OptionsFlow #Breakout #LSTM #VolumeAnalysis #WaverVanir #TradingViewIdeas
$COIN – Smart Money Short Setup (15m)🚨 Bias: Bearish
📍 Reason: Clean CHoCH + BOS structure break from premium supply zone. Price swept liquidity and rejected equilibrium near 358–359, confirming internal weakness.
🧠 SMC Insight:
Multiple CHoCHs show internal break in bullish structure.
Rejection from equilibrium zone = smart money redistribution.
BOS confirms intent to push toward untapped liquidity below.
📊 Volume Profile:
Spike in red selling volume = aggressive seller interest.
Low-volume node around 351–352 = likely drawdown zone.
Major demand/accumulation zone sits at 337–338 with “Strong Low” tag.
🎯 Trade Plan:
🔽 Entry: 357.50–358.50 (on retest)
❌ Stop: Above 360.00
✅ TP1: 351.50
✅ TP2: 337.50 (major demand)
⚠️ Risk: Moderate
🧠 Tip: Monitor BTC/ETH weakness for confluence.
🧬 Powered by WaverVanir DSS – Institutional Trade Engine
#SMC #Coinbase #COIN #VolumeProfile #LiquiditySweep #WaverVanir #TradingView #SmartMoney #AlgoDriven #Quant #InstitutionalOrderFlow

$COIN Options Trade Blunder | AI vs. Flow — Who Wins?NASDAQ:COIN – When LSTM Confidence Misfires at the Top
This week I entered puts on NASDAQ:COIN off a 95% confidence signal from my LSTM model, anticipating a bearish reversal near the premium zone.
It looked clean:
🔺 Price had tapped a weak high
📈 Extended rally from discount to premium
🧠 LSTM model flagged a local exhaustion top
But I ignored the bullish options flow.
Institutions were loading calls.
Volatility structure showed strength.
I chose the model. The market chose pain.
📉 Trade Setup:
Short thesis: Rejection from premium + weak high
Entry: $370 zone
Target: $325 (mid EQ)
Invalidation: Break above $380
Actual Result:
Price consolidated, then held bullish structure.
Implied volatility stayed elevated. No follow-through on the short.
Loss: ~50% on puts.
💡 Lesson:
Chart logic aligned
AI signal was compelling
But real-time flow > model output
LSTM is 70% of my AI trading system, and I’m now integrating options flow override filters to prevent this kind of mismatch in future signals.
📌 I’m currently risk-off, rotating capital into 5Y Treasury futures ($Z) to cool down, refine logic, and reassess volatility pricing models.
🧠 This phase is experimental. If you’re watching my trades – don’t follow. Observe. Learn from the debug phase.
—
Prabhawa Koirala (Pravo)
Founder – WaverVanir International LLC
#COIN #TradingView #SmartMoneyConcepts #LSTM #AITrading #OptionsFlow #WaverVanir #PremiumZone #QuantTrading #VolanX

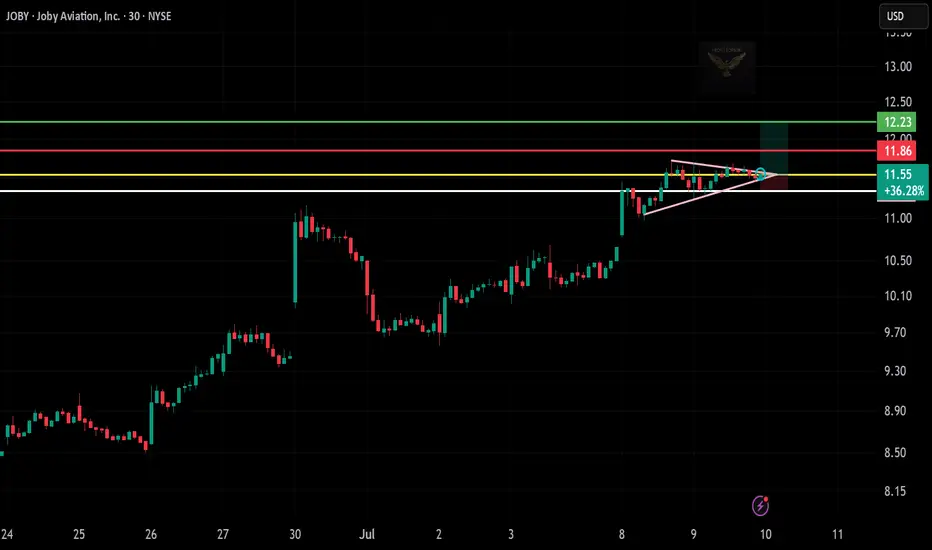
$JOBY Long Trade Setup – July 10🚀
Price coiled up in a tight pennant — and broke out right on time. Trendline support is intact, and momentum is building.
📌 Entry: $11.55
🎯 Target: $12.23
🛑 Stop Loss: Below $11.30
⏱️ Timeframe: 30-min chart
🔍 Why I Like This Trade:
Bullish pennant breakout with solid trend support
Holding strong above previous resistance now turned support
Price action shows continuation potential after consolidation
✅ Disciplined setup, clean structure, good R:R.
This is how confidence builds—one trade at a time.
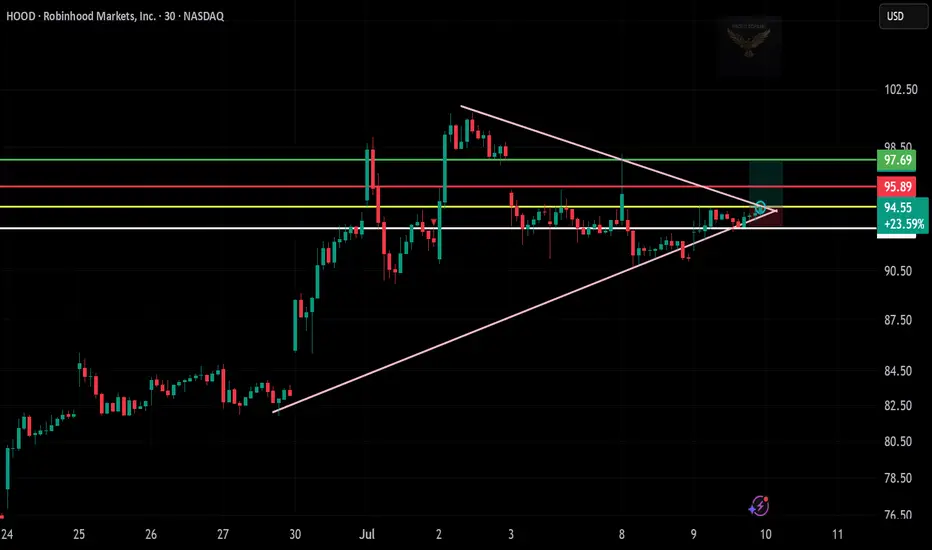
$HOOD Long Trade Setup – July 10📊
Price is squeezing inside a triangle — and today it broke out!
Volume picking up, and it’s holding above trendline support.
📌 Entry: $94.55
🎯 Target: $97.69
🛑 Stop Loss: Below $93.50
⏱️ Timeframe: 30-min
🔍 Why I Like This Trade:
Symmetrical triangle breakout with strong candle
Clean support build-up above $91.50
High R:R zone with room toward recent highs
Let’s see if momentum takes it to the target!
Logging every setup, win or lose, to sharpen the edge.