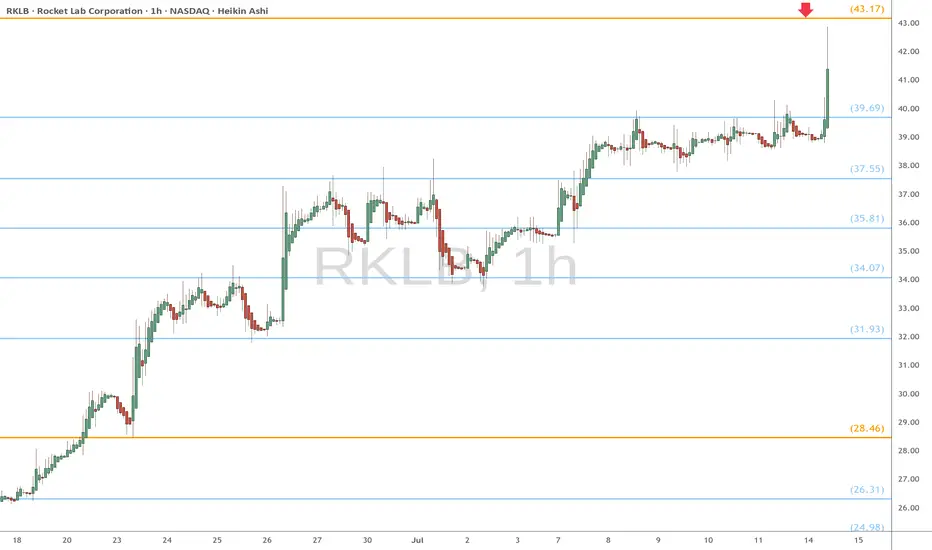
RKLB heads up at $43.17: Golden Genesis fib may knock it downRKLB has been rocketing upward from $4 to $43.
It is about to hit a Golden Genesis fib at $43.17
Expectng a dip from it, or a few orbits at least.
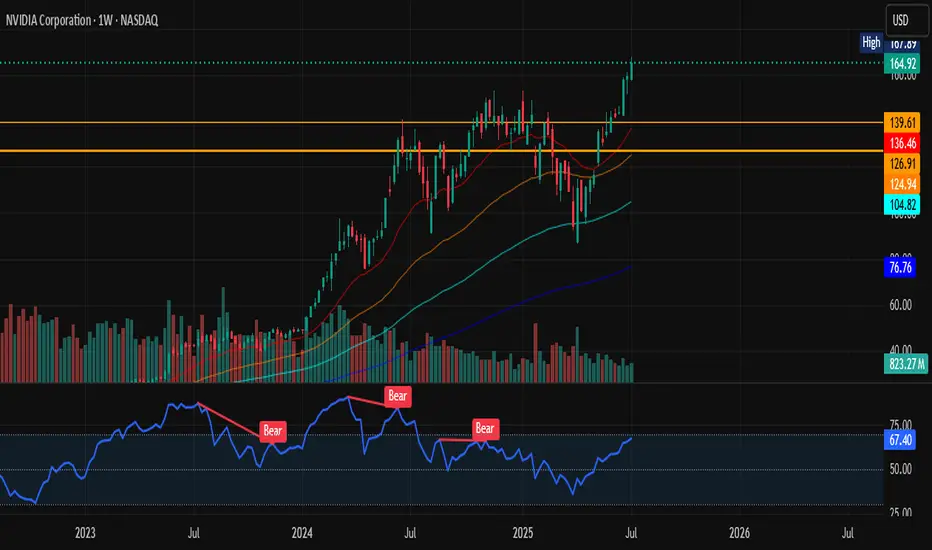
NVIDIA Technical Breakdown NASDAQ:NVDA has broken above the previous congestion/resistance zone (~$139–$145). This zone was tested multiple times and now acts as a support base.
Volume on the breakout week is strong and supporting the move.
Weekly RSI is 67.40, approaching overbought but NOT YET overheated (no bearish divergence). RSI broke past prior Bear zones, signaling renewed strength. Only time will tell.
All-time high territory so proceed with caution. Always due YOUR OWN research.
Bullish long-term trend intact as price is above all EMAs (not too shabby).
I wouldn't be surprised for a pull back soon; maybe 145ish.
Happy Sunday ya'll!
**As always: this isn't financial advice. Please seek professionals on any investments.
Earnings HFT gapsThe gaps that form during earnings season on or the next day after the CEO reports the revenues and income for that past quarter are always HFT driven. The concern over the past 2 previous quarters was the fact that the High Frequency Trading Firms were incorporating Artificial Intelligence into their Algos to make automated trading decisions on the millisecond scale. These small lot orders fill the ques milliseconds ahead of the market open in the US and any huge quantity of ORDERS (not lot size) causes the computers of the public exchanges and market to gap up or gap down, often a huge gap.
This can be problematic for those of you who use Pre Earnings Runs to enter a stock in anticipation of a positive to excellent earnings report for this upcoming quarter.
The HFT algos had several major flaws in the programming that did the opposite: The AI triggered sell orders rather than buy order causing the stock price to gap down hugely on good earnings news.
Be mindful that normal gaps due to a corporate event are far more reliable and consistent.
When you trade during earnings season, be aware that there is still added risk of an AI making a mistake and causing the stock to gap and run down on good news.
It is important to calculate the risk factors until it is evident by the end of this earnings season that the errors within the AI programming have been corrected and that the AI will gap appropriately to the actual facts rather than misinterpreted information.

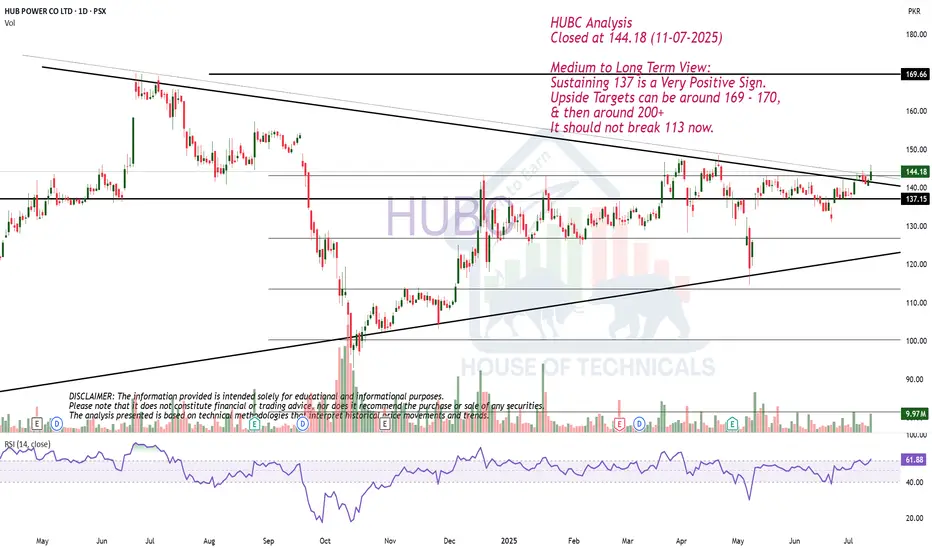
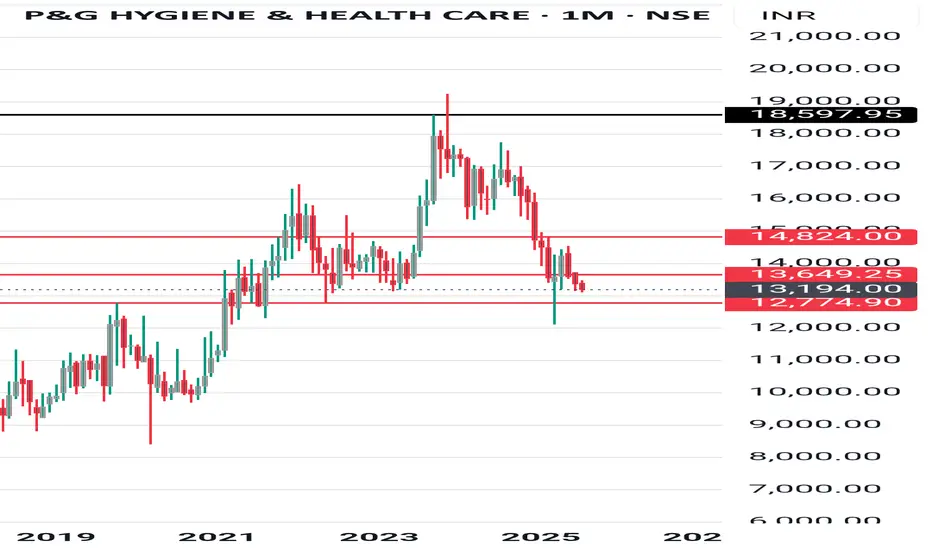
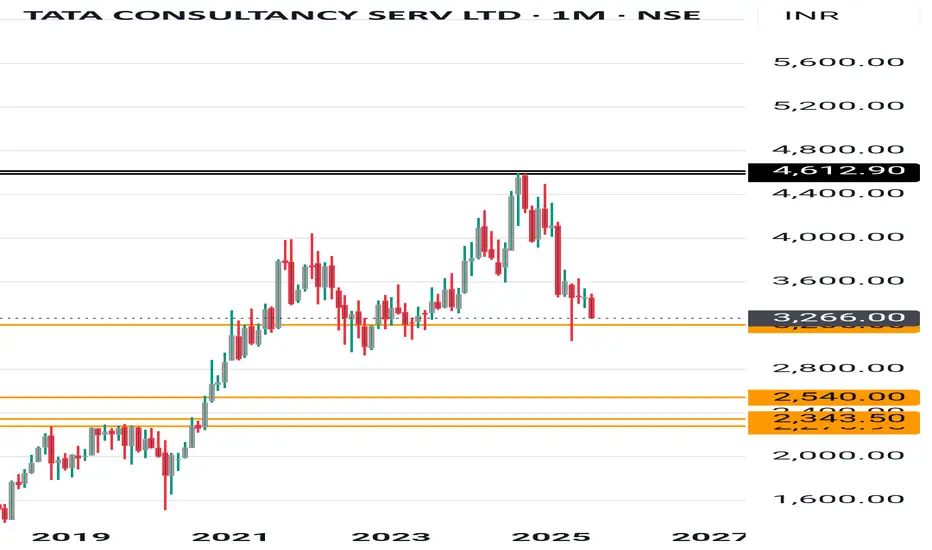
Medium to Long Term View.HUBC Analysis
Closed at 144.18 (11-07-2025)
Medium to Long Term View:
Sustaining 137 is a Very Positive Sign.
Upside Targets can be around 169 - 170,
& then around 200+
It should not break 113 now.
MP eyes on $49.43: Golden Genesis fib stopped the news spikeMP is now partially owned by the DOD, which spiked the price.
That massive move smacked into the Golden Genesis at $49.43
Look for a Break-n-Retest for idea long, or Dip-to-Fib below.

BABA – Dollar Cost Averaging Opportunityhi Traders,
Let's have a look at BABA.
Alibaba (BABA) appears to be approaching the end of its correction phase within a well-defined ascending channel. Based on the current price action and technical setup, we believe now is a good time to begin dollar cost averaging into this stock.
Our identified buy zone lies between $108 and $100, where price intersects the lower trendline support and key EMAs (20/50/100/200). This area offers a strong risk-reward setup for medium- and long-term investors.
The mid-term target for this trade is $160, which aligns with the upper channel resistance and previous price structure. However, from a long-term perspective, we anticipate that BABA will resume its growth trajectory and eventually surpass its previous all-time highs.
Supporting this idea, the RSI is stabilizing in neutral territory, suggesting that momentum is resetting and may shift bullish as price finds support.
Summary:
🔁 Strategy: Dollar cost averaging
🟩 Buy zone: $108 – $100
🎯 Mid-term target: $160
🚀 Long-term view: Return to growth and new ATH
📉 Correction nearing completion; bullish structure remains intact
This setup offers an attractive entry point for patient investors aiming to ride the next major upside cycle in Alibaba.

META | Accumulation Zone Identified — Road to $990?🧠 META | Accumulation Zone Identified — Road to $990?
📊 Ticker: META (Meta Platforms Inc.)
🕒 Timeframe: 1H
📍 Current Price: $717.36
📈 Bias: Bullish accumulation → Expansion
🔍 WaverVanir DSS Thesis
Our system has flagged a liquidity harvesting and accumulation phase between $676–$740. Institutional behavior suggests price is returning to equilibrium before a potential reaccumulation and markup.
🔑 Key SMC Zones:
🔺 Premium Zone: $729–$740 — recent rejection + liquidity engineered
🔻 Discount Zone: $676–$696 — ideal accumulation range
🔵 Equilibrium Pivot: ~$705
🟦 Volume Cluster: $716–$718 → short-term magnet and likely chop area
📐 Fibonacci Confluence:
0.786 Fib = $729.37 (converging with premium zone)
1.272–1.618 extensions → Targets = $870, $990+
0.618 retracement = $676.60 — deep discount level
🚨 VolanX Execution Logic:
Wait for sweep + displacement below $700
Watch for internal BOS + higher low formation
Confirmed entry above $729 = breakout of accumulation
Scale-out zone: $870 → $990+
🧬 Trade Strategy:
Leg Action Level Risk
A Accumulate $680–$705 Low
B Confirm Break $729+ Medium
C Profit Zone $870 / $990 High reward
⚡ Alpha Outlook: META is in a controlled markup with engineered pullbacks. This is where narratives shift, and the smart money loads. VolanX signals strong alignment with SMC zones — this may be a high-conviction multileg long.
#WaverVanir #VolanX #META #SmartMoney #TradingAlpha #SMC #Accumulation #Gamma #OptionsFlow #LSTM #DSS #AITrading #TechStocks #GrowthEquity #Fibonacci #TradingView

$7.73 to $76.00 in 1 day! Another 800% runner $INKTAGAIN? Another 800% runner in a day? 🚀 Such massive moves became a daily thing these days? 😲 NASDAQ:INKT
Can't wait to see new one in the morning!

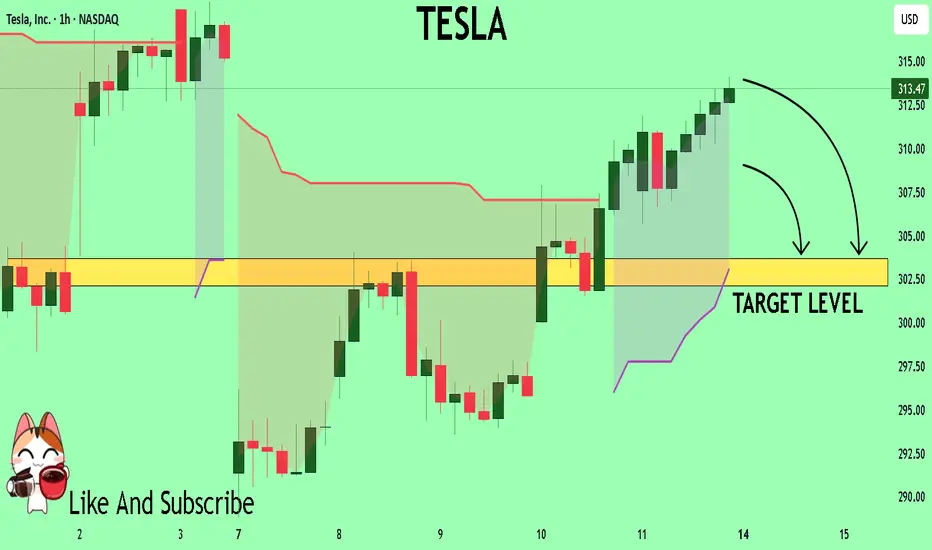
TESLA My Opinion! SELL!
My dear friends,
Please, find my technical outlook for TESLA below:
The price is coiling around a solid key level - 313.47
Bias - Bearish
Technical Indicators: Pivot Points Low anticipates a potential price reversal.
Super trend shows a clear sell, giving a perfect indicators' convergence.
Goal - 303.67
About Used Indicators:
The pivot point itself is simply the average of the high, low and closing prices from the previous trading day.
Disclosure: I am part of Trade Nation's Influencer program and receive a monthly fee for using their TradingView charts in my analysis.
———————————
WISH YOU ALL LUCK
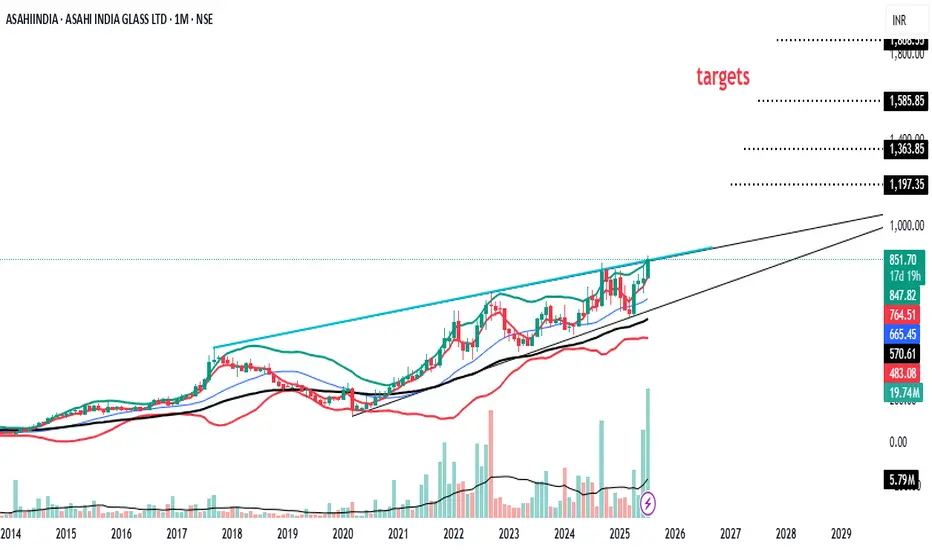
Asahiindia, Kindly do your own studyThis stock has given all time high breakout.
Monthly MACD turn positive
Monthly, weekly and Daily time frame are in momentum
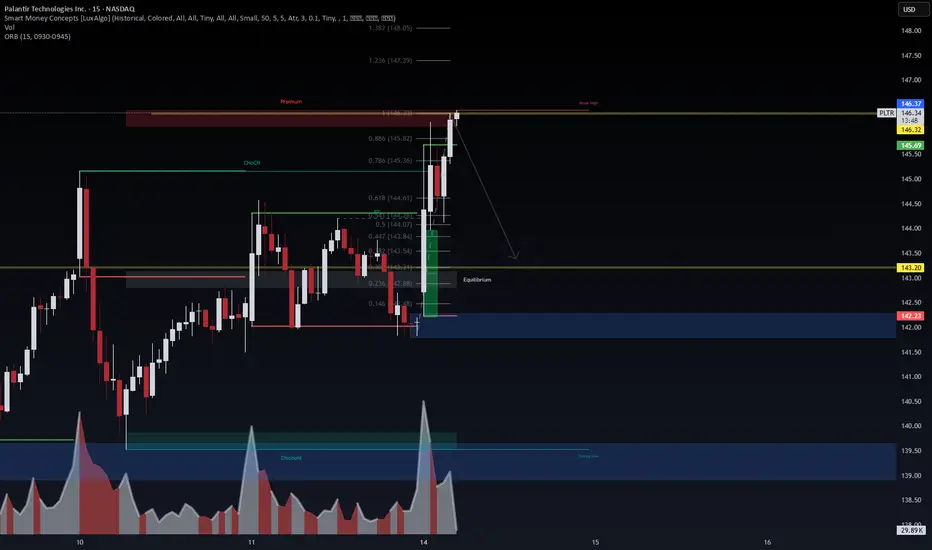
PLTR - Premium Rejection Detected | Bearish Flow Confirms Put🧠 WaverVanir DSS | 15-min SMC x Options Flow x Liquidity
Palantir ( NASDAQ:PLTR ) has just tapped the 0.886–1.0 Fibonacci zone inside the Premium zone near $146.32, where price wicked above the weak high. This aligns with key liquidity exhaustion, suggesting a short-term distribution phase.
Meanwhile, our scanner picked up notable $144 Puts expiring July 18:
🧾 3,500 contracts traded with IV at 80.4%
🔁 Volume > OI → fresh bearish positioning
📉 $2.76 premium → traders paying up to hedge downside risk
🧩 Trade Breakdown:
Price action: Smart Money Premium rejection from $146.32 with reversal wick
Volume: Spike into imbalance zone below $143.20 = next probable draw
Options Flow: Bearish bets on $144 puts line up with chart thesis
ORB (9:30–9:45): High at $145.69, rejected cleanly at structure
🧭 Target Zone: $142.23 (discount block)
🚨 Risk Level: Above $146.50 invalidates short idea
Potential 23% Move in TSSIThere is a high change of reversal in TSSI. This is due to a number of factors:
1. Both the 30min and 150min time frames are showing that the price is overextended to the downside on the custom Data Distribution script. (Yellow dots)
2. The custom USI script has shown a buy signal on the 30min chart. (Background changed to green)
3. There was a good reversal candle on the 30min chart.

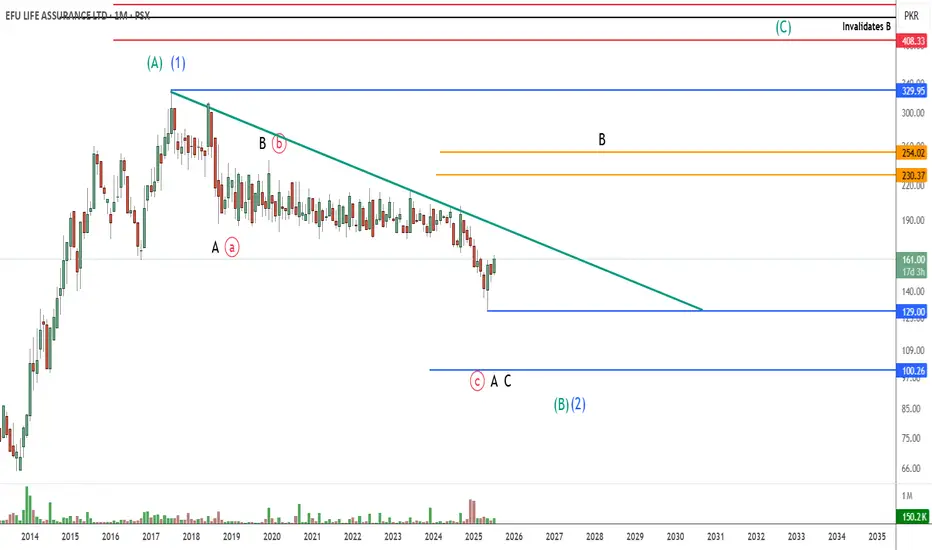
EFUL PROBABLY IN WAVE ' C ' OR ' 3 ' - LONGEFUL is most probably in wave C or 3
We are long term investor on this trade as the overall fundamentals are strong and the long term risk/reward ratio for this trade is very attractive.
Currently the price is in a lesser degree wave C which is almost finished or will finish soon starting an upside rally. If our wave count is correct then the lesser degree wave C is over and the bigger wave C or 3 has just started which will take prices toward 450 levels or even further up above 550 levels but this trade can take years to complete.
There's also a possibility that the lesser degree wave C is still in progress and will take prices further down towards 120 - 100 levels which will make this a more attractive buy trade.
Alternate wave count suggest of a wave B which will also take prices upward, however the target levels will change significantly i.e. 230 - 250 levels
We are already active in this trade and will accumulate more positions in EFUL if prices go below toward 120-100 levels
Let see how this plays, Good Luck!
Disclaimer: The information presented in this wave analysis is intended solely for educational and informational purposes. It does not constitute financial or trading advice, nor should it be interpreted as a recommendation to buy or sell any securities.
SMCI: Watching Monitoring price action closely. Momentum remains positive, and volume is supportive of continuation. Awaiting confirmation before entering, but setup favors a potential move higher.

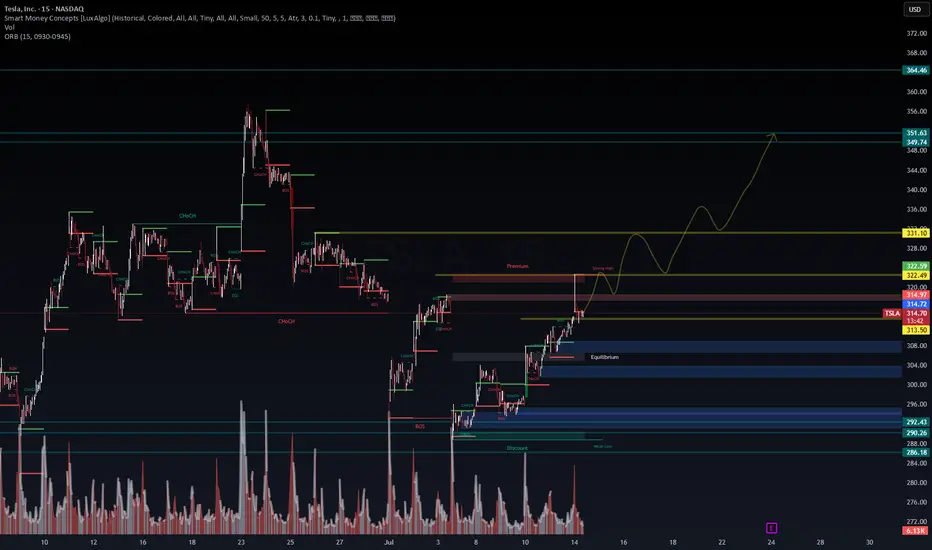
TSLA | Breakout Fuel Loaded – Will the Trend Accelerate Toward 🚗 TSLA | Breakout Fuel Loaded – Will the Trend Accelerate Toward $350?
🔍 Chart Type: 15m
🧠 System: Smart Money Concepts (LuxAlgo) + WaverVanir DSS
📊 Volume: 2.08M
🧭 Narrative: Liquidity Engine + Bullish Flow Momentum
📈 Current Price: $314.78
Clean breakout above BoS and ChgofCHoCH
Currently testing Strong High within a defined Premium Zone
EMA Stack (20/50/100/200) is bullishly aligned
📌 Key Levels to Watch:
📍 Premium Resistance: ~$315–$318
⚖️ Equilibrium Support: ~$309
💧 Discount Liquidity Zones: $292.43, $290.26
🚀 Upside Targets:
Minor: $322.49
Mid: $331.10
Major: $349.74 → $351.63 (projected wave peak)
📈 Bullish Case (Preferred by DSS Flow Model):
Retest of strong high → rally toward $322 then $331
Momentum and volume support trend acceleration
Break of $331 opens path toward $349.74–$351.63 (final wave)
📉 Bearish Invalidator:
Break below equilibrium ($309) → Discount zone retest
Watch $292–$286 for final liquidity sweep if rejection occurs
📅 Catalyst:
Earnings (📦 E icon marked) + macro tech sentiment could ignite explosive continuation
Market structure favors liquidity vacuum toward premium targets
🧠 VolanX DSS Sentiment: STRONG BULLISH
✅ Structure: Uptrend
✅ Volume: Expanding
✅ Momentum: Aligned
🟡 Risk: Premium rejection short-term possible
🔁 Executed via VolanX AI Scanner + WaverVanir DSS Engine
📊 “The Edge Is a System. The System Is Intelligence.”™
#WaverVanir #TSLA #SmartMoneyConcepts #PriceAction #LiquidityZones #Tesla #TechnicalAnalysis #VolanX #InstitutionalEdge #AITrading #QuantFinance
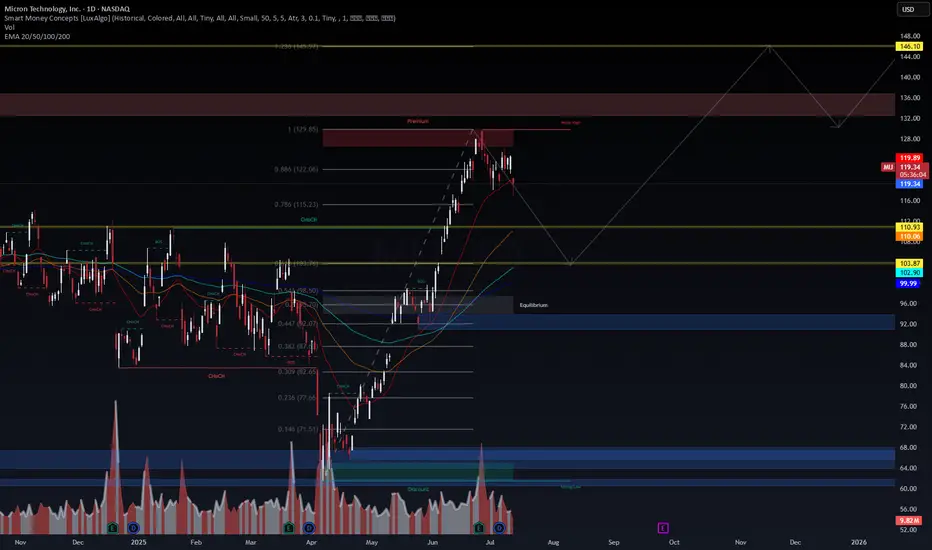
MU - SMC Premium Zone Rejection | Targeting Equilibrium Before E📉 MU - SMC Premium Zone Rejection | Targeting Equilibrium Before Expansion
🔍 WaverVanir DSS Framework | SMC x Fibonacci x Liquidity
We just observed rejection from the Premium zone and 0.886 Fibonacci retracement near $129.85, aligning with prior weak high liquidity. Price has shown signs of distribution, with a likely retracement to the Equilibrium zone ($98–$103) before any bullish continuation.
🧠 Key Observations:
ChoCH confirmed post-run to premium → Expect redistribution
Price rejected 0.886 (122.06) and weak high near 129
Strong EMA confluence forming around 110–103 range
Equilibrium zone and volume spike near $98–$103 offers valid demand
Long-term target remains open toward Fib extension @ $146.10, but only after deeper retrace
📉 Short Bias Until $103–$98 Demand Zone
🔁 Then flip long if bullish confirmation appears
📊 VolanX Market View:
Structure: Breaker → ChoCH → Premium Rejection
Bias: Retracement → Reaccumulation
Tools Used: Smart Money Concepts, Fib, Volume, EMA stack, Liquidity zones
🧠 Built using the WaverVanir DSS, designed to navigate institutional flows and macro-infused setups. We’re tracking this sequence closely across cycles.
📅 Chart Date: July 14, 2025
📍 Asset: NASDAQ:MU (Micron Technology Inc.)
💬 Follow @WaverVanir for macro-aware, alpha-focused setups.
📈 Disclaimer: Not financial advice. Educational content only.
#SMC #OptionsFlow #FibLevels #LiquidityZones #WaverVanir #VolanX #TradingView #MU #Micron #TechStocks #InstitutionalTrading #VolumeProfile #ChoCH #Equilibrium #SmartMoney
AMZN Sitting on a Key Launchpad – What’s Next? for July 14🧠 GEX Analysis & Option Strategy:
* Gamma Wall / Resistance: $225
* Next Major Call Walls: $227.5 → $230 → $235
* Call Side Dominance: 13.3% Calls, low IVR at 27.4, IVx avg 38.9
* Put Support: $217.5 / $213.5
* GEX Bias: Mildly bullish bias above $225 — price is floating at Gamma Wall.
🟢 Bullish Option Play:
* Scenario: A breakout above $227.5 could ignite a gamma squeeze to $230–$235.
* Strategy:
* Buy AMZN 230C (7/19 or 7/26 expiry) on breakout above $227.6
* Stop: Break below $224
* Target: $230 → $234
* Lower IV makes calls cheaper; strong momentum + low IV = favorable R/R.
🔴 Bearish Hedge:
* Scenario: Rejection at $227.5 and fall below $224 zone
* Strategy:
* Buy AMZN 220P or 217.5P (7/19 expiry) if price breaks below $224.
* Target: $217 → $213
* Only valid if we break structure below trendline and BOS flips.
📈 1-Hour Chart Technical Outlook (Smart Money Concepts):
* CHoCH → BOS → Retest is confirming bullish structure.
* Price broke out of prior range (purple box around $224–$225).
* Current Setup: Minor pullback to the OB or top of range ($224.5–$225) is underway.
* Structure favors retest long entries unless we break the ascending trendline.
Key Levels:
* Support Zones:
* $224.50 (retest demand/OB)
* $222.26 (ascending trendline + structure confluence)
* Resistance Targets:
* $227.5 → $230 → $232.5 (GEX targets)
📌 Long Setup:
* Entry: $224.6–$225 (on OB retest)
* Stop: $222.25
* Target: $230–$232.5
* Confirmation: Look for bullish candle at the retest zone
⚠️ Bearish Scenario:
* If price fails $224 and breaks structure at $222.25, anticipate reversal into $219.70–$217 zone. Watch price reaction there for potential swing support.
🧭 Thoughts & Summary:
* AMZN has triggered a clean BOS and now consolidates just under a GEX breakout level.
* The next move will likely be decided early in the session — either a strong push through $227.5 → gamma ramp toward $230+, or failure and fade back toward $222–$219.
* Call buyers may find a good breakout play while keeping tight stops under the OB.
Disclaimer: This analysis is for educational purposes only and does not constitute financial advice. Always do your own research and trade responsibly.

NVO: Trend Continuation With 4.74 R/R SetupNovo Nordisk ( NYSE:NVO ) is showing classic strength — bouncing off the cloud, reclaiming structure, and flashing early signs of momentum rotation. This is how you catch continuation trades without chasing.
📊 Technical Breakdown
Ichimoku: Price reclaimed the top of the cloud and is now building above it. Kijun and Tenkan are aligned. This is the first real bullish structure since the March breakdown.
MACD: Histogram curling upward. We’re not fully bullish yet, but the pressure is shifting back to buyers.
R1 Pivot ($81.31) is the first big test. A clean break above that opens the path toward R2 and beyond.
🎯 Trade Specs
Entry: $71.58
Target: $93.33 (+30.44%)
Stop: $67.00 (–6.42%)
Risk/Reward: 4.74 — elite-level skew for a high-quality name

UNH bear flag and gapsUNH has been top of my radar for a bullish reversal. With 2 major gaps to fill after the epic collapse in share price this ticker has a lot of potential. Currently sitting in what appears to be a bear flag, it is holding above the monthly 200EMA (overlayed on this 4H chart). However price recently rejected off the daily 21ema (overlayed on this 4H chart) and if the bear flag is any indicator price may head lower for another liquidity sweep before the inevitable bullish reversal.
A side note: insiders have been buying $millions since the share price collapsed which is always a good indicator of what's to come.

2250
On the chart:
Confirmation and failure zones.
After the triangle, the price is targeting a new high as a near-term target.

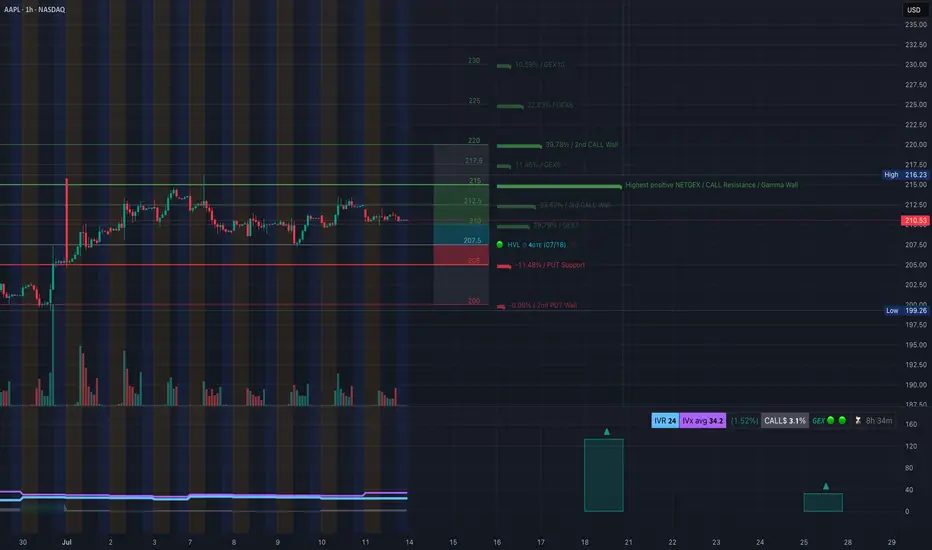
AAPL at a Pivotal Zone! TA for July 14AAPL at a Pivotal Zone! GEX & Price Action Align for Major Move 📉📈
🧠 GEX Sentiment (Options-Based Insight)
* Current Price: $210.53
* GEX Zone Traps:
* Below Price:
* 🟥 Put Support at $205 (-11.48%)
* 🔻 PUT Wall at $200 (-9.06%) — strong floor
* Above Price:
* 🟩 CALL Walls at:
* $212.5 → 29.79% GEX7
* $215 → 38.62% GEX6 (3rd largest resistance)
* $217.5 → 11.45% GEX9
* $220 → 39.78% GEX2 (heavy resistance zone)
* 🟩 Max GEX Cluster: $215–$220
* 🔺GEX10 spike at $230 → unlikely unless squeeze
* IVR/IVX:
* IVR: 24 (low volatility environment)
* IVX: 34.2 → Soft volatility bounce
* Call/Put Flow:
* Calls: 3.1% favored
* GEX trend: 🌕🌕🌕 (Neutral-to-Bullish if over $212.5)
📦 Interpretation:
Gamma compression is strong near $212.5–$215. If AAPL stays above $210.5 and reclaims $212.5, options market opens up space toward $217.5–$220. Below $207.5 = risk of drop toward $205 then $200 PUT wall.
🕹️ Option Trade Ideas Based on GEX
Bullish Strategy (IF Breaks $212.5):
* Trade: Buy AAPL 215c or 217.5c (Jul 19 or 26 expiry)
* Trigger: Hold above $212.5
* Target: $217.5–$220
* Stop: Break below $209.8
Bearish Strategy (IF Breaks $207.5):
* Trade: Buy AAPL 205p or 200p (Jul 19 or 26 expiry)
* Trigger: Loss of $207.5 with momentum
* Target: $205 → $200
* Stop: Reclaim of $210.5
🔍 1-Hour Chart Analysis (Price Action)
* Structure: Sideways consolidation between $207.5–$213.5
* Key Levels:
* Demand: $205–$207.5 (Buyers defended)
* CHoCH (Change of Character) confirmed near $209.8
* Resistance: $213.48 (rejected multiple times)
* Trendline: Rising wedge forming under liquidity sweep zone
* Liquidity Pools: Resting above $215 and below $205
* FVG/OB Zones: Thin FVG at $209.8–210.5 and mid OB around $207
📈 Scenario 1 (Bullish):
* If price bounces off $210 again and breaks $212.5 with volume, watch for sweep of $215–$217.5
* Watch for re-entry above CHoCH/BOS confluence near $211.5
📉 Scenario 2 (Bearish):
* If we break $207.5 and fail to reclaim $210.5 → liquidity vacuum opens toward $205 and $200
✅ My Thoughts & Suggestions
* Direction Bias: Neutral > Bullish if $212.5 is claimed, otherwise range-bound.
* Best Risk/Reward: Wait for $212.5 breakout confirmation OR $207.5 breakdown.
* Scalpers: Use $210.5–212.5 as chop zone — fade edges.
* Swing Traders: Only enter on clear breakouts with stop discipline.
🔒 Disclaimer:
This analysis is for educational purposes only and does not constitute financial advice. Always do your own research and manage your risk before trading.