Upstart wanna get startedNASDAQ:UPST is ready to go... forming an inverted head and shoulder on the daily and testing the neckline. nuff said

Long NSRGY on weekly time frameI like this company on a fundamental level. besides technical analysis. I think there will be a flood to dividend names soon if/when interest rates go down. bond yield should drop as well and investors want some passive income. Who better to go to then the company that owns the world lol. But on a serious note, this company is over a century old and has weathered many storms, I believe that this could be a bargain for long term investors as well. On the technical side, we have brok the down trend with a new high, I believe this pull back to previous resistance is healthy and needed for a stronger push to 110 and up. Also, check out the RSI, we have not seen a strong RSI on the weekly since 2021, where we had this same type pull back and then bounce up. Goodluck, I will be trading shares on this, SL with a break and hold under support, TP, no clue yet.

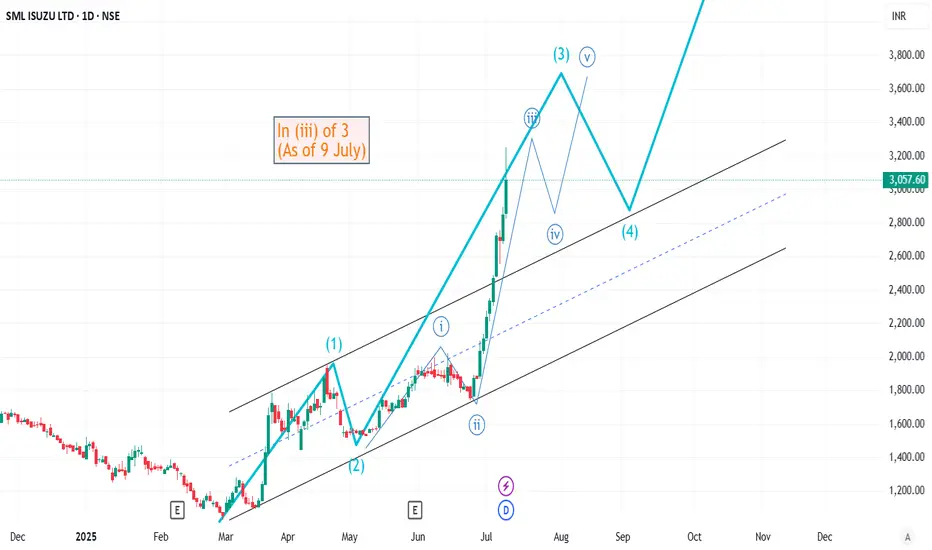
Elliott Wave Analysis of SMLISUZU on daily chartThe stock is currently in (iii) of 3rd wave. The probable wave directions and wave markings have been highlighted. Will update this chart as it progresses or as the (iv) wave gets over.
Long NKE on pull back after break?Nke just woke investors back up with their recent forecast after earnings. This push has temporarily broken the down trend on the daily time frame and it is holding the break on the weekly. We now have a healthy-looking retest with the rsi on the daily time frame above 50 signaling a bounce is coming. I mapped out some take profits. I am still a little worried about the company itself based on my own fundamental analysis. But physiologically i believe many people don't want to miss out on a brand name like Nike at such a discount, if it bounces here, I think it will be huge. Probably a short squeeze. I will not hold this trade up to next earnings though, as i said I don't really love the fundamentals. I think NKE is losing market share rapidly. Anyways sorry for the grammar but here are my thoughts, good luck. oh, and stop loss with a clear break and hold under this bounce spot, maybe 68-69?

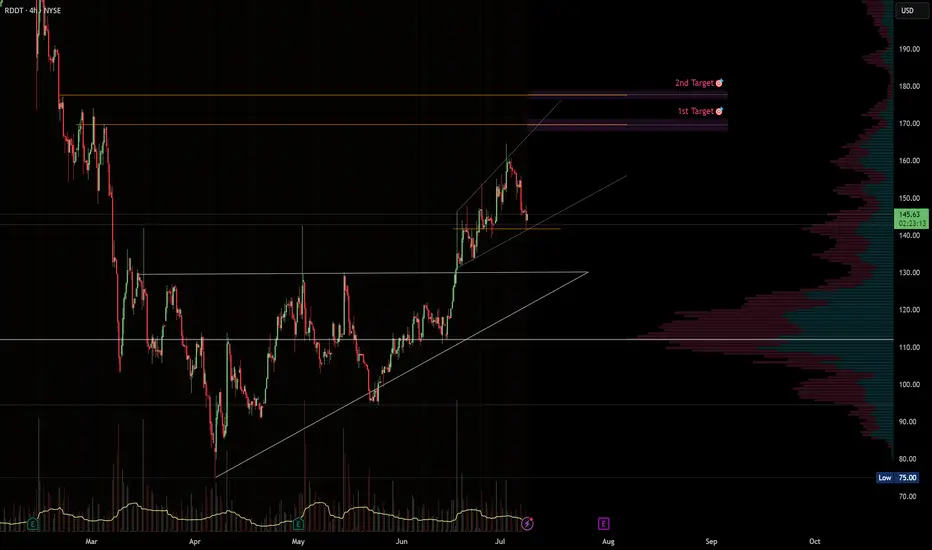
RDDT · 4H — Rising-Wedge Setup with Targets at $172 and $185Setup Summary
Rising wedge structure forming since late June. Price recently pulled back to test support at ~$144–145, where the rising trendline intersects horizontal structure.
Momentum remains bullish: The prior move from $110 to $165 was impulsive, and this consolidation appears corrective so far.
Volume profile (VPVR) shows a thin liquidity zone between $150 and $172, suggesting a strong move is likely if the $150 level is reclaimed.
---
🎯 Target Zones
Target Level Rationale
1st Target $169 Matches wedge breakout projection + aligns with prior IPO supply and volume gap resistance.
2nd Target $177 Psychological round number + coincides with IPO opening print and the highest rejection wick seen so far.
---
🛠️ Trade Plan
Component Level
Trigger Entry on bounce from $144 or breakout/reclaim of $150.
Invalidation Close below $142 breaks wedge structure.
TP-1 $172 – take 50–70% off, move stop to breakeven.
TP-2 $185 – runner target; exit if price shows rejection.
---
⚠️ Risk Notes
Wedge patterns can fake out — wait for confirmation (e.g. a 4H bullish engulfing or volume reclaim above $148–150).
Earnings or lock-up expiration could introduce volatility (check calendar).
If support at $143 fails, look for next demand at $134–135 (prior breakout base).
---
✅ Checklist
Structure: Rising wedge in uptrend
Support: Held above previous breakout zone
Volume profile: Favorable thin zone toward $172
Risk defined below $142
> Disclaimer: This idea is for educational purposes only. Trade your own plan and always use proper risk management.
ANET off to the racesNYSE:ANET breaking out, starting the trend back up to all time highs... first stop 120...

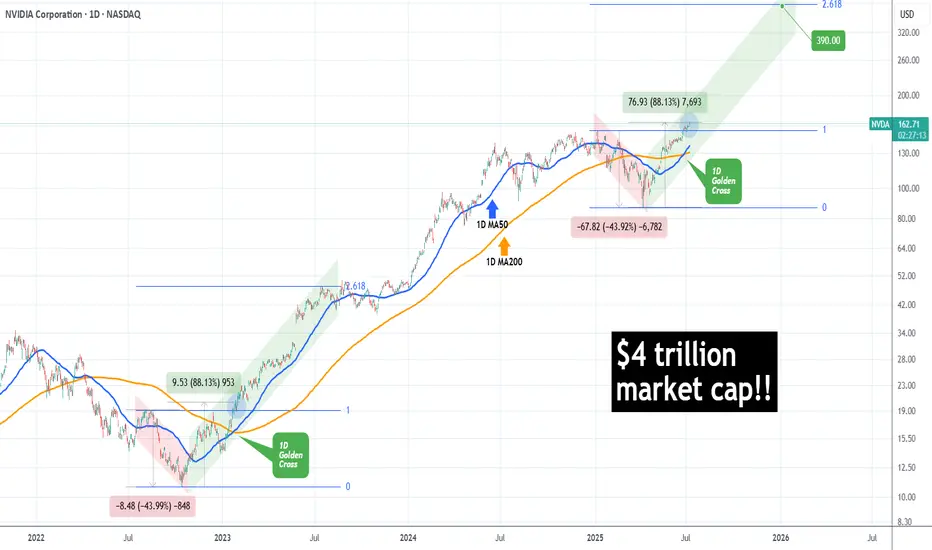
NVIDIA made history! First company with $4 trillion market cap!NVIDIA Corporation (NVDA) became today the first company in history to surpass a $4 trillion market value, as A.I. bulls extended the recent rally and pushed the price past the approximate $163.93 level needed to reach this market capitalization threshold.
The long-term trend on the 1D time-frame couldn't look more bullish. Coming off a 1D Golden Cross less than 2 weeks ago, the price has turned the 1D MA50 (blue trend-line) into Support and sits at +88.13% from the April 07 2025 Low.
This is the exact set-up that the market had when it was coming off the 2022 Inflation Crisis bottom (October 13 2022). As you can see, both fractals started with a -44% decline, bottomed and when they recovered by +88.13%, there were just past a 1D Golden Cross. In fact that Golden Cross (January 24 2023) was the last one before the current.
NVIDIA entered a Channel Up (green) on its recovery and for as long as the 1D MA50 was supporting, it peaked on the 2.618 Fibonacci extension before it pulled back below it.
If history repeats this pattern, we are looking at a potential peak around $390, which may indeed seem incredibly high at the moment, but as we pointed out on previous analyses, the market is in the early stages of the A.I. Bubble, similar to the Internet Bubble of the 1990s.
-------------------------------------------------------------------------------
** Please LIKE 👍, FOLLOW ✅, SHARE 🙌 and COMMENT ✍ if you enjoy this idea! Also share your ideas and charts in the comments section below! This is best way to keep it relevant, support us, keep the content here free and allow the idea to reach as many people as possible. **
-------------------------------------------------------------------------------
💸💸💸💸💸💸
👇 👇 👇 👇 👇 👇
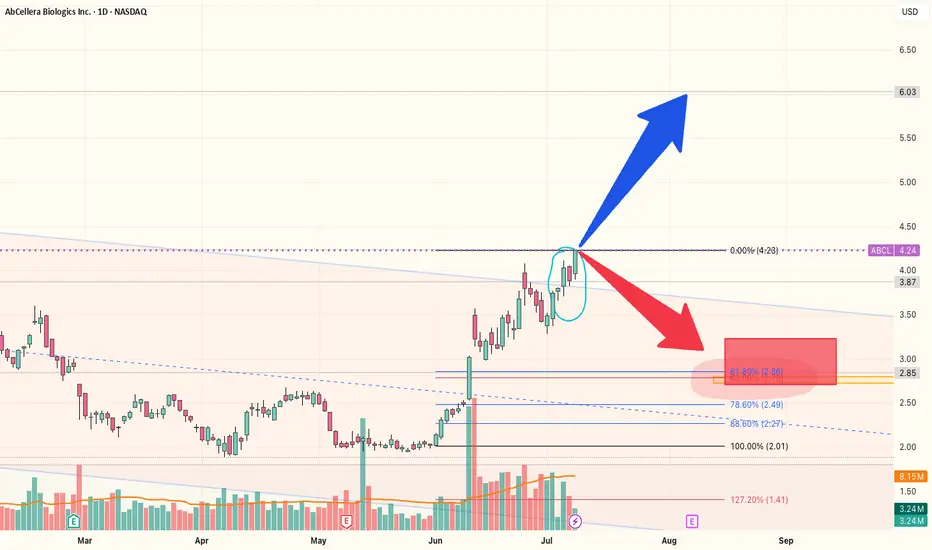
ABCL OTE ESCENARIOSIf the stock brake the weak high US$ 4.00 could be a rally to the next historic resistance US$ 6.03. If not the bullback can go to US$ 2.00. I am confortable at FIBO 61.9 at 2.90 as an OTE. Comments...
BA heads up into $230: Strong fib zone might cause a serious dipBA has been flying (lol) from its last crash caused crash.
About to test a signrificant resistance at $229.82-230.73
Expect at least some "orbits" or a pullback from this zone.
.
Previous analysis that caught THE BOTTOM:
==================================================
.

SRFM pullback to fly high? I'm watching this one on a retest of its breakout. Nice Triangle has great upside targets if this S curve holds.

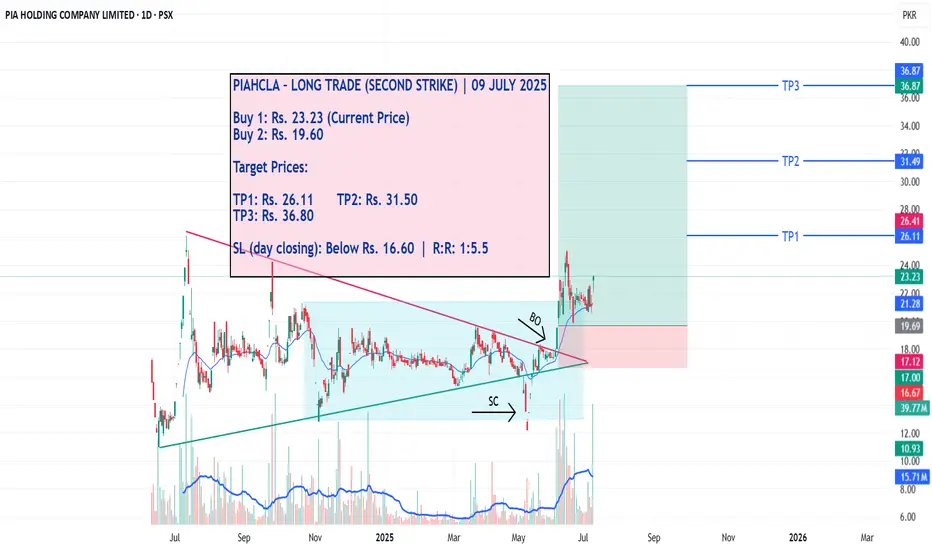
PIAHCLA – LONG TRADE (SECOND STRIKE) | 09 JULY 2025PIAHCLA – LONG TRADE (SECOND STRIKE) | 09 JULY 2025
PIA Holding Company Limited (PIAHCLA) has successfully broken out of an accumulation zone marked by a light blue channel. This upward breakout aligns with a previous triangle breakout, creating a structurally strong case for this second strike entry. Price action confirms bullish continuation, with multiple upside targets now active.
📌 Execution Strategy:
Caution: Please buy in 2 parts within the buying range. Close at least 50% of your position at TP1 and trail your stop loss to protect profits in case of unexpected moves.
📢 Disclaimer: Do not copy or redistribute signals without prior consent or proper credit to The Chart Alchemist (TCA).
✨ Kindly support our efforts by boosting and sharing this idea!
Break of rising trendline TSLA – 4H 🧠
Bias: Bearish
Entry: Below 300.00
🎯 Targets: 273.67 – 253.87
❌ Invalidation: Above 315.01
Break of rising trendline signals bearish momentum. Downside continuation anticipated.
#TSLA #Stocks #NASDAQ #PriceAction #TradingView #piporia

Breakout neededPrice is consolidating under the 50 EMA(13.22) and above the 10 EMA(13.10) at the resistance of a downward parallel channel. Can the bulls breakout, or will the bears maintain the downward parallel channel?

APA APA has been struggling financially for a while and has been trading in this downward channel just reaching the top border. Consistent rejections have been apparent especially as it approaches the 0.618 golden zone on our Fibonacci retracement.
Macro outlook there is a strong consensus that oil prices are going to see a decline continue for the rest of the year. The sheer supply of oil is already outstripping demand leading to storage of oil globally which is not only costly but has increased costs for companies. S/D analysts at goldman predict 4x in supply over the forthcoming year leading to lower oil prices.
APA will most likely struggle under these conditions, therefore im looking to sell

Alibaba (BABA) – Bearish Setup FormingNYSE:BABA
A descending triangle is forming on the chart, with strong resistance around $118 and horizontal support near $102. The structure suggests a potential breakdown, targeting a move of ~−9.8%.
Key observations:
• Price rejected from the descending trendline multiple times
• Stochastic turning down from the overbought zone
• RSI below 50 – room for further downside
• Bollinger Bands show compression, possibly preceding a breakout
📉 Business context:
Alibaba is facing ongoing challenges in its core business. Competition in the e-commerce and cloud sectors has intensified, import/export tariffs are putting pressure on margins, and regulatory oversight from Chinese authorities remains strict. These headwinds may weigh on investor sentiment and stock performance.
My short scenario:
If the price breaks below the $111–$110 zone with volume confirmation, I expect a move toward $102–$100.

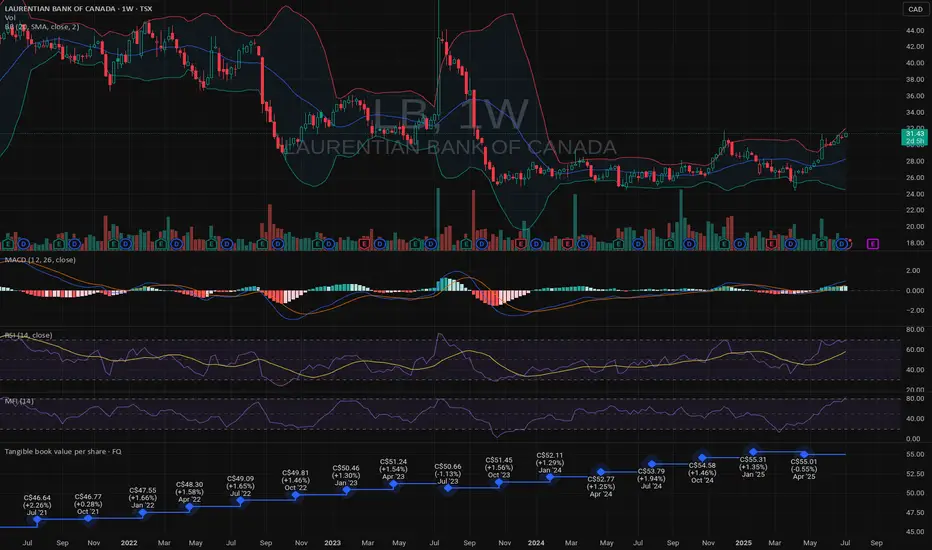
LB LONGLB laurentian Bank
LB on the TSX exchange
I am long this bank. good Tangible Book and decent chart.
our cost basis is approx $27 Canadian Dollars
I like it, and hope they stay stable.
Cheers
NVDA$ - possible pullback to $50 (-67% from pick) in the making.NASDAQ:NVDA have done this before (67% pullbacks after long rally).
NVDA is following very predictable patterns for many years now, despite excitement around this stock - stock made "new recent low" and current rally maybe just a part of a "head and shoulders" in the making. If "new all time high" is not reached with in the next few weeks - we will see stock pullback to $50 or less in the next 6-9 month.

Cable One | CABO | Long at $130.82Cable One NYSE:CABO is a leading broadband communications provider under the Sparklight brand, offering high-speed internet, cable TV, and phone services across 24 U.S. states.
Book Value: $315.50.
Positive:
Strong liquidity: Quick ratio 1.47 (above industry avg ~1.0).
Undervalued vs. industry (1.91x).
Large customer base: ~1.1M customers, 2.8M data subscribers.
Stable revenue: Broadband focus in non-metropolitan markets.
Insiders buying over $1 million in share recently while also being awarded options.
Recent change in leadership.
Negatives:
Medium-high bankruptcy risk: Altman Z-Score 1.36 (below industry ~2.5).
High leverage: D/E 1.78 (above industry ~1.0).
Weak earnings: Negative margins, declining profitability.
Suspended dividend.
Classify this one as a risky investment, but it is very undervalued at this price and the upcoming decline in interest rates may have a very positive effect on the company's stock (at least short-term: 5 million float, 19% short interest). Regardless, not one to put your life savings into. From a technical analysis perspective, I foresee a potential drop between $115 and $120 in the near-term and rise from there. It all depends on the upcoming earnings, so label this one a "gamble" with high bankruptcy risk.
Regardless of bottom predictions, NYSE:CABO is in a personal buy zone at $130.82 for a swing trade.
Targets into 2027:
$190.00 (+45.2%)
$250.00 (+91.1%)

Mastercard Could Face ResistanceMastercard fell hard in June on the threat of stablecoin competition. Now, after a rebound, some traders may expect another push to the downside.
The first pattern on today’s chart is the selloff that began on June 13 when the Wall Street Journal reported that major retailers were considering stablecoins as an alternative to credit-card payment systems. Another drop came the following week after the U.S. Senate passed the GENIUS Act regulating stablecoins.
The stock recovered in the second half of June but it halted at the post-drop closing high of $569.45. Has new resistance emerged?
Third, prices could be stalling at the 50-day simple moving average. The 8-day exponential moving average (EMA) is additionally below the 21-day EMA. Those signals may reflect weakening intermediate- and short-term trends.
Fourth, stochastics have reached an overbought condition.
Finally, this month’s lower high could potentially represent the start of a new falling channel. Such a pattern could make investors expect a lower low closer to $500.
Check out TradingView's The Leap competition sponsored by TradeStation.
TradeStation has, for decades, advanced the trading industry, providing access to stocks, options and futures. If you're born to trade, we could be for you. See our Overview for more.
Past performance, whether actual or indicated by historical tests of strategies, is no guarantee of future performance or success. There is a possibility that you may sustain a loss equal to or greater than your entire investment regardless of which asset class you trade (equities, options or futures); therefore, you should not invest or risk money that you cannot afford to lose. Online trading is not suitable for all investors. View the document titled Characteristics and Risks of Standardized Options at www.TradeStation.com . Before trading any asset class, customers must read the relevant risk disclosure statements on www.TradeStation.com . System access and trade placement and execution may be delayed or fail due to market volatility and volume, quote delays, system and software errors, Internet traffic, outages and other factors.
Securities and futures trading is offered to self-directed customers by TradeStation Securities, Inc., a broker-dealer registered with the Securities and Exchange Commission and a futures commission merchant licensed with the Commodity Futures Trading Commission). TradeStation Securities is a member of the Financial Industry Regulatory Authority, the National Futures Association, and a number of exchanges.
TradeStation Securities, Inc. and TradeStation Technologies, Inc. are each wholly owned subsidiaries of TradeStation Group, Inc., both operating, and providing products and services, under the TradeStation brand and trademark. When applying for, or purchasing, accounts, subscriptions, products and services, it is important that you know which company you will be dealing with. Visit www.TradeStation.com for further important information explaining what this means.

Google: Upcoming TopWe locate Google in turquoise wave 2 (of a downward impulse). In more detail, we see the stock developing a complex - - - pattern and expect turquoise wave 2 to conclude imminently with wave . All the while, the price should maintain a safe distance from resistance at $209.28. Looking ahead to turquoise wave 3, we anticipate sell-offs down into our magenta Target Zone between $123.92 and $98, before wave 4 likely triggers a temporary rebound up to the $138.35 level. Ultimately, the entire turquoise downward impulse should bottom out again in the magenta zone, which would also mark the completion of waves (C) in magenta and in green. Since a new larger upward phase should begin afterward, the magenta zone presents an opportunity to establish long positions. However, if Google were to break above the $209.28 resistance next, we would have to expect a new high for magenta wave alt.(B) —which would only temporarily postpone the anticipated sell-off though (probability: 24%).
📈 Over 190 precise analyses, clear entry points, and defined Target Zones - that's what we do.

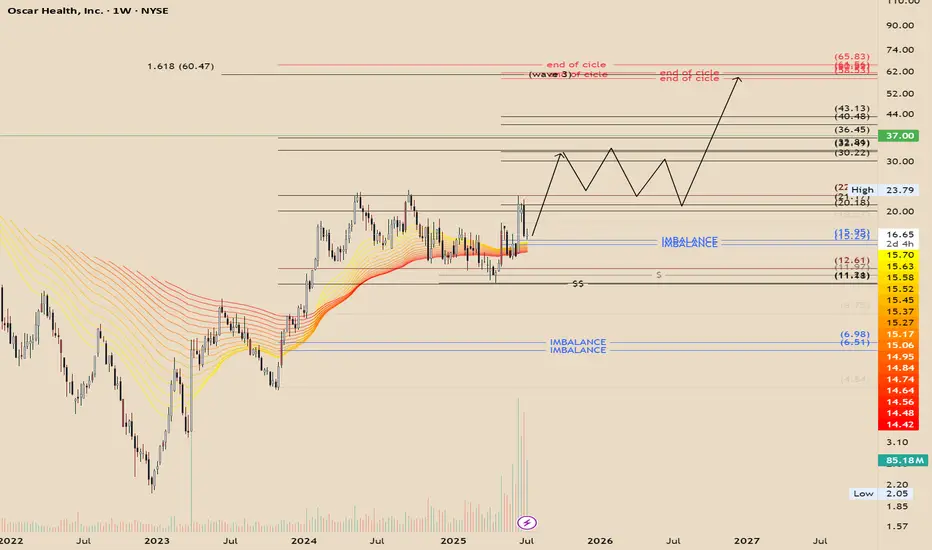
OSCR - Cyclical Expansion and Algorithmic ConfluenceOscar Health moves in cycles. It's possible to observe algorithmic confluence with the 3rd extension at 1.618 (~$60). The price reacted to the algorithmic expansion channel as expected and retraced to the equilibrium of the weekly bullish breaker. Therefore, the price behavior I anticipate is an aggressive expansion toward the next algorithmic level around $30, potential consolidation thereafter, and a final expansion toward the end-of-cycle target in the $60s.
This analysis is purely speculative and for educational purposes only.
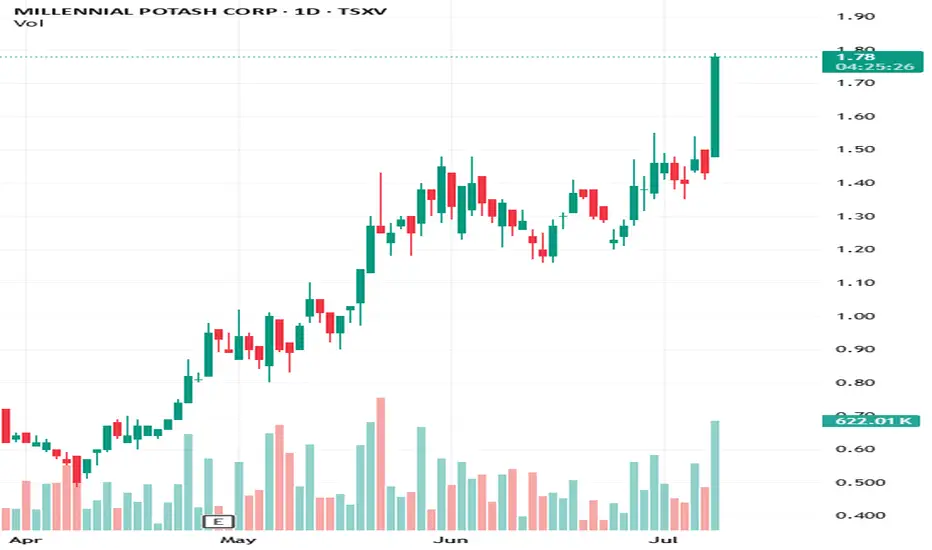
U.S. DFC Invests in $TSXV:MLP Banio Project Millennial Potash Corp. ( TSXV:MLP | OTC:MLPNF ) just announced a major development: the U.S. International Development Finance Corporation (DFC) has committed up to US$3M in project development funding for the Banio Potash Project in Gabon.
This strategic funding supports the upcoming Feasibility Study and was signed in Washington D.C. with the President of Gabon in attendance — a major signal of international and governmental backing.
Why this matters:
Potash = food security. Fertilizer is essential for crop yields, and potash demand in Africa is rising fast.
DFC backing helps derisk the Banio project and positions MLP for future development financing.
The investment arrives as Millennial moves from exploration to development — with second-stage drilling nearing completion.
Gabon's support + U.S. government endorsement puts MLP in a strong geopolitical position for long-term growth.
Follow for updates as the feasibility study unfolds and MLP potentially emerges as a cornerstone player in Africa’s potash supply chain.
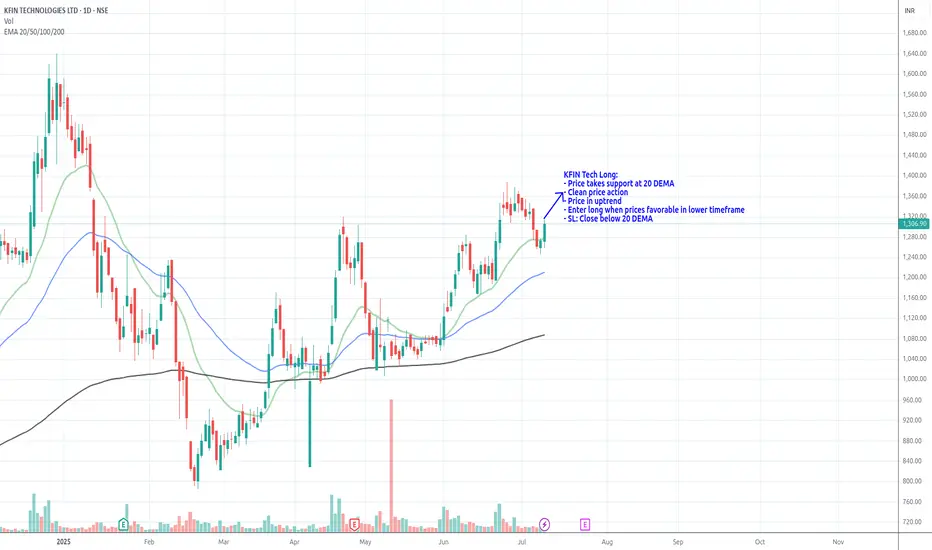
KFIN Tech_Long_Support @ 20DEMAKFIN Tech Long:
- Price takes support at 20 DEMA
- Clean price action
- Price in uptrend
- Enter long when prices favorable in lower timeframe
- SL: Close below 20 DEMA