AAPL - Weekly HV/IV PerspectiveGood evening —
I wanted to do one more write up with that being on NASDAQ:AAPL as we enter the week with futures just opening.
HV10 (16.58%) is trending -11.56% below IV (28.14%) showing a weekly price gap differential of -$2.89 on the stated implied move to what trending markets are doing. This current IV value entering the week sits 69% within the sliding year spectrum.
Now, with Apple consolidating in range for almost eight weeks after selling off when it reached its 4T milestone in December of 2024, has now begun advancing back upwards in price. The strength here is obvious and the quality of company is well, Apple.
My price targets on the week is first the upper band of stated IV ($220.58) then moving on towards the upper implied range of HV63 ($225.87). I believe the markets are going to push apple higher while balancing the indices out selling off in other areas. This would start to accelerate HV10, as it is now 91.23% coiled to its yearly lows and needs to unwind. Hopefully with a few short-term trending days increasing we find our regression.
Please come back next week and see how our position and volatility progressed forward.

Trading Thesis: Frozen M&A Firestarter– Is LW the Next Takeover 🧠 Trading Thesis: “Frozen M&A Firestarter – Is LW the Next Takeover Pop?”
📉 Ticker: NYSE:LW
🗓️ Timeframe: Daily (1D)
📍 Current Price: $51.32
📈 Fibonacci Extension Target: $136.62 – $170.88
📉 Downside Risk: ~$47.90 if activist push fails
🔭 Time Horizon: 2–6 months
🔍 WaverVanir Thesis
Lamb Weston ( NYSE:LW ) is sitting at the intersection of activist disruption, undervalued fundamentals, and surging options flow. Our proprietary scanner is flashing multiple option sweeps — particularly short-dated call activity — signaling that institutional players may be positioning for a near-term event.
⚡ Catalysts in Focus
📢 Activist Campaign: Jana Partners is pushing hard for a strategic overhaul. With six new executive recruits and a potential board shakeup, institutional change is now not just possible — it's probable.
🔄 CEO Exit & Earnings Reset: The company recently ousted its CEO following a soft Q2 and issued a major guidance cut. These events often precede strategic restructuring or M&A.
🤝 Takeover Chatter: Both Reuters and Seeking Alpha confirm that Lamb Weston is a prime M&A candidate, with rumors swirling around Post Holdings and other potential bidders.
🌐 Macro Environment
🥔 Weak global demand in frozen potato products & foodservice channel.
📉 High OpEx + shrinking restaurant traffic = near-term pressure.
🧊 But with supply chain normalization and margins likely bottoming, the risk/reward starts favoring the upside — especially under new leadership.
📐 Technical Levels
📉 Demand Zone: $47.90–$50.79 (Previous support, 0% Fib)
📊 Target 1: $76.80 (38.2% retracement)
📊 Target 2: $136.62 (127.2% Fib extension – full revaluation)
🎯 Long-term Target: $170.88 (institutional re-pricing scenario)
⛓️ Stop-Loss: Daily close below $47.00 (invalidates structure)
🧠 WaverVanir DSS Signal
Our Decision Support System (DSS) is generating a bullish reversion setup with macro catalysts. Volume Profile confirms accumulation at $50–52 range. Watch for breakout from this base as institutional call flows build pressure.
🧭 Strategic Outlook
Base Case: Gradual recovery toward $76–90 range (re-rating after activist news).
Bull Case: Activist success + M&A = sharp revaluation toward $136–171.
Bear Case: Weak guidance persists, potential fade toward $40.
⚠️ Disclaimer: This is not financial advice. WaverVanir posts are for informational and educational purposes only. Trade with caution, manage your risk.
🧩 #Tags:
#WaverVanir #LambWeston #ActivistInvesting #OptionsFlow #MergersAndAcquisitions #TradingThesis #DSS #InstitutionalTrading #FrozenFoods #EarningsPlay #SmartMoney #TechnicalAnalysis #VolumeProfile #OptionsAlert #ValueSetup #MBO

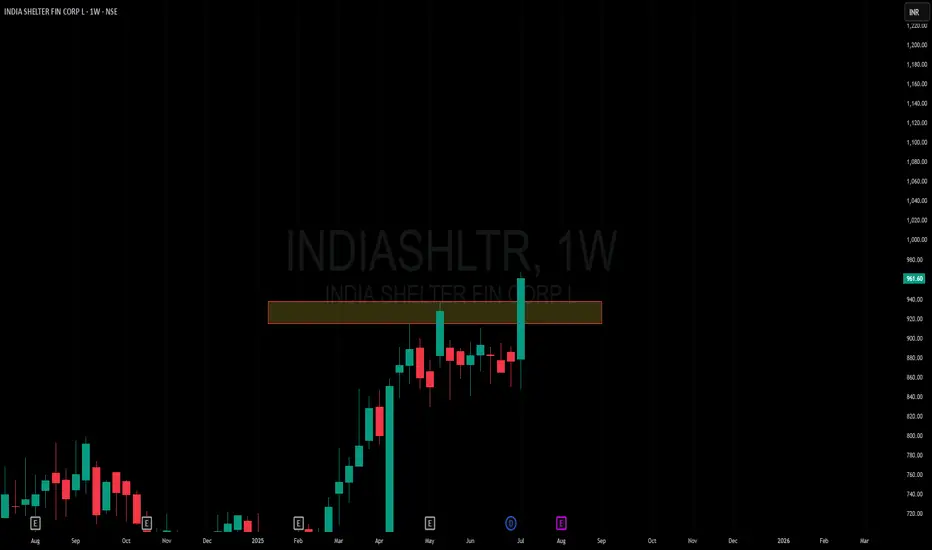
Amazing breakout on WEEKLY Timeframe - INDIASHLTRCheckout an amazing breakout happened in the stock in Weekly timeframe, macroscopically seen in Daily timeframe. Having a great favor that the stock might be bullish expecting a staggering returns of minimum 25% TGT. IMPORTANT BREAKOUT LEVELS ARE ALWAYS RESPECTED!
NOTE for learners: Place the breakout levels as per the chart shared and track it yourself to get amazed!!
#No complicated chart patterns
#No big big indicators
#No Excel sheet or number magics
TRADE IDEA: WAIT FOR THE STOCK TO BREAKOUT IN WEEKLY TIMEFRAME ABOVE THIS LEVEL.
Checkout an amazing breakout happened in the stock in Weekly timeframe.
Breakouts happening in longer timeframe is way more powerful than the breakouts seen in Daily timeframe. You can blindly invest once the weekly candle closes above the breakout line and stay invested forever. Also these stocks breakouts are lifelong predictions, it means technically these breakouts happen giving more returns in the longer runs. Hence, even when the scrip makes a loss of 10% / 20% / 30% / 50%, the stock will regain and turn around. Once they again enter the same breakout level, they will flyyyyyyyyyyyy like a ROCKET if held in the portfolio in the longer run.
Time makes money, GREEDY & EGO will not make money.
Also, magically these breakouts tend to prove that the companies turn around and fundamentally becoming strong. Also the magic happens when more diversification is done in various sectors under various scripts with equal money invested in each N500 scripts.
The real deal is when to purchase and where to purchase the stock. That is where Breakout study comes into play.
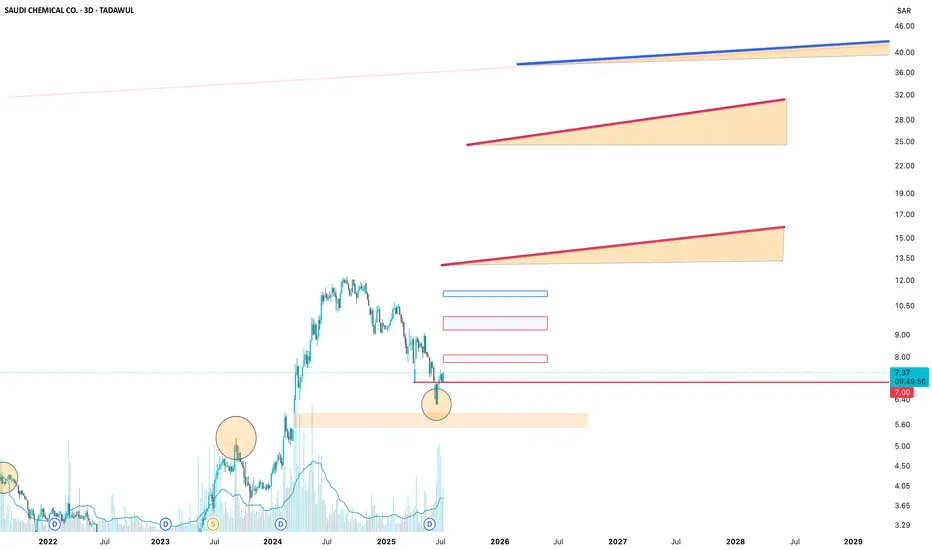
Check this stock which has made an all time low and high chances that it makes a "V" shaped recovery.
> Taking support at last years support or breakout level
> High chances that it reverses from this point.
> Volume dried up badly in last few months / days.
> Very high suspicion based analysis and not based on chart patterns / candle patterns deeply.
> VALUABLE STOCK AVAILABLE AT A DISCOUNTED PRICE
> OPPURTUNITY TO ACCUMULATE ADEQUATE QUANTITY
> MARKET AFTER A CORRECTION / PANIC FALL TO MAKE GOOD INVESTMENT
DISCLAIMER : This is just for educational purpose. This type of analysis is equivalent to catching a falling knife. If you are a warrior, you throw all the knives back else you will be sorrow if it hits SL. Make sure to do your analysis well. This type of analysis only suits high risks investor and whose is willing to throw all the knives above irrespective of any sectoral rotation. BE VERY CAUTIOUS AS IT IS EXTREME BOTTOM FISHING.
HOWEVER, THIS IS HOW MULTIBAGGERS ARE CAUGHT !
STOCK IS AT RIGHT PE / RIGHT EVALUATION / MORE ROAD TO GROW / CORRECTED IV / EXCELLENT BOOKS / USING MARKET CRASH AS AN OPPURTUNITY / EPS AT SKY.
LET'S PUMP IN SOME MONEY AND REVOLUTIONIZE THE NATION'S ECONOMY!
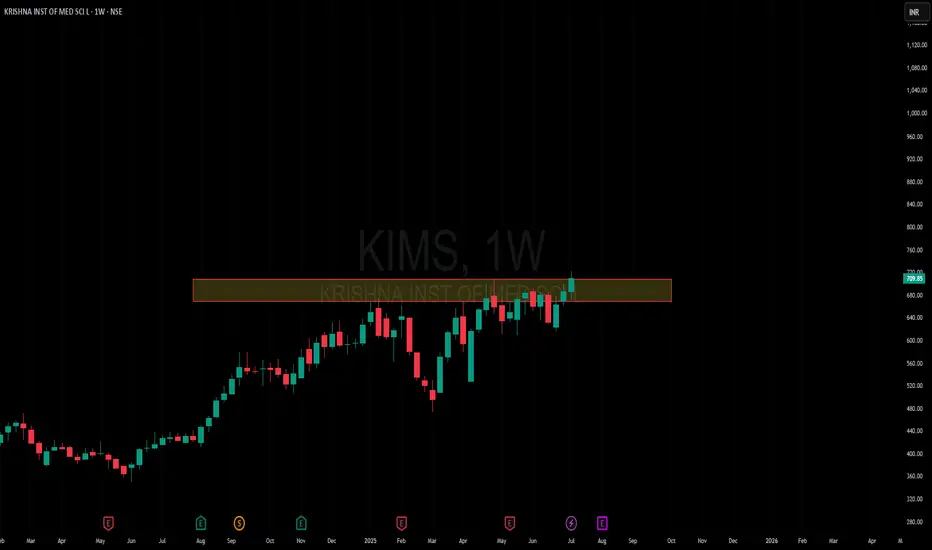
Amazing breakout on WEEKLY Timeframe - KIMSCheckout an amazing breakout happened in the stock in Weekly timeframe, macroscopically seen in Daily timeframe. Having a great favor that the stock might be bullish expecting a staggering returns of minimum 25% TGT. IMPORTANT BREAKOUT LEVELS ARE ALWAYS RESPECTED!
NOTE for learners: Place the breakout levels as per the chart shared and track it yourself to get amazed!!
#No complicated chart patterns
#No big big indicators
#No Excel sheet or number magics
TRADE IDEA: WAIT FOR THE STOCK TO BREAKOUT IN WEEKLY TIMEFRAME ABOVE THIS LEVEL.
Checkout an amazing breakout happened in the stock in Weekly timeframe.
Breakouts happening in longer timeframe is way more powerful than the breakouts seen in Daily timeframe. You can blindly invest once the weekly candle closes above the breakout line and stay invested forever. Also these stocks breakouts are lifelong predictions, it means technically these breakouts happen giving more returns in the longer runs. Hence, even when the scrip makes a loss of 10% / 20% / 30% / 50%, the stock will regain and turn around. Once they again enter the same breakout level, they will flyyyyyyyyyyyy like a ROCKET if held in the portfolio in the longer run.
Time makes money, GREEDY & EGO will not make money.
Also, magically these breakouts tend to prove that the companies turn around and fundamentally becoming strong. Also the magic happens when more diversification is done in various sectors under various scripts with equal money invested in each N500 scripts.
The real deal is when to purchase and where to purchase the stock. That is where Breakout study comes into play.
Check this stock which has made an all time low and high chances that it makes a "V" shaped recovery.
> Taking support at last years support or breakout level
> High chances that it reverses from this point.
> Volume dried up badly in last few months / days.
> Very high suspicion based analysis and not based on chart patterns / candle patterns deeply.
> VALUABLE STOCK AVAILABLE AT A DISCOUNTED PRICE
> OPPURTUNITY TO ACCUMULATE ADEQUATE QUANTITY
> MARKET AFTER A CORRECTION / PANIC FALL TO MAKE GOOD INVESTMENT
DISCLAIMER : This is just for educational purpose. This type of analysis is equivalent to catching a falling knife. If you are a warrior, you throw all the knives back else you will be sorrow if it hits SL. Make sure to do your analysis well. This type of analysis only suits high risks investor and whose is willing to throw all the knives above irrespective of any sectoral rotation. BE VERY CAUTIOUS AS IT IS EXTREME BOTTOM FISHING.
HOWEVER, THIS IS HOW MULTIBAGGERS ARE CAUGHT !
STOCK IS AT RIGHT PE / RIGHT EVALUATION / MORE ROAD TO GROW / CORRECTED IV / EXCELLENT BOOKS / USING MARKET CRASH AS AN OPPURTUNITY / EPS AT SKY.
LET'S PUMP IN SOME MONEY AND REVOLUTIONIZE THE NATION'S ECONOMY!
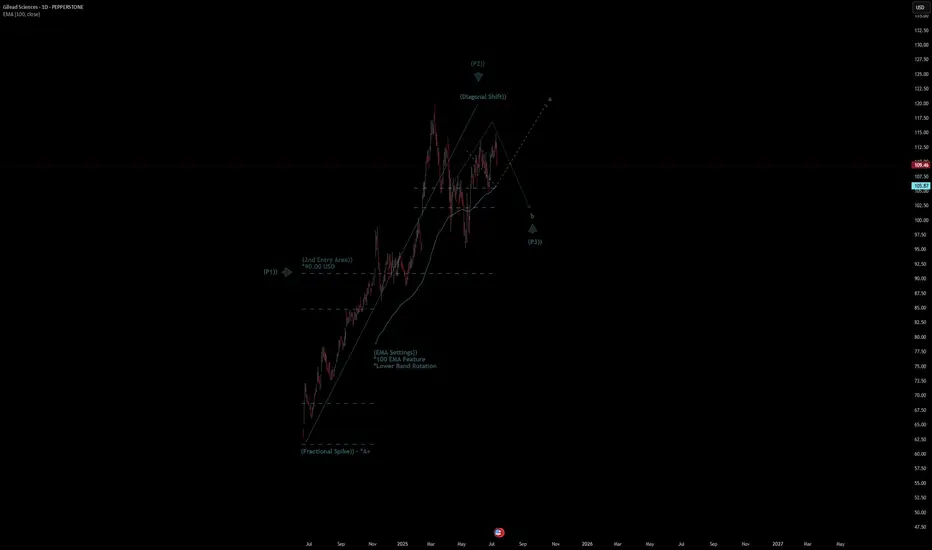
Gilead Sciences Quote | Chart & Forecast SummaryKey Indicators On Trade Set Up In General
1. Push Set Up
2. Range Set Up
3. Break & Retest Set Up
Notes On Session
# Gilead Sciences Quote
- Double Formation
* (Fractional Spike)) - *A+ | Completed Survey
* (2nd Entry Area)) - *90.00 USD | Subdivision 1
- Triple Formation
* (P1)) / (P2)) & (P3)) | Subdivision 2
* (TP1) = a / Long Consecutive Range
* (TP2) = b / Short Consecutive Pullback | Subdivision 3
* Daily Time Frame | Trend Settings Condition
- (Hypothesis On Entry Bias)) | Regular Settings
- Position On A 1.5RR
* Stop Loss At 98.00 USD
* Entry At 110.00 USD
* Take Profit At 126.00 USD
* (Uptrend Argument)) & No Pattern Confirmation
- Continuation Pattern | Not Valid
- Reversal Pattern | Not Valid
* Ongoing Entry & (Neutral Area))
Active Sessions On Relevant Range & Elemented Probabilities;
European-Session(Upwards) - East Coast-Session(Downwards) - Asian-Session(Ranging)
Conclusion | Trade Plan Execution & Risk Management On Demand;
Overall Consensus | Buy
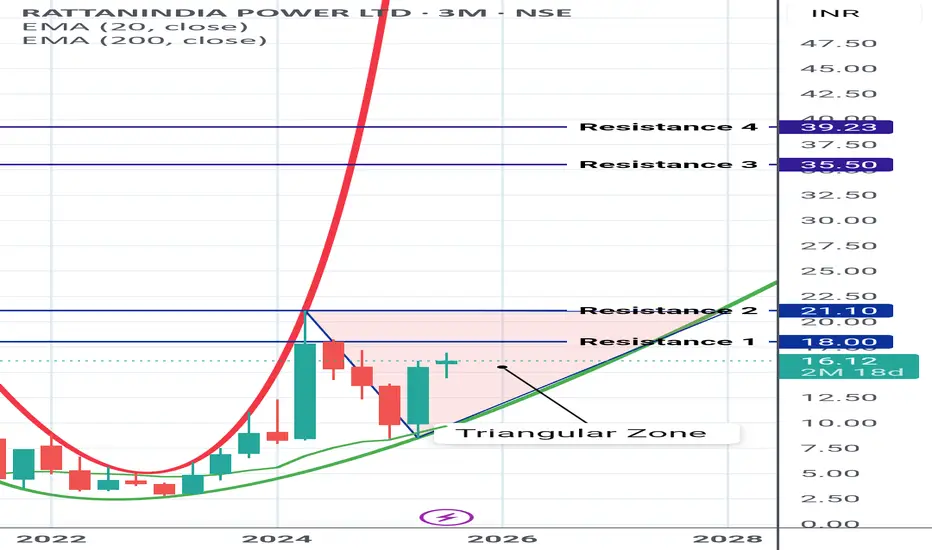
Rattan India Power (RTN POWER) RTN POWER having good power to cross the marked Triangular zone.
On closing above the triangular zone, the above marked horizontal lines will be the resistances
Shared it for Reference purpose based on chart pattern.
My buy view for Hims & Hers stock. My buy view for Hims & Hers stock.
Overall, I believe this asset is still in a bullish direction. I remember hoping into accummulating this stock when it dropped from $64 to $41 at the open of market on 23/6/2025 which I sold off when it hit $50.
However, I still hold a strong buy bias with my entry and exit showing on my chart (analysis).
Please trade with care as I still look forward to $64 per share for this stock long-term.
Please, kindly like, share your thoughts via comment and follow me for more.

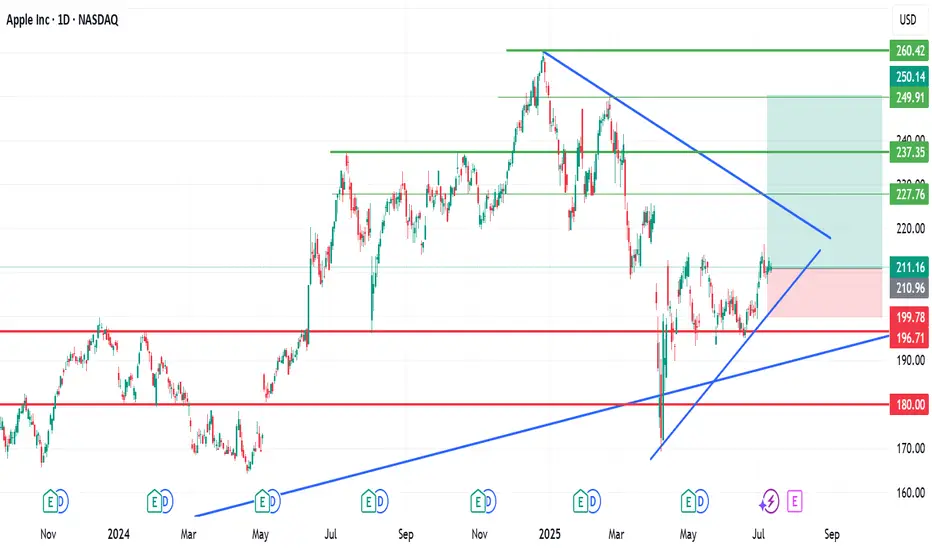
I am bullish on Apple (AAPL)I am bullish on Apple (AAPL)
Looking at my cahrt, you will seen my thoughts.
$237, $237 and $260 are my medium and long-term buy targets.
Trade with care as pullbacks are possible along the journey nortward.
Like, follow, share and comment
PLTR - Palantir Technologies: Why PLTR is the Perfect PlayExceptional Performance Leadership
Palantir Technologies has established itself as the undisputed champion of the U.S. stock market in 2025. The stock has delivered extraordinary returns of 402.92% over the past 12 months and 87.89% year-to-date, making it the best-performing stock in both the S&P 500 and Nasdaq-100 indices. Currently trading at $142.10, the stock has surged from lows around $21, representing one of the most dramatic momentum plays in modern market history.
Powerful AI-Driven Revenue Growth
The company's financial performance has been nothing short of spectacular. Palantir's U.S. commercial AIP (Artificial Intelligence Platform) revenue has surpassed a $1 billion annual run rate with 71% year-over-year growth. The company reported Q1 2025 revenue of $883.86 million, beating consensus estimates and growing 39% year-over-year. This growth trajectory is being driven by unprecedented demand for AI solutions across both commercial and government sectors.
The company's customer base has expanded to 769 total customers, up 39% year-over-year, with 44% of revenue now coming from commercial clients. This diversification away from pure government dependency represents a significant strategic achievement that provides multiple growth vectors.
Strategic Government AI Dominance
Maven Smart System Contract Expansion
Palantir's government business has reached new heights with its Maven Smart System contract being increased by $795 million, bringing the total value to over $1.3 billion through 2029. Pentagon leaders boosted the contract citing "growing demand" for the system across all military branches, including the Army, Navy, Air Force, Space Force, and Marine Corps.
Stargate AI Initiative Leadership
The company holds a central position in the $500 billion Stargate AI infrastructure project, positioning it as a backbone for America's AI future. This initiative represents one of the largest technological undertakings in U.S. history, designed to establish domestic AI superiority and reduce reliance on foreign systems.
Strategic Partnerships
Palantir has formed landmark partnerships with Microsoft for classified AI deployment and Accenture Federal Services for comprehensive government AI implementation. These alliances significantly expand the company's reach and delivery capabilities across the federal ecosystem.
Technical Momentum Confirmation
Bullish Technical Setup
The stock exhibits exceptional technical strength with multiple confirmation signals:
Moving Average Alignment : All major moving averages (20-day, 50-day, 200-day) are positioned bullishly below the current price, indicating sustained upward momentum
RSI Positioning: At 58.42, the RSI shows healthy momentum without being overbought, providing room for continued advancement
Volume Confirmation: Recent trading volumes have consistently exceeded 50 million shares daily, indicating strong institutional participation
Golden Cross Pattern: The 50-day moving average at $131.9 remains above the 200-day moving average at $101.7, confirming the bullish trend
Breakout Pattern
The stock has successfully broken above the $140 resistance level with strong volume, targeting the $175-$220 range based on technical analysis. The pennant pattern breakout above $140 has been confirmed by institutional buying pressure and retail momentum.
Institutional Investment Surge
Record Institutional Participation
Institutional ownership has reached 45.65% of outstanding shares, with $19.19 billion in institutional inflows over the past 12 months versus only $10.43 billion in outflows. This represents a net institutional buying pressure of nearly $9 billion, demonstrating strong professional investor confidence.
Premium Analyst Coverage
Wedbush Securities has raised its price target to $160, calling Palantir the "Messi of AI" and positioning it as a top pick in their "IVES AI 30" list. The firm sees Palantir's AIP platform as foundational for the trillion-dollar AI spending wave and believes the company has a "golden path to become the next Oracle".
Competitive Advantages and Market Position
Architecture-Agnostic Platform
Palantir's AIP is architecture-agnostic, seamlessly integrating with both centralized cloud systems and decentralized frameworks. This versatility allows the company to serve diverse client needs across multiple sectors, from government defense to commercial healthcare.
Network Effects and Data Flywheel
The company benefits from powerful network effects where more customers generate more data, which improves AI models and increases retention rates. This creates a self-reinforcing competitive advantage that becomes stronger over time.
Government Moats
Palantir's deep government relationships and security clearances create substantial barriers to entry. Multi-year government contracts provide revenue stability and growth visibility that few technology companies can match.
Financial Strength and Profitability
The company has demonstrated seven consecutive quarters of GAAP profitability with expanding margins. Adjusted operating margins have improved to 36% in Q1 2025 from 29% previously, showing operational excellence alongside revenue growth. The company maintains a strong balance sheet with $4 billion in cash and equivalents.
Investment Thesis Summary
Palantir Technologies represents the perfect convergence of momentum, fundamentals, and catalysts that defines exceptional investment opportunities:
Momentum Factors:
402.92% twelve-month returns leading all major indices
Continuous institutional accumulation with $9 billion net inflows
Technical breakout above key resistance with volume confirmation
Fundamental Catalysts:
$1 billion+ AIP commercial revenue run rate with 71% growth
$1.3 billion+ government contract pipeline expansion
Central role in $500 billion Stargate AI infrastructure initiative
Strategic Positioning:
Architecture-agnostic platform creating multiple market opportunities
Government relationships providing defensive moats and growth visibility
Network effects and data flywheel creating competitive advantages
Risk-Adjusted Opportunity:
Clear support levels at $137-$140 range providing defined risk parameters
Multiple price targets ranging from $155-$220 suggesting significant upside potential
Strong balance sheet and cash generation providing downside protection
Palantir Technologies embodies the rare combination of explosive growth, defensive positioning, and strategic importance that creates generational investment opportunities. The company's leadership in AI government applications, combined with accelerating commercial adoption, positions it as a cornerstone holding for the AI revolution.

MSTR MICROSTRATEGY As of July 11, 2025, MicroStrategy Incorporated (MSTR) is trading at approximately $434.58 per share on the NASDAQ, showing a strong daily gain of about 3.04% (+$12.84). The stock has experienced significant growth recently, with a 3-month return of around 45% and a 1-year return exceeding 220%.
Key Highlights about MicroStrategy (MSTR):
Industry: Software - Application
Market Cap: Approximately $118.8 billion
Shares Outstanding: About 273 million
Trading Range (Year): Low near $102.40 and high around $543.00
Volume: Active trading with daily volumes around 18 million shares
CEO: Phong Q. Le
Headquarters: Tysons Corner, Virginia, USA
Business: MicroStrategy provides enterprise analytics software and services, including a platform for data visualization, reporting, and analytics. It serves a broad range of industries including finance, retail, technology, and healthcare.
Recent Price Trend
The stock has steadily appreciated from about $255 in February 2025 to over $430 in July 2025.
Recent trading range for July 11 was between $423.70 and $438.70.
After-hours trading shows a slight dip to around $433.25.
Outlook
The next earnings announcement is scheduled for July 31, 2025.
Analysts forecast the stock price could range between $434.58 and $798.13 in 2025, reflecting optimism about the company’s growth prospects and market position.
MicroStrategy’s strong correlation with Bitcoin price movements (due to its large BTC holdings) often influences its stock volatility and performance.
In summary: MicroStrategy is a major player in enterprise analytics software with a highly volatile stock influenced by its Bitcoin exposure and market sentiment. Its stock price has surged strongly in 2025, reflecting both business fundamentals and crypto market dynamics.

I am bullish on TSLAI have not changed my buy bias for this baby.
II will continue adding TSLA to my portfolio with $360 and $400 as my medium-term take profits.
Share your thought.
If you found this helpful, like, follow and share

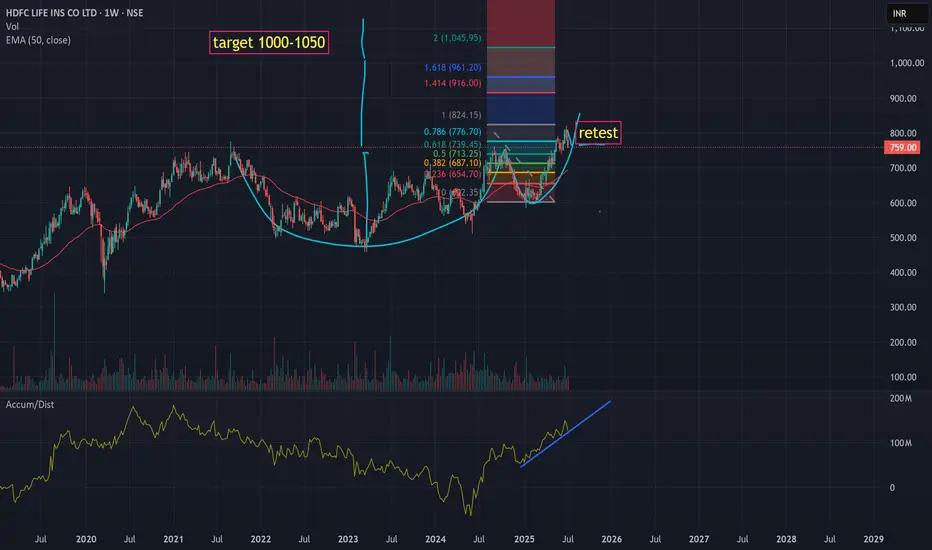
should move to 1000 Range after current retest of breakout Should try to breakout from the support retest as there is no negative news and result is due this week. Should run to 820-850 this week before results if not manipulated.
$NVDA – Going Long Long LONGTaking a long position here at $98 – yes, despite the noise.
There’s no denying the pressure across semiconductors following renewed tariff threats from the Trump administration. But I believe this is more short-term overreaction than long-term damage. Any meaningful negotiation or de-escalation could act as a slingshot for these names, especially leaders like Nvidia.
Nvidia's fundamentals remain incredibly strong. The company is still outpacing its peers in AI, data centers, and gaming hardware. Profitability remains intact, and there’s no indication of a breakdown in their competitive edge.
Technicals are giving us some strong signals:
We're seeing a long-term bullish divergence forming.
RSI is approaching oversold territory – rare for Nvidia and historically a signal for strong bounces.
Price is nearing key long-term support levels that held in previous cycles.
I'm positioning early here because I believe the broader market is mispricing geopolitical risk. If the situation improves – and it often does faster than expected – NVDA is one of the first names that will rebound aggressively.
Let’s see how this plays out, but I’m confident this is a high-conviction entry point in the 80's and 90's.


MSTR stock has seen a strong rally since JuneSince June, MSTR stock has seen a strong rally—rising from the mid‑$300s to above $430—driven by a few key factors:
Bitcoin’s continued ascent has fueled sentiment. Bitcoin recently hit fresh record highs (above $118K), driven by a weakening dollar and bullish macro trends, which in turn boosted bitcoin-linked equities like MicroStrategy.
In short, MSTR’s rally since June has been largely Bitcoin-driven: a powerful combination of rising crypto prices, ongoing BTC purchases, proactive capital raises, and positive analyst sentiment creating a bullish feedback loop.
Let me know if you'd like a breakdown of Bitcoin’s trend or deeper insight on MSTR’s financing strategy.
$447 will be my next buy TP.
Please, share your thought, like, share and follow me.

Buy this stock if you want to get burnedThis isn't going to be a V shaped recovery y'all. Another leg down is on the way.

MTN Nigeria Stock: A Strong Rally smashing the roofMTN Nigeria Stock: A Strong Rally smashing the roof
MTN Nigeria stock has demonstrated remarkable growth since trading around the 170 naira zone in December 2024.
As of December 9th, the stock was priced at 170 naira but has steadily rallied over the months to surpass several resistance levels (N320, N357 & N386).
Based on this momentum, the nearest most significant support zone is N386. This is a zone with confluence between an ascending resistance trendline and a support level.
The question is.
1. Can the buy continue with this vertical push-up up
2. Will the N386 confluence zone continue to hold this stock from falling?
Trade with care.
Please like, follow, and share your thoughts.

$GOOGL $GOOG AI Signals a Volatile Expansion 🔍 Technical Overview (Daily TF)
GOOGL is currently trading at $180.19, breaking upward inside a well-defined bullish channel, hugging equilibrium levels after consolidating just below the $184 resistance zone. This setup reflects classic Smart Money reaccumulation behavior:
🟩 Current Structure: CHoCH → BOS confirmed on higher lows
📊 Equilibrium: Mid-channel value alignment; strong price efficiency with low imbalance
🟧 Premium Zone: $202.81–208 marked for liquidity sweep (target zone)
🔴 Strong Highs: Not yet swept; draw on liquidity to the upside likely
Key price levels:
Resistance zone: $184.00–208.00
Support cluster: $172.00–168.00
Discount Block (Demand): $144.00–132.00
🤖 VolanX AI Models Forecast (as of July 12)
📌 Model 1 – Smart Money AI Trading Suite
LSTM Forecast: +9.0% gain expected over next 14 days
Target: $196.34
Market Condition: Overbought (No order blocks currently)
Volatility: 26.4%
Volume Shift: -15.5% (suggesting short-term supply exhaustion)
📌 Model 2 – WaverVanir DSS Platform
Sentiment Score: 78 (bullish bias)
15-Day Prediction: $182.34 (+1.2%)
30-Day Prediction: $184.36 (+2.3%)
📈 Note: The DSS is projecting slower upside in comparison to the Smart Money AI suite. This divergence suggests that while short-term price may rise, the major move could depend on external catalysts.
🌍 Macro & Catalyst Outlook
NASDAQ Tech Momentum: Q2 earnings in July will be a key macro driver
Yields & Dollar Index: Softening DXY supports tech; watch 10Y real yield inversion
AI Sector Beta: GOOGL is lagging NVDA/MSFT but may play catch-up into August
CPI/Inflation Watch: If inflation readings cool, it may trigger flows into mega-cap tech
Fed Policy Risk: September dot-plot shift could trigger volatility (Fed pivot vs sticky inflation)
🧠 WaverVanir DSS Conclusion:
📌 Bias: Bullish-to-Neutral
📌 Trade Zone: Watching for breakout above $184 to trigger sweep toward $196–202
📌 Invalidation: Break below $168 invalidates bullish structure; targets $144 liquidity pool
📌 Strategy: Standby mode; entry requires confirmation of volume breakout above range high.
📢 WaverVanir Insight:
"Smart Money has shown its hand — compression is a prelude to expansion. We're monitoring confluence between AI signal alignment and SMC structures. $196 target remains valid unless CHoCH flips bearish with volume."
#WaverVanir #VolanX #SmartMoneyConcepts #GOOGL #AITrading #InstitutionalFlow #LSTM #VolumeProfile #TradingView #MacroAnalysis #StockForecast #Alphabet #MarketForecast

GIS to $100 by 2030?Looking at the previous chart patterns and RSI indicator, I am going to be looking for a reversal around the $55.00 level.
This could be a great opportunity to get into a long term position with huge upside potential.
The RSI looks very similar now, to how it did in December of 2018 when it went into an uptrend.
TP1 $60
TP2 $70
TP3 $90
I am mostly posting this so I can look back on my theories and see how I can improve on my trading strategies. Please leave your feedback below, thank you.

REDINGTON✅ Redington Buy Trade Setup
Parameter Value
Entry 287
Stop Loss (SL) 278
Risk 9 pts
Reward 88 pts
Target Price 375
Risk:Reward (RR) 9.8
📍 Other Key Levels
Metric Value
Last High 327
Last Low 279
Point Variance 48
🔎 Interpretation & Trade Insights
🔼 Trend Confirmation: Every timeframe shows an uptrend, which confirms directional conviction.
🎯 Entry Zone Strength: Your entry at 287 sits well within the Daily & Intraday demand zones (278–297), suggesting strong support below.
🛡️ Tight SL: A very tight SL of 278, right at the confluence of multiple zones. This minimizes risk.
📈 High R:R Ratio: With a Risk:Reward of 9.8, this is an excellent asymmetric setup—ideal for swing or positional trading.
💡 Target of 375 is significantly above the last high (327), which means price will need to break out to fresh highs for full realization. Keep an eye on price action near 325–330 zone for profit booking or SL trailing.
⚙️ Suggestions for Execution
🔁 Trail SL: Once price hits above 310, consider adjusting SL to entry (287) or slightly above to lock in gains.
🧱 Watch Resistance: 327 (previous high) could act as short-term resistance.
📊 Volume Confirmation: If volume expands above 300, it would strengthen breakout potential toward 350+.
📊 Demand Zone Summary
🕰️ High Time Frame (HTF)
Timeframe Logic Proximal Distal Avg
Yearly Support 225 173 199
Half-Yearly RBR Pattern 215 173 194
Quarterly BUFL + Breakout 211 173 192
HTF Avg 217 173 195
📆 Medium Time Frame (MTF)
Timeframe Logic Proximal Distal Avg
Monthly Support 300 175 238
Weekly Support 300 278 289
Daily BUFL/DMIP 287 278 283
MTF Avg 296 244 270
⏱️ Intraday Time Frame (ITF)
Timeframe Logic Proximal Distal Avg
240 Min DMIP 293 278 286
180 Min DMIP 297 278 288
60 Min DMIP 294 278 286
ITF Avg 295 278 286

BSE💼 BSE Trade Plan Details
Parameter Value
Entry Price 2079
Stop Loss (SL) 1861
Risk 218 pts
Reward 1924 pts
Target 4003
Risk:Reward (RR) 8.8
🔎 Reference Data
Last High 3026
Last Low 2049
Point Var 977
✅ Key Observations & Strategic Notes
Trend Strength: All HTF, MTF, and ITF are in a confirmed uptrend.
Entry Zone: 2079 is right around the MTF average proximal zone — indicating a strong base for long entry.
Stop-Loss Safety: SL at 1861 is just below the weekly demand zone — providing a safe cushion.
Reward: A target of 4003 gives you a clean Risk:Reward ratio of 8.8, which is highly favorable.
Volume Play: Since price is near the recent low (2049), any break above recent consolidation could trigger momentum toward 3000+ zone.
60M Distal Zone at 8544 seems like a data error (likely a typo) — not aligned with other ITFs or HTFs.
⚙️ Recommendation
Entry looks optimal with alignment across MTF.
If BSE consolidates between 2040–2080, consider adding more positions with tighter SL using ITF (60m) confirmations.
Consider partial profit booking near 3000, then trail SL for extended target at 4003.
📈 BSE Multi-Timeframe (MTF) Analysis Summary
All timeframes signal a strong bullish trend, confirming buy-side conviction across HTF, MTF, and ITF.
🔷 High Time Frame (HTF) – Long-Term Demand Zones
Timeframe Trend Analysis Proximal Distal Avg
Yearly UP RALLY RALLY 857 641 749
Half-Yearly UP RALLY RALLY 1078 702 890
Quarterly UP Breakout + Demand 2038 1654 1846
HTF Avg 1324 999 1162
🔷 Mid Time Frame (MTF) – Medium-Term Demand Zones
Timeframe Trend Analysis Proximal Distal Avg
Monthly UP Support 2038 1654 1846
Weekly UP Support 2038 1861 1950
Daily UP DMIP + BUFL Demand 2162 2088 2125
MTF Avg 2079 1868 1974
🔷 Intraday Time Frame (ITF) – Short-Term Demand Zones
Timeframe Trend Analysis Proximal Distal Avg
240 Min UP DMIP Demand 2162 2088 2125
180 Min UP DMIP Demand 2162 2088 2125
60 Min UP DMIP Demand 2079 8544 5312
ITF Avg 2134 4240 3187

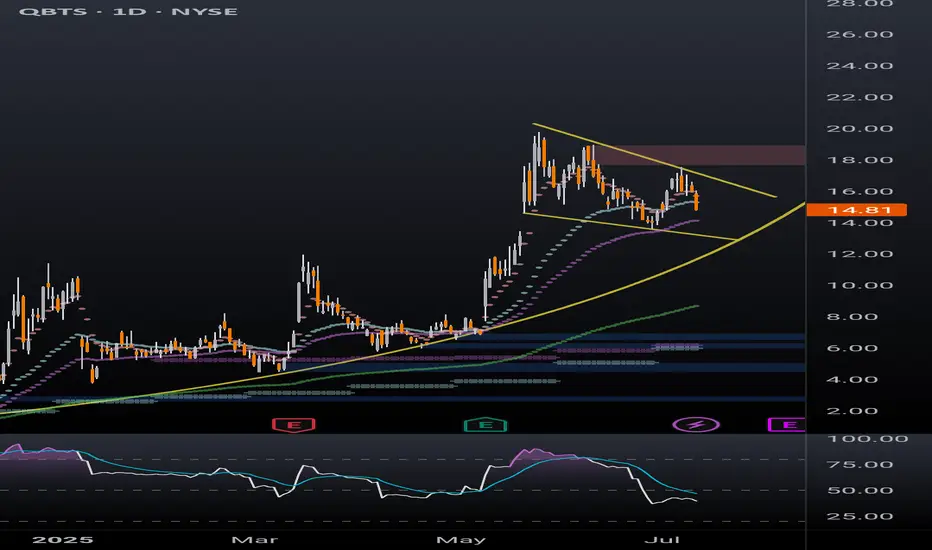
QBTS bull flag dailyBetter look at quantum computing ticker QBTS bull flag on the daily timeframe. Previous post looked at the weekly timeframe to highlight the bullish momentum. Lots of retail money piled into this one in the last few months, a breakout of this bull flag will likely be followed by a parabolic move.