7/9/25 - $envx - Friends tell friends the truth7/9/25 :: VROCKSTAR :: NASDAQ:ENVX
Friends tell friends the truth
- not a fan of Raj, seems inauthentic on one front... and tbh, that might seem "judgy". i've made my money on wall street reading mgrs in the first 5 seconds i meet them. i'd just not give this guy my money, that's all. it's my human LLM.
- the company financials look ready to "explode" (mm in a good way) if you ask wall street/ expectations. but i don't trust that either. i always do my own work.
- all battery (*cough* meme) tech has done well since april lows
- important to choose names that have solid balance sheets, growth ... and ideally leaders in both respects. i keep coming back to NYSE:SES given it's size, similar if not better growth vs. much larger comps. more chemistry-agnostic software/tech
- so am i actually shorting ENVX. no. but i find too many ppl these days will put a "buy" on things that are buys and "holds" (whatever that means) and actual sells get a "ehh... keep it..". NO. if it's not working OR you have better alternatives dump that trash.
Listen. class in session here for a moment.
One of the most important things you can do in trading, poker and life (all are very similar - also different - but similar)... is when you have a bad hand, you get introduced to a sus person... you find yourself in an unfavorable decision AND you can decide to either engage or just say "thanks but no thanks"... say "thank you very much and no thank you". Don't say "thank you and i'll follow up" or "thank you and i'll consider it". forget that waste of your time. "thank you" (be polite) and "no thank you" all in the same sentence. if you've got some history/ legacy/ other ties.. more complicated. But of course, when we look at stonks, we can have that decision. If we lose a bit of coin. what. f'n ever. nobody EVER shoots 100%. or 80% or even 70%. move on. take your losses. move on. if a stock is non-obvious. move on. maybe you come back to it. should be for a good reason beyond FOMO. but re-consider. alas. you have the decision to say no.
we talk about time being scarce. so is your ability to give two shoes about some of these stocks. if you're not high conviction, then forget it. time is too short to diversify and make excuses.
make time for those who matter
make space in your PnL for the stocks that will drive results
and forget the rest.
Gn my friends
V

at strong support level A support level is formed when a market's price action reverses and changes direction, leaving behind a peak or trough (swing point) in the market ..

Long TradeThe Ramco Cements This stock has broken out of cup&handle pattern and we can take a long trade in this stock at current CMP 1111 with SL of 3.5% and target will be 20% which we will achieve at point 1350.
Our profit ratio is 1:6.

7/9/25 - $flnc - Does the AES offer...7/9/25 :: VROCKSTAR :: NASDAQ:FLNC
Does the AES offer...
- AES *apparently* got a takeout offer y day (check stock px)
- i'd believe it, as long as they don't get coreweave'd (*sigh*)
- that aside, i can swear i was reading about grid scale M&A in my newsflow and Grok isn't helping tn
- I think FLNC is super interesting given it's AES/ siemens ownership and given this AES topic/ buyout
- perhaps this asset gets divested
- i'd guess *if* and that's a h3ll of a guess... maybe a lot higher 30-50%
- probably a stock to have on high alert... if breaks the $9/$9.50 level i may ape with a bit more conviction.
V

Can Ondas Holdings Redefine Defense Tech Investment?Ondas Holdings (NASDAQ: ONDS) is carving a distinct path in the evolving defense technology landscape, strategically positioning itself amid escalating global tensions and the modernization of warfare. The company’s rise stems from a synergistic approach, combining innovative autonomous drone and private wireless network solutions with shrewd financial maneuvers. A pivotal partnership with Klear, a financial technology firm, provides Ondas and its growing ecosystem with non-dilutive working capital. This off-balance-sheet financing mechanism is crucial, enabling rapid expansion and strategic acquisitions within the capital-intensive defense, homeland security, and critical infrastructure sectors without shareholder dilution.
Furthermore, Ondas's American Robotics subsidiary, a leader in FAA Type Certified autonomous drones, recently cemented a strategic manufacturing and supply chain partnership with Detroit Manufacturing Systems (DMS). This collaboration leverages U.S.-based production to enhance scalability, efficiency, and resilience in delivering American Robotics' advanced drone platforms. This domestic manufacturing focus aligns seamlessly with initiatives like the "Unleashing American Drone Dominance" executive order, which aims to bolster the U.S. drone industry, fostering innovation while safeguarding national security against foreign competition.
The company's offerings directly address the paradigm shift in modern warfare. Ondas's private industrial wireless networks (FullMAX) provide critical secure communication for C4ISR and battlefield operations, while its autonomous drone solutions (like the Optimus System and Iron Drone Raider for counter-UAS) are integral to evolving surveillance, reconnaissance, and combat strategies. As geopolitical instabilities intensify, driving unprecedented demand for advanced defense capabilities, Ondas’s integrated operational and financial platform is primed for significant growth, attracting considerable investor interest with its innovative approach to capital deployment and technological advancement.

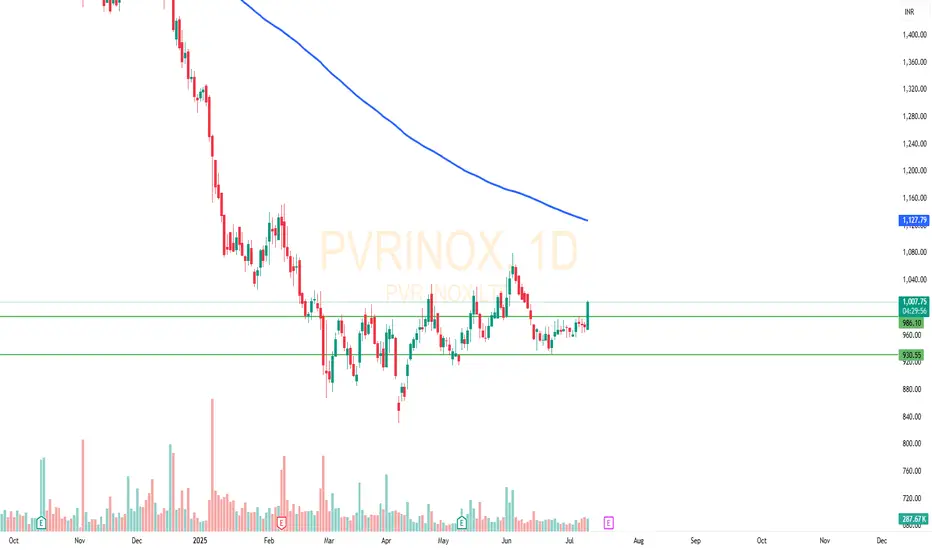
PVR INOX | Bullish Breakout📊 *Stock:* PVR INOX (PVRINOX)
🕒 *Timeframe:* Daily Chart
📈 *Technical Structure:* Breakout from a multi-month consolidation zone
The stock has successfully broken out above the crucial ₹965 resistance level, with a noticeable rise in volume — indicating potential momentum building up.
🔹 *Breakout Zone:* ₹990
🔹 *Next Resistance Targets:* ₹1050 and ₹1170 (near 200 EMA)
🔹 *Support Levels:* ₹915 and ₹870
🔹 *Short-Term Trend:* Bullish Bias
🔹 *Volume Confirmation:* Yes
This setup indicates strength, but traders must watch for follow-up candles and volume support for sustained movement.
🔴 *Disclaimer:*
I am not a SEBI registered investment advisor.
This idea is shared solely for educational and informational purposes, based on technical chart analysis.
It should not be considered as financial advice or a recommendation to buy or sell any stock.
Please consult a SEBI-registered financial advisor before making any trading or investment decision.
TPLPTPLP is gaining momentum now, it has not performed in previous rallies so it might be risky trade also the trend in not confirmed yet. If sustained 12.2 then it can give fantastic returns.

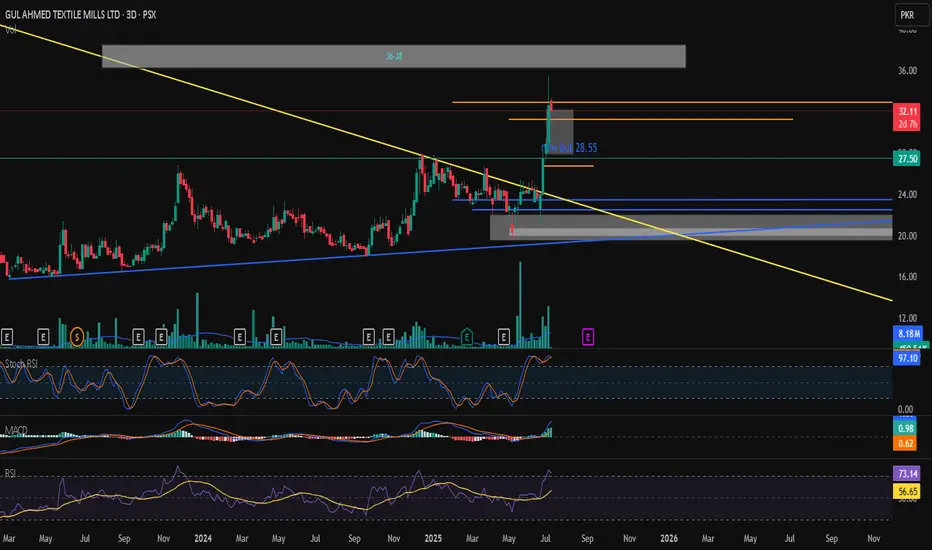
gul ahmed textileGATM is set to make 38, but before making till 38 it will retest 28.6 which is opportunity for new entry. all the indicators on each time frame show strong upward trend
Engineers India LtdThe stock is showing strong bullish signs across multiple timeframes:
☕ On the daily chart, it's forming a classic Cup and Handle pattern – a reliable bullish continuation signal.
🔵 On the weekly timeframe, a rounding bottom is clearly visible, adding strength to the longer-term structure.
📍 Neckline: ₹246
🎯 Potential Targets: ₹250 → ₹260 → ₹270
🛡️ Stop Loss: Below recent swing low for risk control
A breakout above ₹246 could trigger a strong move, supported by both pattern formations and structure across timeframes.
Not financial advice – just sharing my analysis.

7/9/25 - $dpro - PSA... rotate7/9/25 :: VROCKSTAR :: NASDAQ:DPRO
PSA... rotate
- saw some d00d shilling this
- couldn't help myself
- this isn't a company with a future outside M&A or restructuring
- the meme move is simply what we've gotten in chitco's since the liquidity bottom in april
- you do you
- but friends don't let friends drive drones or PnL drunk
V

V I P Industries LtdVIP Industries – Consolidation with Upward Movement Supported by Strong Volume
VIP Industries is currently undergoing a consolidation phase, but within this range, the stock is gradually moving higher, supported by healthy volume. This is typically a bullish sign, as it suggests accumulation is taking place during the consolidation.
The increase in volume alongside rising prices within the range indicates buying interest and participation from stronger hands, potentially setting the stage for a breakout if the momentum continues.
VIP Industries is showing strength within its consolidation zone. The rising price action backed by strong volume is a positive technical signal, hinting at a potential breakout if current momentum sustains.

7/9/25 - $sldp - Pass.7/9/25 :: VROCKSTAR :: NASDAQ:SLDP
Pass.
- this thing just has kinda weak energy top line growth
- maybe that changes
- burns cash (which is "fine" - big quotes - if there's some real lift off on growth, which there's NOT)
- my impression (change my mind) is this co got listed to create bag holders for the bag holders
- not going to look at it much more closely tn given it's getting late and i need to get thru a few more of these
- but high net cash is good - they won't be dunking on the market
- i just think the stonk px performance reflects the high-beta-high-meme sector (and there are honestly some good reasons some of the stocks worked)... but idk if i'd be paying up for this one
- sidelines.
V

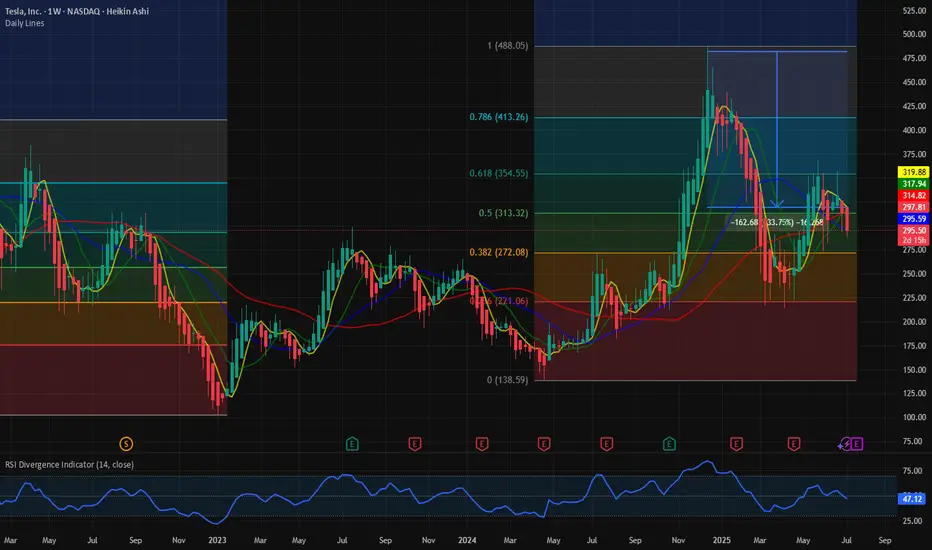
$TSLA: Battleground stock. There’re better way to make money. In this bull market where almost all the stocks are working, NASDAQ:TSLA seems to be still in the penalty box. When NASDAQ:NVDA , NASDAQ:MSFT are at ATH and most of the Mag7 are near to the ATH. NASDAQ:TSLA is still 33% below its ATH of 484 $. And the price action is not particularly bullish. This week NASDAQ:AVGO crossed NASDAQ:TSLA with a larger Market Cap cos. May be NASDAQ:AVGO should replace NASDAQ:TSLA in MAG7. A food for thought.
With such poor price action and the price stuck within the 0.618 and 0.382 Fib retracement levels the stock has not looked bullish recently. IN this recent market reversal all the speculative sectors like Quantum, Space stocks and Drone stocks are working, NASDAQ:TSLA is still searching for direction. In my opinion NASDAQ:TSLA has a great future with a visionary leader, but it might end up being a good company but not a good stock. With controversy surrounding the leadership it has become a battle ground stock. There are many large cap liquid stocks where the positive momentum is working. Until the stock breaks out of this consolidating pattern it’s better to make money somewhere else.
Verdict: Stay on sidelines for NASDAQ:TSLA stock. Accumulate if you need to. Buy it above 400 $ once momentum is back.
7/9/25 - $ampx - Hrm. Got my interest.7/9/25 :: VROCKSTAR :: NYSE:AMPX
Hrm. Got my interest.
- high energy, high power lithium ion warez for aviation etc.
- i think what's most interesting are two things
1/ i first came across this in march '24 and said "not interested - bonkers valuation" and in some resepects... for a year... esp given mkt had been ripping, it was awful risk-on reward
2/ NOW, if you look at the revenue #s over that period forward, they basically continuously crushed. and the YoY comps are almost laughably high... >100% growth for the next 2 years. that's, let's get serious... pretty amazing if true
- gross margins improving (lol at these scale growth rates... i'd HOPE)
- and we get to EBITDA breakeven maybe late '26... by '27?
- co doesn't really burn much cash, 30-40 (M) bucks a year... they'll probs need to raise, maybe it gets well-received given px action recently idk.
- definitely serving an interesting niche.
- valuation is basically in no-man's-land
- price action is not only KING, but taking a step back... it can be somewhat justified. this isn't just some vaporware trust-me-bro-quantum-is-the-future-in-2030-BS-situation
- and the chart looks pretty.
- i'm not going to trade this. eventually you get older, you narrow down your arsenal to stuff that is high impact high hit rate... and you stick to it. but i'd consider longing this from a trading perspective. problem is... i have too much discipline at this pt and again, my comp is NYSE:SES which hasn't really moved, is 10x cheaper (literally) in terms of enterprise value and only 1/2 the revenue and better mgns. so yeah.
- i'm not suggesting this is a short. i'm not gonna buy it. i might buy it lower. i'm no longer doom and gloom like a year ago.
- but no thanks. i still need moarrrr.
V

SNBL PROBABLY IN WAVE ' Z ' OF B or CThis is in continuation of our ongoing tracking of SNBL wave structure, prices have broken above the 22.50 level indicating one more leg upwards.
Currently the price is unfolding as wave Z which will target 26 - 28.50 zone, however the prices should decline towards the 20.70 - 19.80 level (buy zone) before rising again.
If the prices go below the 18.60 level, it will significantly weaken this wave count. we will only activate this trade if price reach our buy zone.
If the wave count is correct then this trade will provide us minimum 25.60% gross gain.
Trade Setup:
Entry level: 20.70 - 19.80
Stop loss: 18.59
Target: 26 - 28.50
Let see how this plays, Good Luck!
Disclaimer: The information presented in this wave analysis is intended solely for educational and informational purposes. It does not constitute financial or trading advice, nor should it be interpreted as a recommendation to buy or sell any securities.

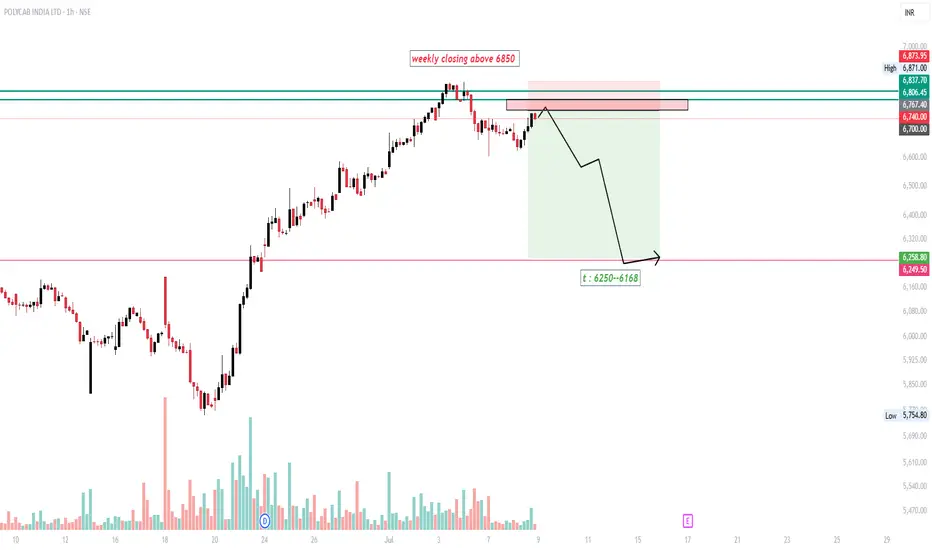
POLYCAB INDIA SHORT SELLTrade Idea : Polycab India Ltd (NSE: POLYCAB) SHORT SIDE
Current Price : ₹6,740
Resistance Zone: ₹6,800 – ₹6,875
Bias : Short (Sell) below resistance
Rationale
Polycab India Ltd is currently facing strong resistance in the ₹6,800–₹6,875 zone. The price has attempted to break above this area but failed to sustain, indicating potential exhaustion of bullish momentum. Unless there is a weekly closing above ₹6,850, the setup favors a short position targeting a pullback.
Trade Plan
Entry: Near ₹6,800–₹6,875 resistance zone or red zone
Stop Loss: Above ₹6,875 (weekly close above ₹6,850 invalidates the setup)
Target: ₹6,250–₹6,260 zone
Risk-Reward: Favorable, with a clear invalidation point and defined downside target
Chart Observations
Price action shows repeated rejection in the marked supply zone.
Volume analysis supports the likelihood of a reversal.
The projected path anticipates a move down to the ₹6,250 area, as highlighted on the chart.
Disclaimer
This analysis is for educational purposes only and does not constitute financial advice or a recommendation to buy or sell any securities. Trading and investing in the stock market involves risk. Please do your own research or consult a qualified financial advisor before making any trading decisions. The author is not responsible for any losses incurred as a result of following this analysis.
AMP(ASX) Monthly ChartDoubling up on my prior post,
The quarterly and the monthly chart both have the same 2618 pattern present
If today closes where it is we will have the same bullish pattern on 2x timeframes both with bullish hammer patterns present

7/8/25 - $qs - Pass. No thanks.7/8/25 :: VROCKSTAR :: NYSE:QS
Pass. No thanks.
- Great story bro, company
- Does this thing continue to ape higher a la meme market? idk idc
- I think pre-revenue stuff can be interesting if there's clear visibility toward scaling revenue or the costs are contained, but let's be real... 4 years post de SPAC and this thing has just ""now"" turned the corner
- maybe.
- i'll give you that. maybe.
- i'm not close to it, i'm going to turn over the battery "rocks" tonight to see if i can find anything more compelling than NYSE:SES (ironically, the smallest cap battery-related name... usually it's the opposite - the big stuff is more de-risked and obvious)
- so here we have a co that's just doubled it's stonk price on this announcement
- do investors genuinely believe manufacturing is "easy" or this transition to scaling or monetizing the JV w VW will start to justify a nearly $4B enterprise value "easily"?
- here's what i'll give the bulls, especially those coming to the story fresh and without all this: run-rating nearly $400mm in R&D is probably worth something (*throws finger into rear end and then into the air*) in the $400/.2 = $2 bn region (20% is a high benchmark for risky tech, it should be higher but again let's give a lil cred). I tend to like to double this (usually for co's that r revenue-generating and have traction) but let's just throw V's rules out the window and do it here - alas i don't know what i don't know - and perhaps there's something here. So that's $4 bn. So i better have a good idea or alpha to make money at this pt.
- add to this a TON of co's (that shouldn't be public co's) are doing all sorts of whacky jerk fests with banks... ATMs, converts... you name it! scammy banks are going to have a great year! so then i have to believe this co won't do any "proactive" raise. they shouldn't *need* to given nearly $1 bn in cash on the books... but again, tis not like they're going to buy back stock... so even if the risk is low... it's there.
- all in: i'd need a CLEAR catalyst that the co was hitting strides with OEMs, VW was seriously interested in taking this thing out and locking down this game changer tech. and that's just not what i want to have in my book at a 50 bps or 100 bps position *crossing fingers*. i go big. and it's hard for me to understand where i'd get that conviction.
- so i keep my finger on the battery pulse. it's a sector that is probably most exciting to me from an energy-investment perspective over the coming years. there will be some massive winners here. maybe NYSE:QS is one of those.
- but i'm going to pass.
V

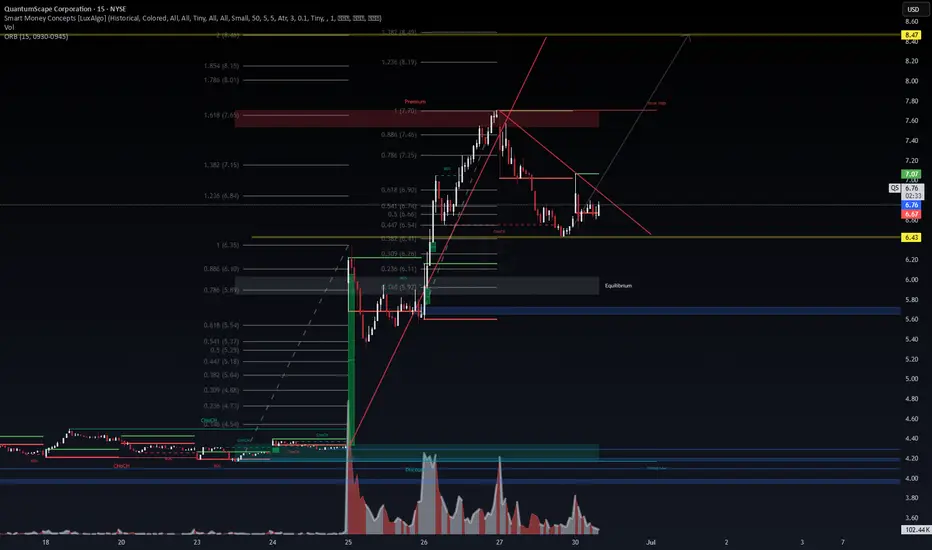
QuantumScape ($QS) – VolanX SMC Activation Zone🔍 Technical Context
QuantumScape is setting up for a potential bullish breakout after consolidating within a descending wedge and maintaining structure above the golden Fibonacci pocket (0.5–0.618 zone). Smart Money Concepts (CHoCH + BOS) have been triggered, indicating the start of institutional positioning. Volume has compressed, often a prelude to explosive movement.
📊 VolanX Probability Matrix
🎯 Probability of Bullish Continuation (Target $8.47): 70–75%
📉 Probability of Failure (Drop to $6.43 or lower): 25–30%
🧠 Key Levels & Confluences:
Entry Zone: Break & close above red trendline ($6.85+)
Premium Target: $7.65–7.70 (Liquidity Zone)
Final Target: $8.47 (Fib 2.0 Extension)
Stop-Loss Invalidation: Below $6.43 (structural break)
SMC Zones: Liquidity void + breaker retest + CHoCH confirmation
📈 Risk-Reward Setup:
RRR ≈ 3.8x, with structural confluence across Fib, volume, and SMC
💡 “We don’t just trade the chart — we activate the timeline.” – VolanX Protocol
🔐 This post is part of WaverVanir International LLC’s multi-asset DSS framework.
#SMC #QuantumScape #VolanX #WaverVanir #Fibonacci #SmartMoneyConcepts #OptionsFlow #LiquidityZones #Breakout #TradingStrategy #RiskReward #TechnicalAnalysis
A stock for swing tradeStock Transrail Lighting has broken out of cup&handle pattern. We can take a trade now at CMP 759 with a SL of 7% which will be at point 700 and our target will be 1000 in which we will make a profit of between 25%-30%. So we have 1:4 profit ratio.

ZS is starting the early sign of the Wyckoff distribution phaseMarkup (Phase E) that has been going on for months. But look closer. The momentum is getting tired. The daily chart is where the truth comes out. After that magnificent run, the price has stalled and started moving sideways for a month.
Entry Level: Initiate a trade if ZS rallies to the $325 - $327 area and fails to hold its gains.
Price Target: The ultimate target is the start of the markdown phase, with an initial price objective around $250.
Stop Loss: A confirmed weekly close above $335 would indicate the distribution pattern has failed and you should exit the trade.

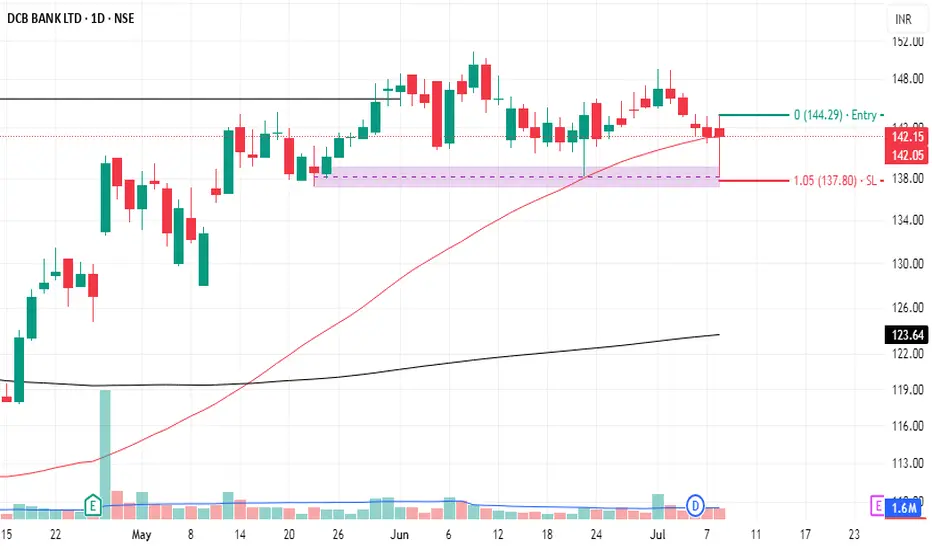
DCB BANK -fundamentally attractive and looking goodDCB Bank is fundamentally attractive value‑wise: strongly capitalized, efficient, and profitable, yet deeply undervalued. However, potential risks include credit quality and low free cash flows.
Stock has found support from medium-term moving averages.
$AAPL: Multi-Cycles At PlayResearch Notes
Documenting New Interconnections
Wave properties:
3rd frame of reference
Multi-Cycles
Fibs of broader cycle
Using coordinates of the recent established cycles for predictive/guiding properties:
