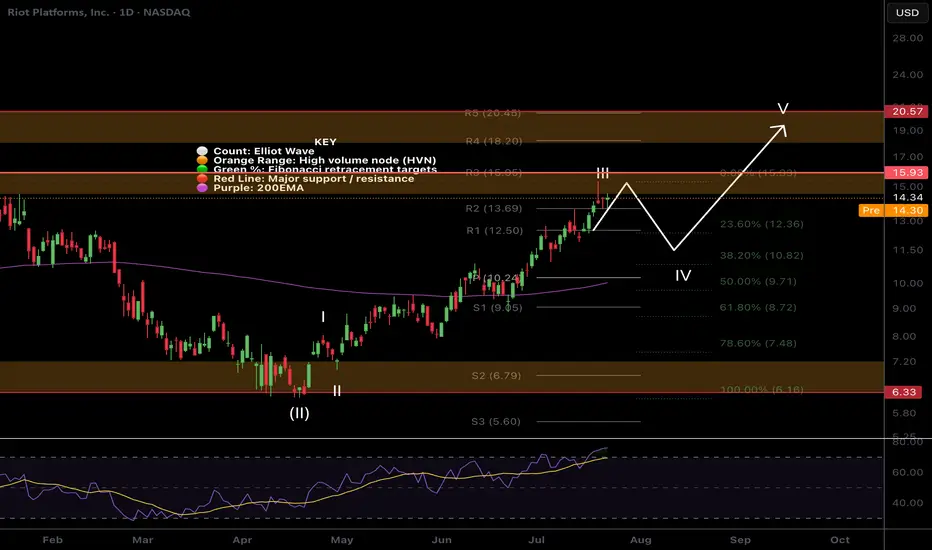
$RIOT Targets hitNASDAQ:RIOT has hit my take profit target at the High Volume Node and R3 daily pivot where it has found resistance.
Wave III appears to be complete with wave IV expected targets being the 0.382-0.5 Fibonacci retracement, also the daily pivot point and ascending daily 200EMA, $10.24.
Analysis is invalidated if we continue to the upside with a new swing high. RSI is overbought no bearish divergence.
Safe trading
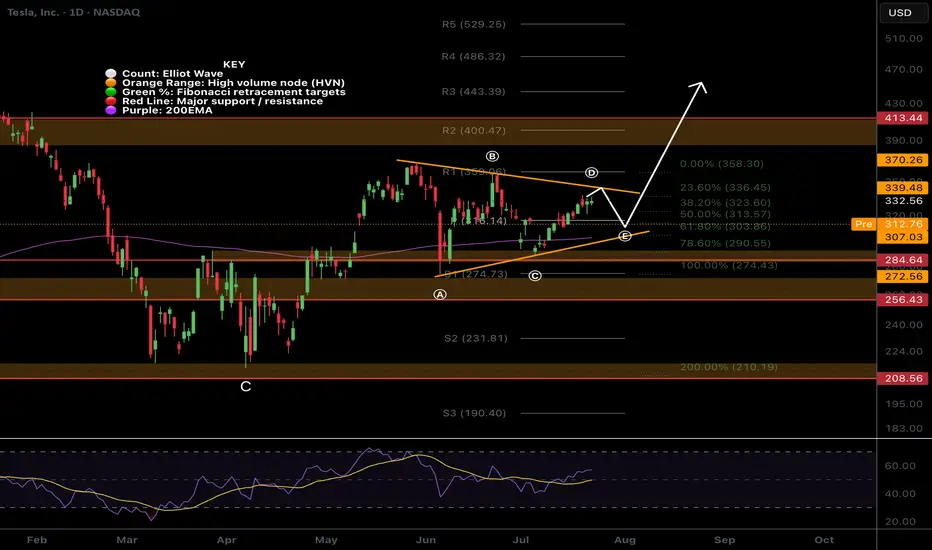
$TSLA Triangle?NASDAQ:TSLA triangle has presented itself with the recent price action. Triangle pattern target is $443 at the R3 daily pivot.
Wave e is expected to end at the daily pivot and wave d break is the signal to go long.
Analysis is invalidated below wave c.
Tesla Shares (TSLA) Drop Following Earnings ReportTesla Shares (TSLA) Drop Following Earnings Report
Yesterday, after the close of the main trading session on the stock market, Tesla released its quarterly earnings report. While both earnings per share (EPS) and gross profit slightly exceeded analysts’ expectations, the results reflected a negative trend driven by declining sales. This decline is being influenced by intensifying competition from Chinese EV manufacturers as well as Elon Musk’s political activity.
According to Elon Musk:
→ The company is facing “a few tough quarters” due to the withdrawal of electric vehicle incentives in the US;
→ The more affordable Tesla model (mass production expected in the second half of 2025) will resemble the Model Y;
→ By the end of next year, Tesla's financials should become "highly compelling".
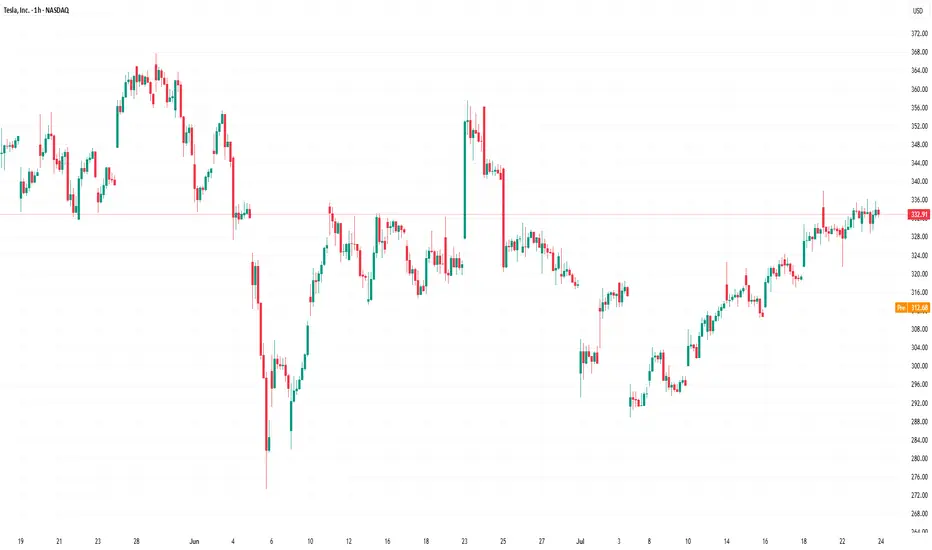
Tesla’s share price (TSLA) fell by approximately 4.5% in after-hours trading, clearly reflecting the market’s reaction to the report. Today, the stock is likely to open around the $317 level, down from over $330 just the day before.
Technical Analysis of TSLA Stock Chart
In our analysis of TSLA charts dated 2 July and 8 July, we outlined a scenario in which the stock price could form a broad contracting triangle, with its axis around the $317 level.
The new candlesticks that have appeared on the chart since then have reinforced the relevance of this triangle, as the price rebounded from the lower boundary (as indicated by the arrow) and headed towards the upper boundary. However, yesterday’s earnings report disrupted this upward move.
Thus, while the broader stock market is trending higher (with the S&P 500 reaching a historic high yesterday), TSLA may remain "stuck" in a consolidation phase, fluctuating around the $317 level—at least until new fundamental drivers shift market sentiment.
This article represents the opinion of the Companies operating under the FXOpen brand only. It is not to be construed as an offer, solicitation, or recommendation with respect to products and services provided by the Companies operating under the FXOpen brand, nor is it to be considered financial advice.
$IREN More downside after huge rally!NASDAQ:IREN is printing bearish divergence on the daily RSI at all tie high resistance.
An Elliot wave motif wave appears complete and wave looks underway with a shallow target of the daily pivot, 0.382 Fibonacci retracement and ascending daily 200EMA.
The daily red wick after printing a 20% start to the day is reminiscent of a blow off top in this asset trapping newbs with FOMO price discovery pump. Market behaviour in action!
Analysis is invalidated if price returns to all time high.
Safe trading

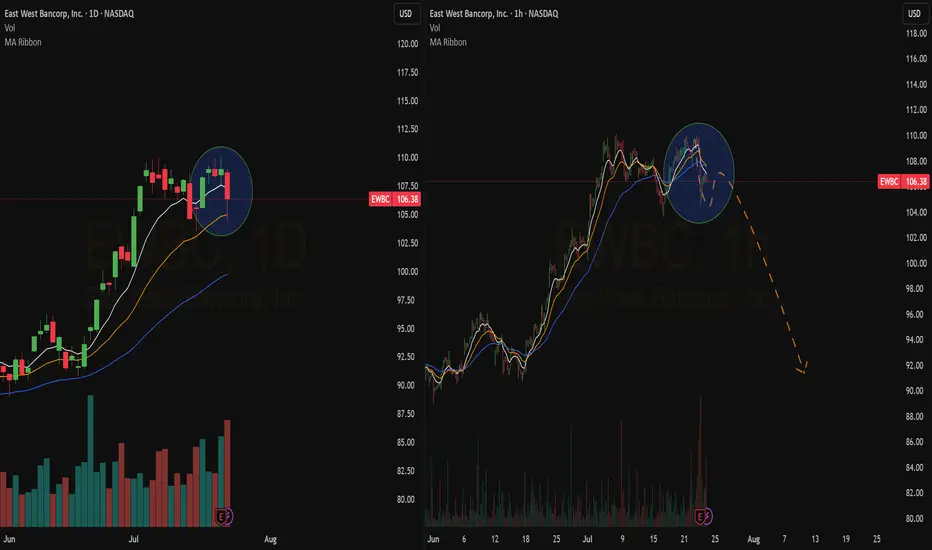
Quick View : $EWBCShort setup here
Bearish crossover on the hourly chart with double top at $110.
The price already crossed the level and made its FAST pullback.
I expect a sharp action here.
Bearish ATR Alert ready.
Reaty To Catch It
4162 - Technical AnalysisAs I like technical analysis and chart patterns.
I would see that any possible penetration from the down trend may lead to bullish move to future trgets.
NOT an advice to buy or sell

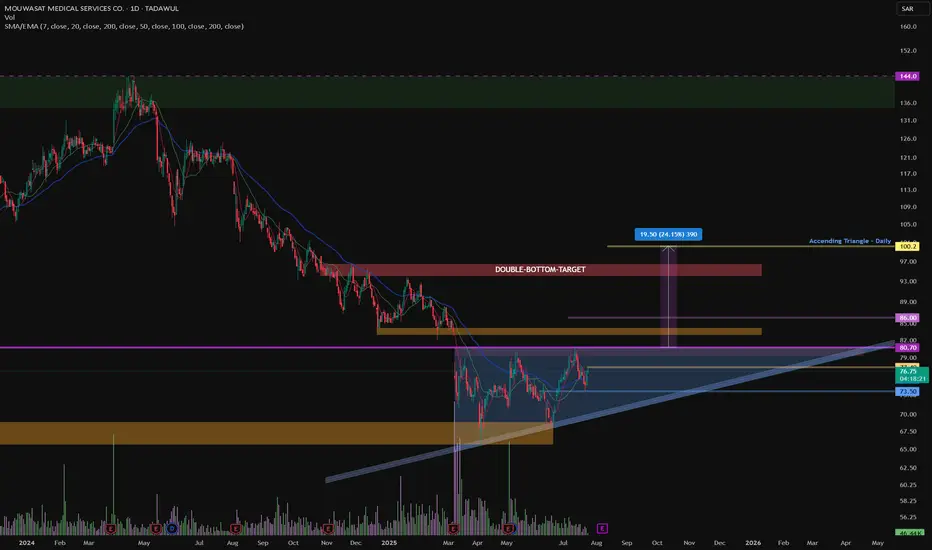
4002 - Technical AnalysisAs seen on the chart ... over a long investment plan.
We have a possible Double Bottom Reversal Pattern
We have a possible Acending Triangle on long term plan
2286 Technical analysis - ONLY 2286 Technical analysis - ONLY showing future targets as indicated on the chart.
This is not an advice to buy or sell.

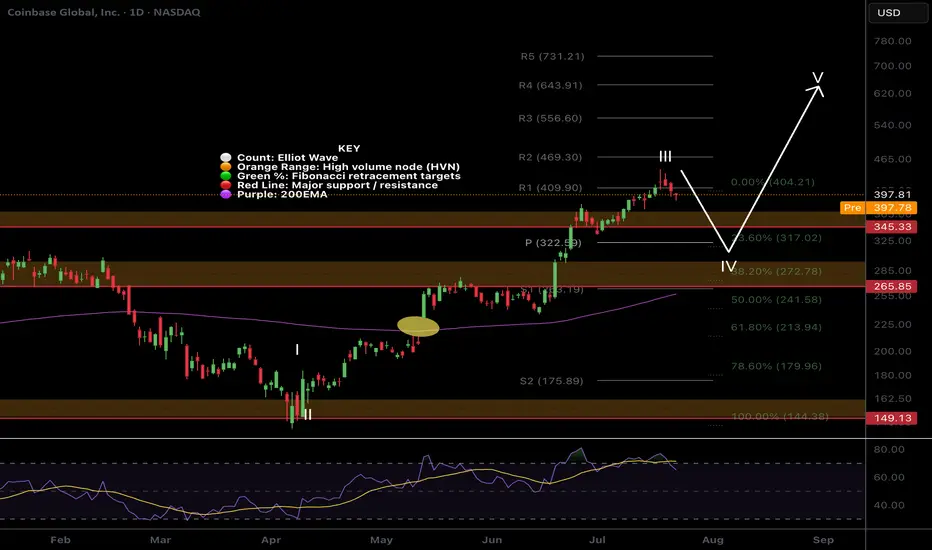
$COIN Wave 4 pullback?NASDAQ:COIN had a tremendous run, a text book Elliot wave 3 but has confirmed bearish divergence on the daily RSI.
The trend is strong so wave 4 could be shallow, only reaching the previous all time high, High Volume Node and 0.236 Fibonacci retracement and daily pivot point between $322-345
Further decline brings up the High Volume Node support at 0.382 Fib retracement and ascending daily 200EMA! Also a highly probable scenario!
Long term outlook remains around $600 target
Safe trading.
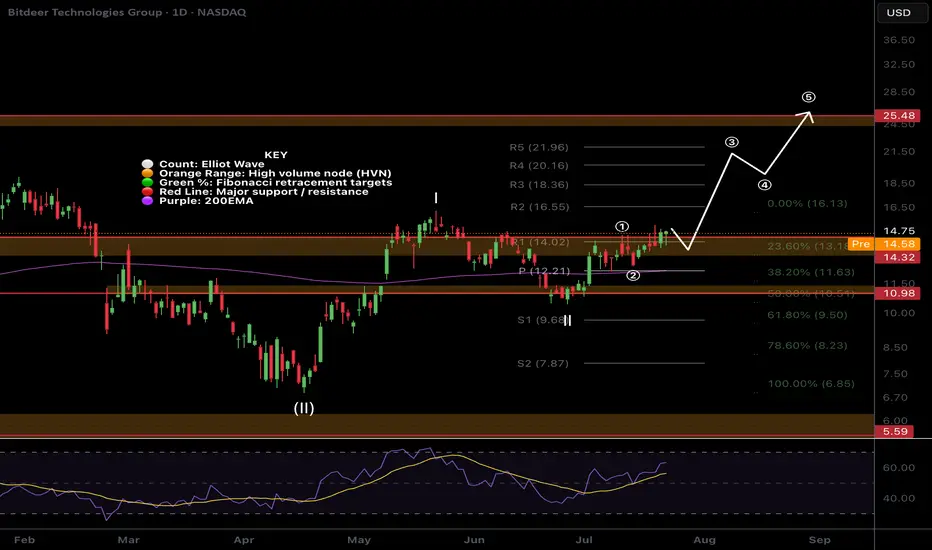
$BTDR Closed above resistance!NASDAQ:BTDR Bitdeer closed above major resistance yesterday, despite BTC and alt coins having a bearish day, triggering our long signal in the Weekly Trade signals substack.
I am looking for price to start to accelerate in wave 3 and resistance now support to hold. If BTC reverses it will add additional tailwinds with a target of the major resistance above the R5 daily pivot $24
Safe trading
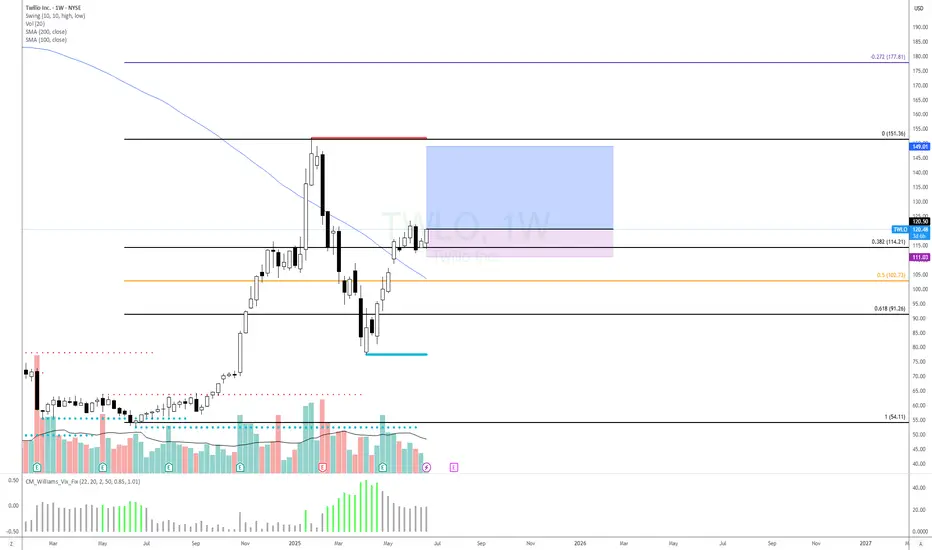
TWLO 24/06/2025 LONGPrice reacted to Fiboncci level, broke the 100MA on the weekly, and both 100&200MA on daily, seems like another leg is forming,
Good luck
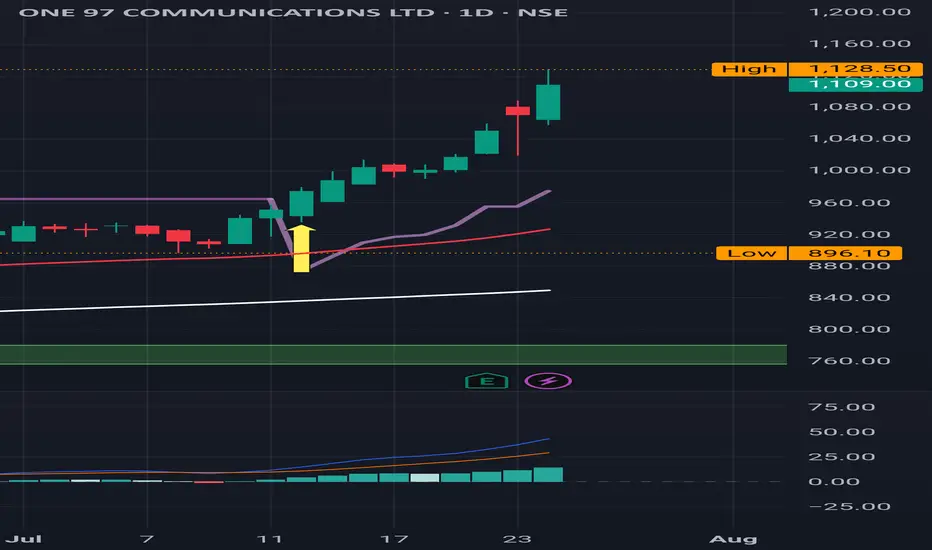
Paytm : It has cleared the major resistance level of 1062 Paytm : It has cleared the major resistance level of 1062 .
It's already in a Buy trajectory.
( Not a Buy / Sell Recommendation
Do your own due diligence ,Market is subject to risks, This is my own view and for learning only .)
Parallel StructureWe have a nice parallel structure sitting on top of a 50 EMA (in blue). A consolidation is happening. Interestly enough the 200 EMA(in orange) is close to the 0.382 Fib level. On the weekly chart you can see the bears gearing up. But the bulls are still in charge. Price needs to hold the 20.64 price range for the bulls.
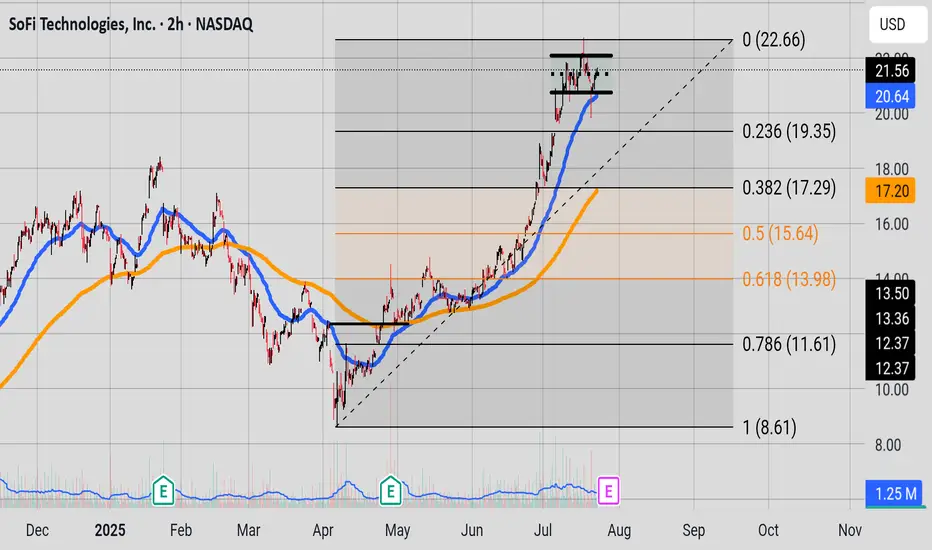
Figura tecnica Taza con asaCup-with-handle technical chart at a healthcare company powered by AI. Weekly long-term chart, long-term projection of $1,000

Pull back or ReversalPrice has fallen and is clinging to the 50 EMA (in blue) 13.97. Price is dancing outside the upward channel. If the 50 EMA does not hold price may fall to the 200 EMA 13.54 range in orange.

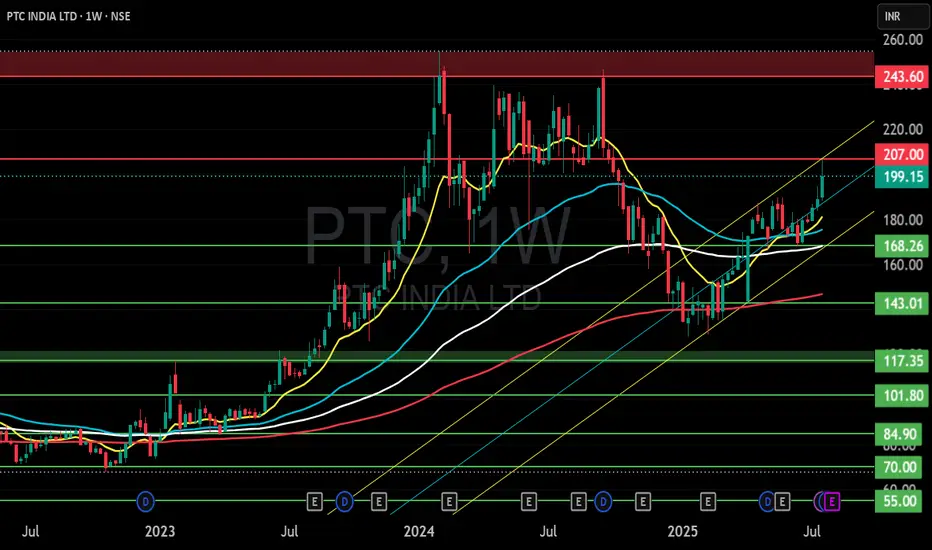
PTC INDIA LTD S/RSupport and Resistance Levels:
Support Levels: These are price points (green line/shade) where a downward trend may be halted due to a concentration of buying interest. Imagine them as a safety net where buyers step in, preventing further decline.
Resistance Levels: Conversely, resistance levels (red line/shade) are where upward trends might stall due to increased selling interest. They act like a ceiling where sellers come in to push prices down.
Breakouts:
Bullish Breakout: When the price moves above resistance, it often indicates strong buying interest and the potential for a continued uptrend. Traders may view this as a signal to buy or hold.
Bearish Breakout: When the price falls below support, it can signal strong selling interest and the potential for a continued downtrend. Traders might see this as a cue to sell or avoid buying.
MA Ribbon (EMA 20, EMA 50, EMA 100, EMA 200) :
Above EMA: If the stock price is above the EMA, it suggests a potential uptrend or bullish momentum.
Below EMA: If the stock price is below the EMA, it indicates a potential downtrend or bearish momentum.
Trendline: A trendline is a straight line drawn on a chart to represent the general direction of a data point set.
Uptrend Line: Drawn by connecting the lows in an upward trend. Indicates that the price is moving higher over time. Acts as a support level, where prices tend to bounce upward.
Downtrend Line: Drawn by connecting the highs in a downward trend. Indicates that the price is moving lower over time. It acts as a resistance level, where prices tend to drop.
Disclaimer:
I am not SEBI registered. The information provided here is for learning purposes only and should not be interpreted as financial advice. Consider the broader market context and consult with a qualified financial advisor before making investment decisions.
PATH --- Pop?PATH — Setting Up for a Pop?
UiPath (PATH) is showing signs of strength as it builds a base just above key Fibonacci support and prepares for a potential breakout in the broader AI + Robotics narrative.
Technical Setup:
Price holding above the 38.2% Fib retracement from the May rally.
Volume shelf + value area support at ~$12.30–$12.50 creating a launchpad.
21/50/200 SMAs converging — this type of compression often precedes expansion.
TTM Squeeze building pressure — prior squeezes on this name have led to fast directional moves.
Fundamental Tailwinds:
PATH is an automation leader riding the AI + enterprise software wave.
Sector rotation into Robotics and AI names (SYM, ROK, RR) lifting sentiment.
Recent dark pool activity shows accumulation—large 8M+ share blocks suggest institutional interest.
Thesis:
A close above $12.70 could trigger a move into the $13.40–$14.60 resistance zone, with a possible gap fill toward $18 on strong momentum.
Risk:
Invalidation below $11.80 (50% retracement / SMA cluster). Tight risk-reward if using LEAPs or long shares.

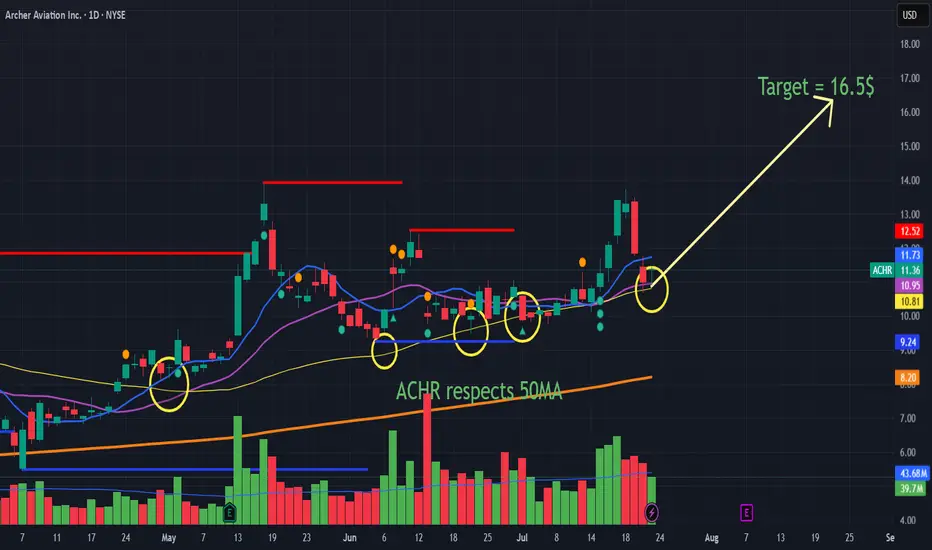
ACHR has bounced of 50MA and Next target is 16.5$ before 20$🚁 Archer Aviation (ACHR) NYSE:ACHR : $16.5 Could Arrive Fast
🔥 Pentagon Partnership Powers the Bull Case
Big News: Archer and Anduril team up to build a next-gen military hybrid VTOL for the Pentagon. This exclusive defense project fast-tracks Archer for major U.S. military contracts and funding.
www.axios.com
Cash Confidence: Archer just raised $430M, now sitting on $500M+ in cash—no near-term dilution risk, making it a strong, stable bet.
📈 Technicals: Chart Looks Strong!
50MA Support: ACHR keeps bouncing off its 50-day moving average (yellow circles), showing strong buying momentum.
Price Target: Technically, the $16.5 target is in play, with a sharp uptrend and volume surges bolstering bullish sentiment.
⚡ Why $16.5 Could Hit in August
🚀 Defensive Catalyst: Pentagon contract talk = institutional and retail buyers flood in.
💰 Balance Sheet Strength: No funding worries attracts more investors.
📊 Momentum: Chart, volume, and sentiment point to rapid upside—especially if military deals are announced.
Summary:
ACHR is set for a possible quick move to $16.5 on Pentagon news, strong funding, and powerful technical momentum. A major contract update could push it there as soon as August. If you are a trader then next levels are 16.5 and then 20$ but as an investor, this could easily reach 100$ over next 5 years.
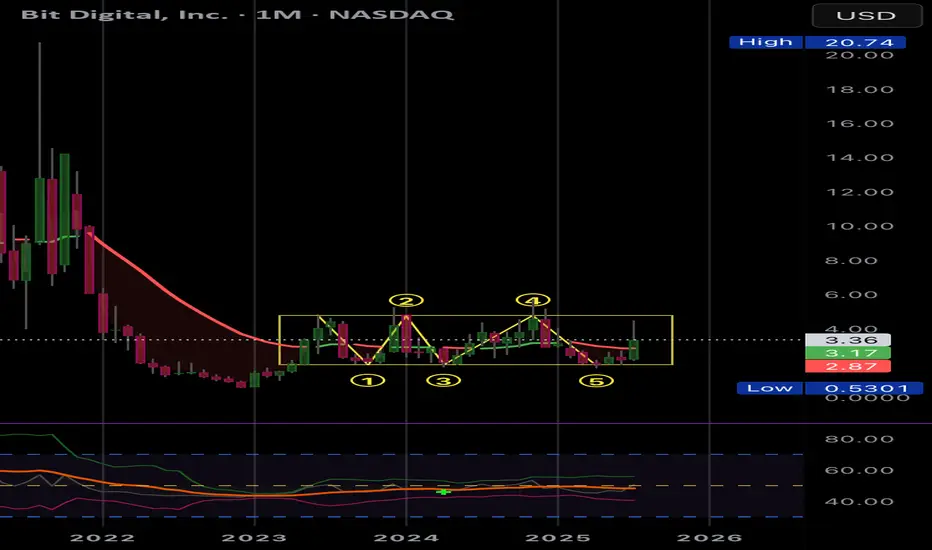
BTBT Consolidated, Ready to GoBTBT sideways consolidation is done. Check the wavetrend. BTBT holds Ethereum. Will have positive upside via altcoin bull.
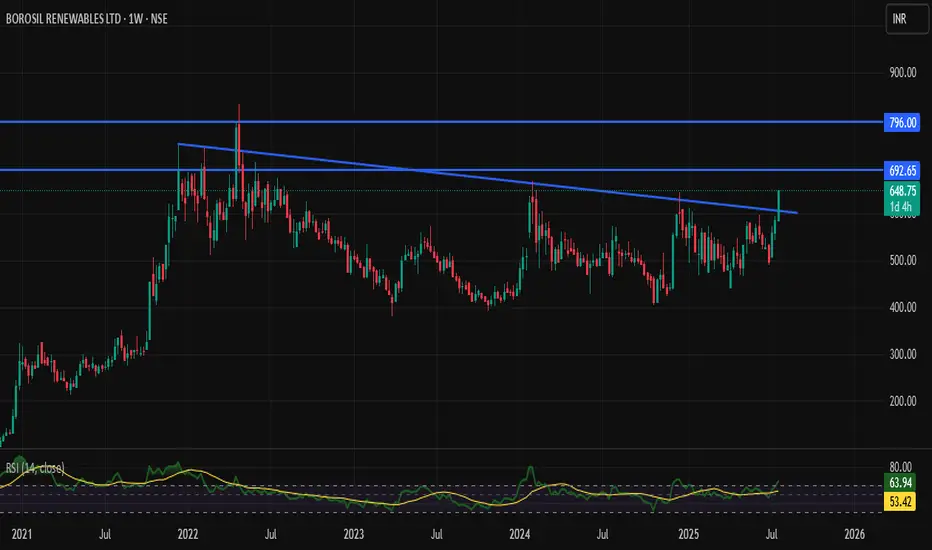
BORORENEW CMP 635.(Long consolidation range Breakout)After giving a sharp rally this stock was consolidation From 2022.Now we can see the chart it already make a big base .On monthly candle we can see rsi indicating a strong strenth.In coming days we can see 700.......750.......800 levels add this to your watchlist and see how it perform.
EFERT PROBABLY IN WAVE " 3 "- LONGThis is in continuation of our ongoing EFERT wave tracking
Last week price just broke above 214 (check previous posted idea/chart) providing confirmation that either the 4th wave is completed or it will further unfold into a complex correction.
Our preferred wave count suggest that wave 4 is over and we are in the 5th wave which will take price toward 265 - 270 and then 310 - 330 levels
Alternately, prices will consolidate sideward for a couple of more weeks before starting its upside move.
Unfortunately, we are not trading this setup at the moment because our hands are full.
Let see how this plays, Good Luck!
Disclaimer: The information presented in this wave analysis is intended solely for educational and informational purposes. It does not constitute financial or trading advice, nor should it be interpreted as a recommendation to buy or sell any securities.