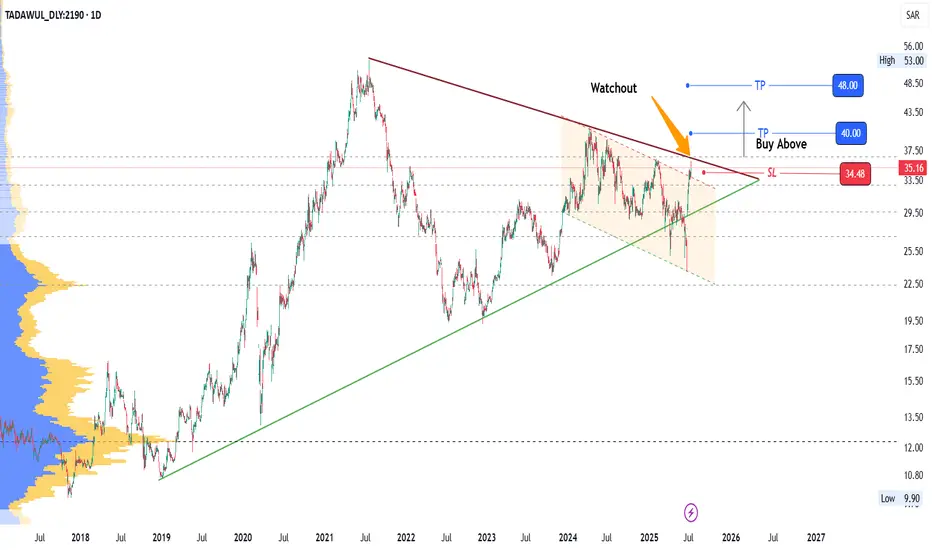
2190: Watch for Breakout2190 has reached Triangle Top (Trendline resistance) breaching a descending parallel channel resistance recently.
Watchout for the breakout of resistance.
Levels are marked.
Manage your risk with proper SL.
Enjoy the ride!
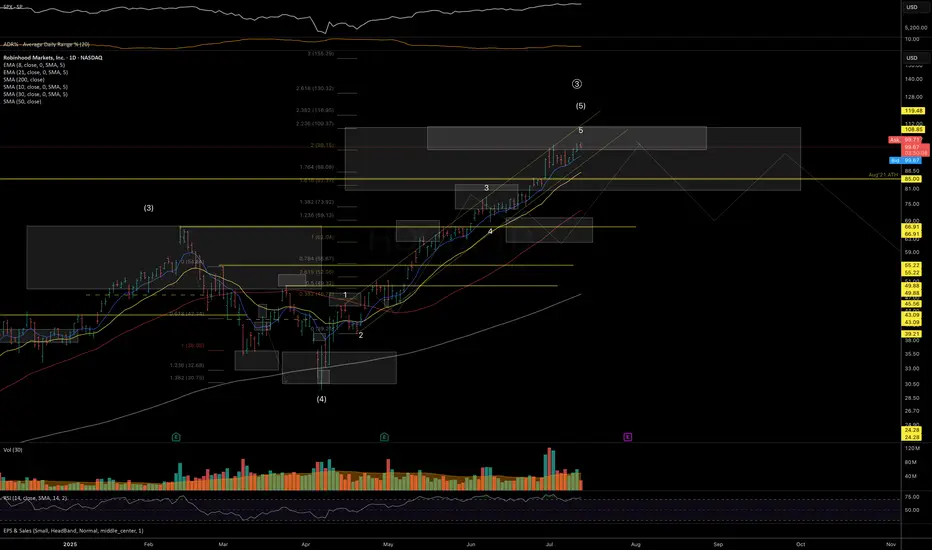
HOOD — In Key Macro Resistance ZonePrice has reached a major resistance zone, with the 110 level marking an ideal spot where downside pressure may begin to dominate and a mid-term top could start forming. Macro support for the macro-uptrend structure is at the 80–65 area.
Hedging near current levels may be prudent - especially ahead of earnings and while volatility remains relatively cheap.
Weekly view
Daily view:
Thank you for your attention and I wish you successful trading decisions!
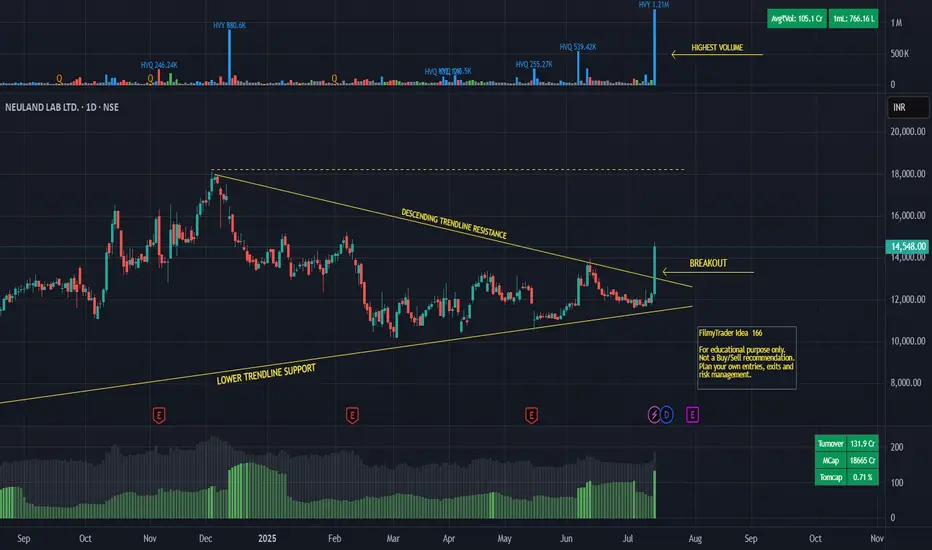
Neuland Lab - Trendline BreakoutNEULAND LABORATORIES LTD.
Breakout from trendline resistance on daily timeframe.
Breakout with heavy volume.
Close crossing last week high.
Increasing relative strength.
Disclaimer:
For educational purpose only.
Please do your own research before taking any trades.
Happy Trading!
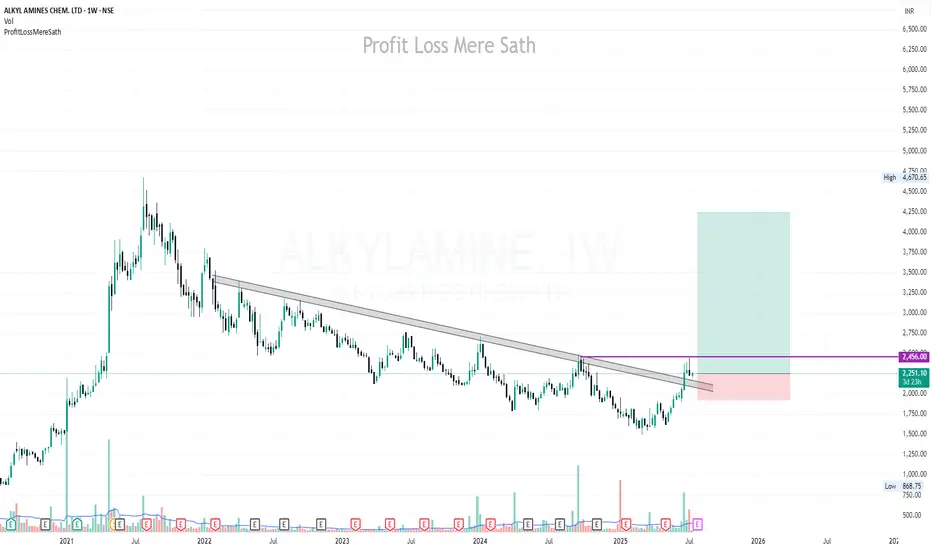
ALKYLAMINE | Buy @LTP | SL below 1900 | Targets 2700, 3440, 4250Disclaimer:
This is not financial advice. Please do your own research or consult with a financial advisor before making any investment decisions. Investments in stocks can be risky and may result in loss of capital.
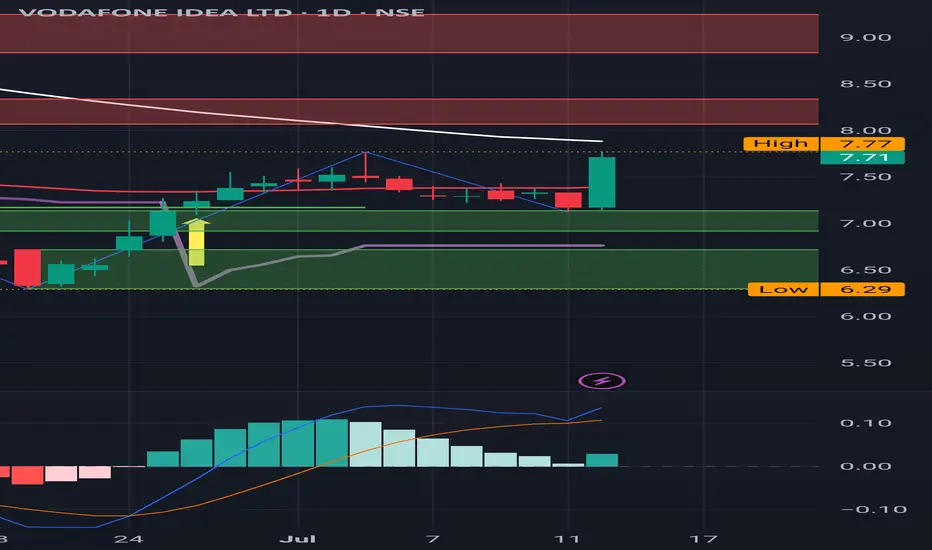
IDEA : Watch out for the Red Band resistances IDEA : Watch out for the Red Band resistances
( Not a Buy / Sell Recommendation
Do your own due diligence ,Market is subject to risks, This is my own view and for learning only .)
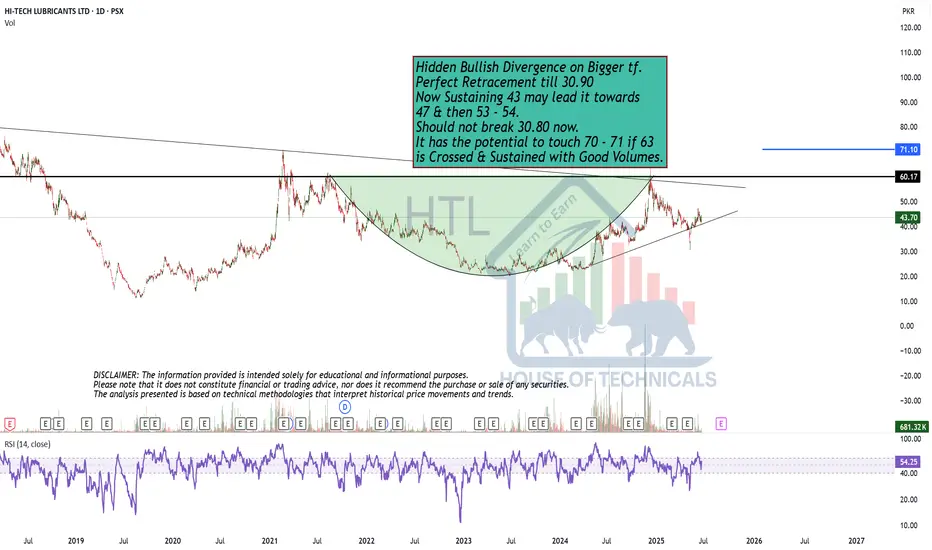
Perfect Retracement till 30.90Hidden Bullish Divergence on Bigger tf.
Perfect Retracement till 30.90
Now Sustaining 43 may lead it towards
47 & then 53 - 54.
Should not break 30.80 now.
It has the potential to touch 70 - 71 if 63
is Crossed & Sustained with Good Volumes.
NVDA Daily Chart – Rising Wedge Alert!Just analyzed this NVDA setup. We’re seeing a clear rising wedge forming near the top of a strong run-up — typically a bearish reversal pattern. Price tagged $167.89 and pulled back slightly, closing at $164.92.
If this breaks down, watch the $148.67 - 151.31 area, and below that $125 as a key level. Bulls want to see a strong hold and breakout above $168 to invalidate the wedge.
#NVDA #NVIDIA

#RGTI This pattern is still consolidating within the handle, and a breakout above the resistance could signal the beginning of a new bullish wave.

Short-term Bear Case for CRCLHello Traders!
As part of my weekly equity trade analysis, I will be uploading my recordings of what I am seeing and intending to trade for the week. A quick summary of what's in the video is as follows:
- CRCL is a high beta stock that seems to not be moving in tandem with its peers as of late
- I am expecting volatility due to market data and monthly options expiration
- CRCL has formed a new bearish order block below another bearish order block and is wedged with a weekly bearish setup. We are anticipating expansion out of this range to the downside
- I am waiting for a re-test of $199-$205 for a full move to $155-$145
Cheers,
DTD

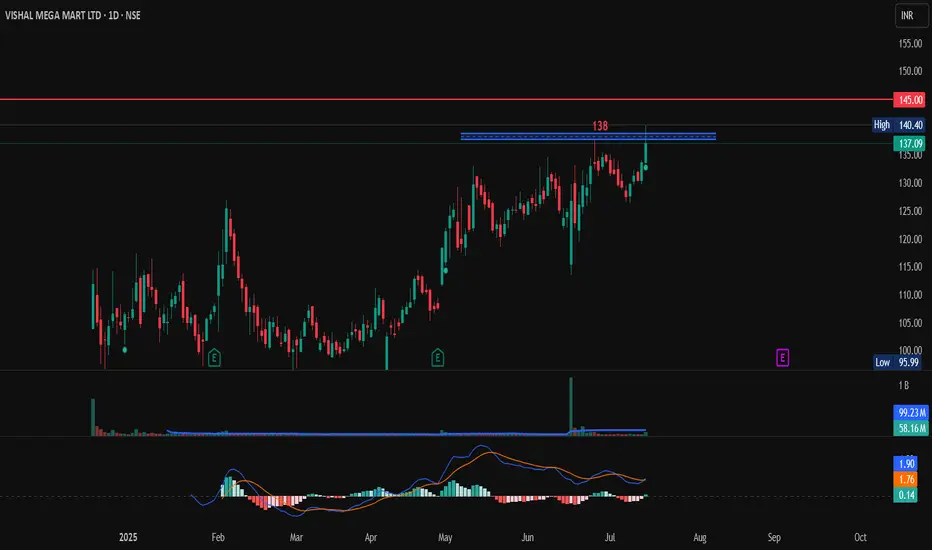
Vishal Mega Mart Long TradeVishal Mega Mart has broken it all time high of 137, but it was unable to sustain it close just below it. If is breaks the 138 mark it can easily to till 145 in next 10 sessions (2 weeks).
Enter above 138 on bullish candle pattern.
Target 145
SL 135
Btcm long position Btcm 5day 1week stocks and Rsi in favor
1hr time frame shows a flag and hidden bullish divergence in my humble opinion 🎇

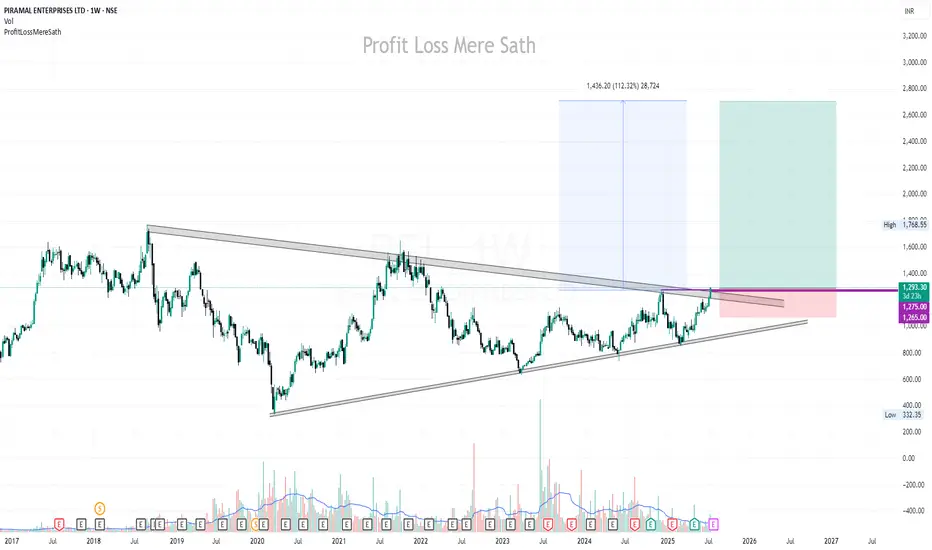
PEL | Buy @LTP | SL below 1070 | Targets 1560, 1765, 2700Disclaimer:
This is not financial advice. Please do your own research or consult with a financial advisor before making any investment decisions. Investments in stocks can be risky and may result in loss of capital.
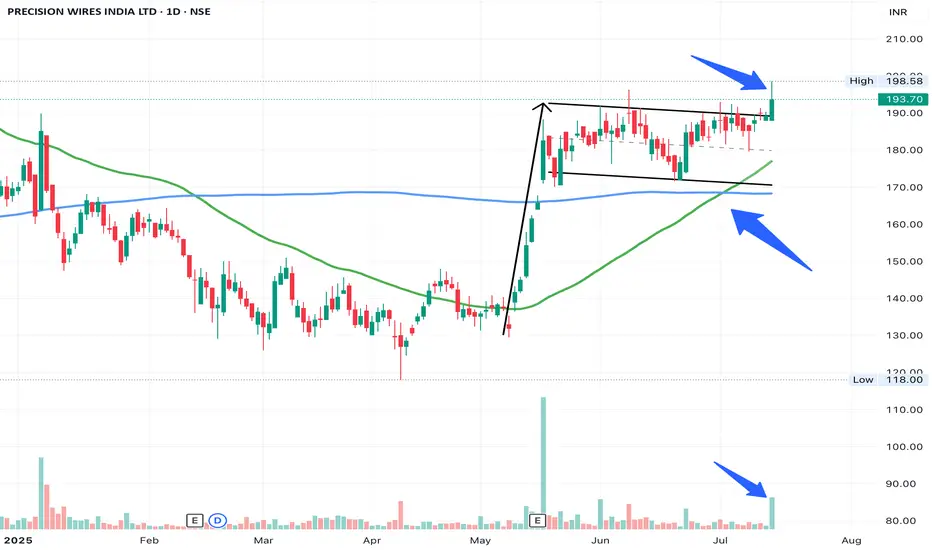
PRECWIRE - Flag and Pole BreakoutFlag and Pole Breakout (needs to sustain till EOD to confirm)
Great Relative Strength and Good volumes.
SL - 170 (partial exit can be done at 180)
Quick View : $ASTSThe daily sees a test of the average EMA21 while the hourly tf already shows up a bullish crossover .
Looking for a new high above that level

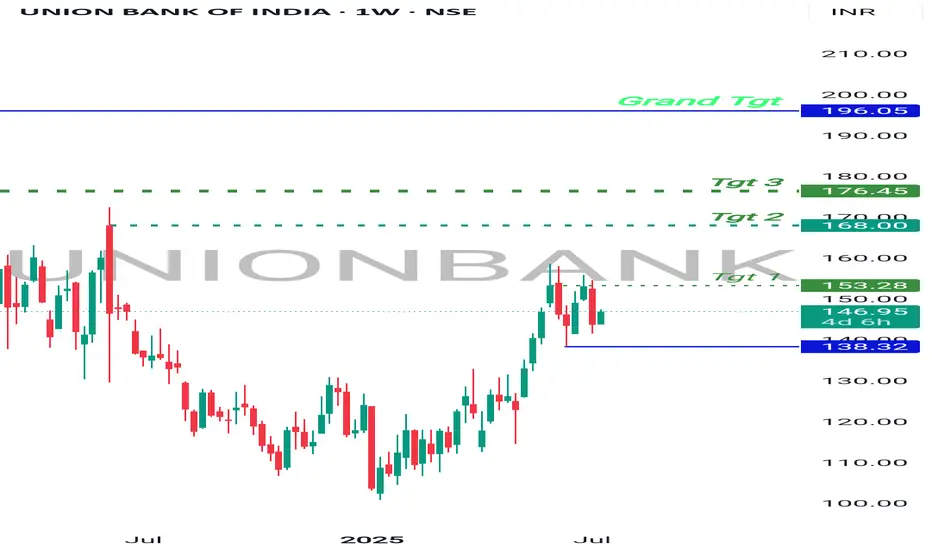
Bullish Bet , UnionBankBanknifty at support.
UnionBank on recent high making sideways moves, which means consolidation.
Once Banknifty Bounce back, UnionBank will break the resistance on weekly and monthly Basis and will start moving higher.
It has higher targets on a short and long term investment.
Good to hold for short term.

TSLA - Explosive Bounce TSLA Before the Drop? | EW Analysis My primary view is that we’re in the final stages of an ending diagonal, which could lift the price to new all-time highs, potentially between $460 and $650. Wave 4 of this structure appears to have completed after precisely tagging key Fibonacci support, and since then, we've already seen a strong bounce from that low. I’m now watching for the development of the final wave in this pattern, which could deliver gains of over 100% from current levels.
However, I’m not fully convinced by the internal shape of the diagonal so far. That’s why I’m also have an alternative scenario: in this case, the recent low may have marked the end of Wave 2 within a much larger diagonal. If true, this opens the door to a much more extended rally potentially reaching $1,000 before we see a major correction.
That said, this second scenario is not my preferred one, and a decisive break below the recent lows would invalidate both counts.

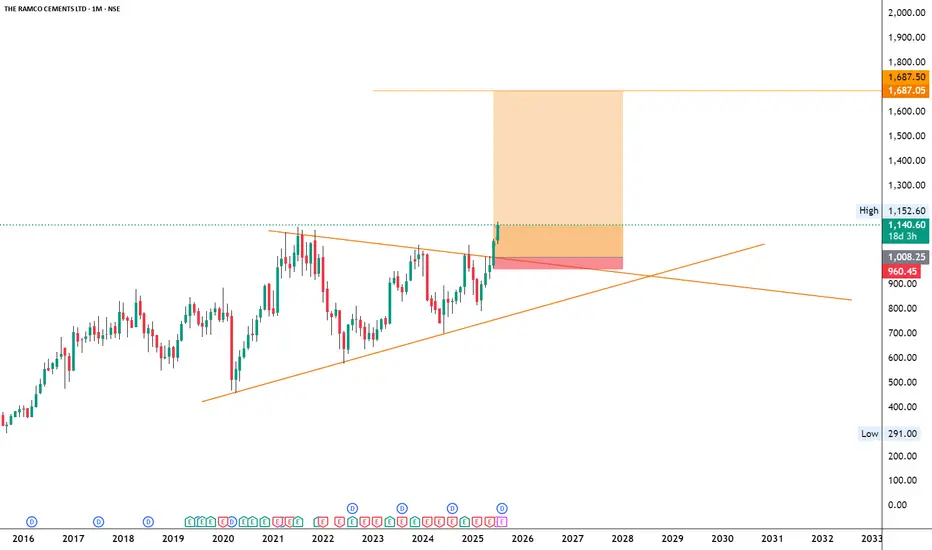
RAMCOCEM
NSE:RAMCOCEM
Note :
1. One should go long with a Stop Loss, below the Trendline or the Previous Swing Low.
2. Risk :Reward ratio should be minimum 1:2.
3. Plan your trade as per the Money Mangement and Risk Appetite.
Disclamier :
>You are responsible for your profits and loss.
>The idea shared here is purely for Educational purpose.
>Follow back, for more ideas and their notifications on your email.
>Support and Like incase the idea works for you.
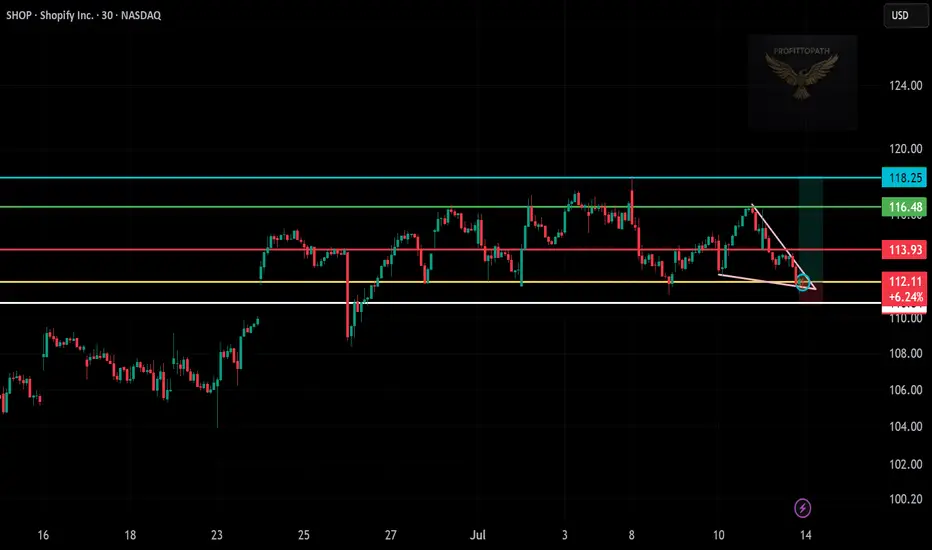
Trade Setup: Long on SHOP!📊
🕒 Timeframe:
30-minute chart
📍 Technical Overview:
Falling wedge breakout detected ✅
Support zone: $111.50–$112 (held well)
Breakout confirmation near $113
Target zones:
TP1 🎯: $116.48 (green resistance)
TP2 🎯: $118.25 (major resistance)
🔐 Risk Management:
Stop loss: Below $111.50 (white support)
Risk–Reward Ratio: Over 2:1 ✅
📈 Trade Plan Summary:
Entry: $113.00–$113.50 (breakout zone)
Target: $116.48 → $118.25
Stop loss: Below $111.50
L&T Finance – Cup & Handle Breakout After 8 Years!L&T Finance has finally broken out of a classic Cup and Handle pattern, reclaiming its 2017 all-time high after nearly 8 years of consolidation. Strong volume confirmation adds weight to this long-term bullish breakout. A must-watch for positional traders and investors looking for momentum in the NBFC space!

Very DangerousCarvana back near all time highs while in an expanding triangle formation. These happen at times where volatility is increasing and swings have become more wild. It can be a sign a lower liquidity causing small dollar amounts to change the stock's price more drastically.
A daily close under $330 is a giant sell signal for me. Advising extreme caution for those long this stock. I believe there are plenty of better investments out there with far less risk.

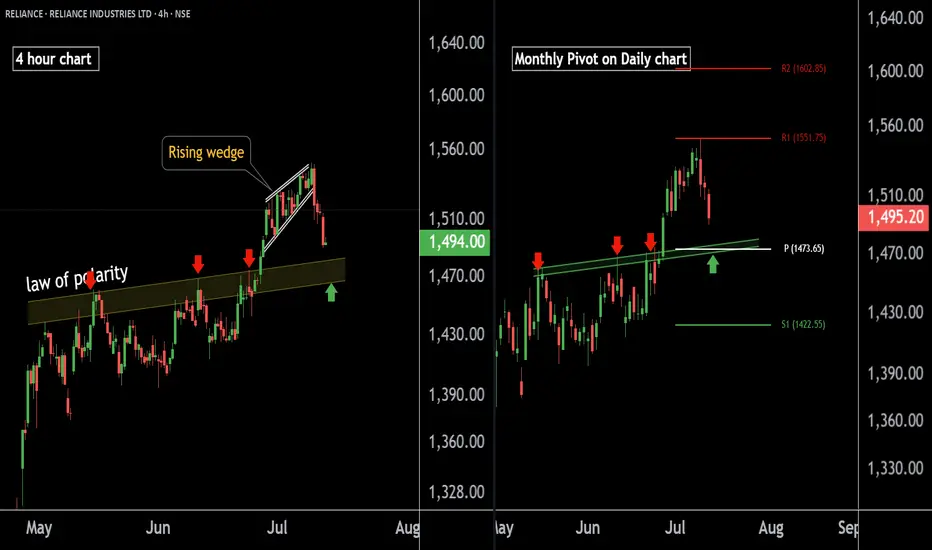
RELIANCE INDUSTRIES at Best Support !! Keep It On Your Radar !!There are two chart of RELIANCE INDUSTRIES on Daily and 4 hour Timeframe.
On the 4-hour timeframe, Reliance is likely to respect its LOP (Line of Polarity) as support, with the support range near 1460-1475.
On the Daily timeframe, the monthly pivot is also positioned around 1473, reinforcing this level as a potential halt or reversal zone.
If this level is sustain we may see higher prices in RELIANCE INDUSTRIES.
Thank You !!!