AMPX fully charged and ready to run again?I missed my 3.45 entry and will be watching for a pullback (black check mark) to 4.25-4.7 area to add some stock. Nice Inverted H&S potential big mover.

VBL Short_Rejection @ 20 DEMAVBL Short:
- Price Rejection @ 20 DEMA
- Enter Short when price is favorable in lower timeframe
- SL: Close above 20 DEMA

Tesla on the Edge – Key Support or Deeper Drop?📉 Tesla on the Edge – Key Support or Deeper Drop? 🔥🔍
Tesla is in freefall, dropping nearly 9% today. The stock has plummeted from its highs near $500, now testing the critical $220-$200 support zone.
📊 Key Levels to Watch:
📌 Holding $220 could trigger a relief bounce towards $275+.
📌 A breakdown below $200 could open doors to $160-$180, or worse.
🔎 What’s Happening?
Tesla, along with X and SpaceX, is under intense scrutiny amid political pressure, regulatory battles, and even cyberattacks. This aligns with the broader market uncertainty, as Bitcoin struggles to reclaim $79,478.
👀 Elon Musk is in the spotlight, facing global resistance, from social media wars to business challenges. Could this spell opportunity or more downside for Tesla?
⚡️ Will TSLA rebound, or is it heading even lower? Let me know your thoughts below!
One Love,
The FXPROFESSOR 💙
#Tesla #TSLA #ElonMusk #StockMarket #Trading #TechStocks

$1 to $2.70 Swing Pick +150% gain so far in a weekHere is updated chart from what I shared with you past week on NASDAQ:VOR
Awesome runner!

$HIMS | Cup & Handle Setup FormingA classic cup & handle setup is building on the 4H chart.
Price just broke out of a falling channel (handle), and is now testing a key breakout zone between $48–$53. A daily close above $54–$55 with volume would confirm continuation.
I’ve mapped out three potential price targets ($73.88, $99.17, $145.34) based on the depth of the cup and Fibonacci extensions.
Watching:
RSI trending higher
Bullish trend intact via 8/21 EMA
Sub-$40 = pattern invalidation
Breakout + volume = go time. Watching closely this week.

Safe Entry Zone NIOGreen Zone Is Safe Entry and Retest before exploding higher.
Note: 1- Potentional of Strong Buying Zone:
We have two scenarios must happen at The Mentioned Zone:
Scenarios One: strong buying volume with reversal Candle.
Scenarios Two: Fake Break-Out of The Buying Zone.
Both indicate buyers stepping in strongly. NEVER Join in unless one showed up.
2- How to Buy Stock:
On 15M TF when Marubozu Candle show up which indicate strong buyers stepping-in.
Buy on 0.5 Fibo Level of the Marubozu Candle, because price will always and always re-test the imbalance.

VEDL Long_Support @ 20 DEMAVEDL Long:
- Price support @ 20 DEMA
- Enter when prices are favorable
-SL: Close below 20 DEMA

DLF Long_Support @ 20 DEMADLF Long:
- Price support @ 20 DEMA
- Bullish Engulfing candle.
- Enter long when the price is favorable in the lower timeframe
- SL: Close below 20 DEMA

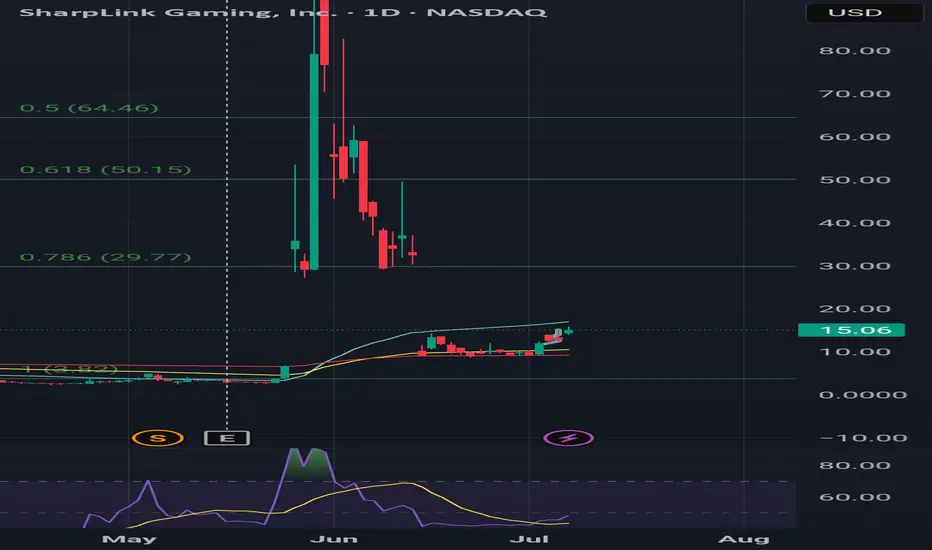
$30 easy by 2026I'm holding the 1/16/26 25C those are the highest and furthest out options you can get on hood. Bought at 1.55 on 7/2 now worth 3.30 good entries if eth pulls back would be 12 and 10 best case. I see this running quick I will sell atleast half at 30. They hold and are staking over 500M worth of eth largest amount for any publicly traded company, yeild will be great for them but they are obviously selling shares to purchase eth so there's plenty of risk company only has 5 employees according to hood still under 1B last time I checked. 50ma is around 16 should be a clear path to 30 maybe psychological resistance at 20.
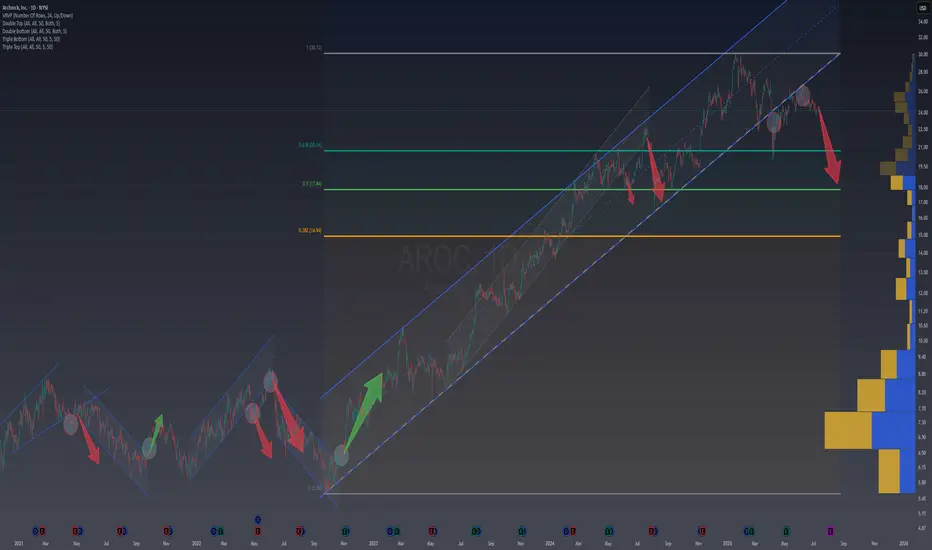
Home of channelsArchrock has been the house of channels for the last 4 years. Each time the price moved in a channel, we had great opportunities to make money.
Imagine the price as a car driving up a road between two lines. For a while, it moved smoothly inside this channel. Every time it touched the bottom line, it bounced up, near the top, it slowed down.
Patterns Worked Well:
Whenever the price broke out of these patterns, it moved strongly in the expected direction. These signals have been reliable on this chart. We also have examples of pullbacks to the channel, which are amazing risk reward trades.
The Big Change:
Recently, the price “fell off the road” by breaking below the channel. This is a clear sign that the upward trend is over for now, and the price is dropping.
What’s Next:
The price is heading toward areas where, in the past, buyers have stepped in (called support). These are often at special levels (like Fibonacci) or where lots of trading happened before (look at volume lines in the right side, the bigger the better to act as support.
Watch for when the price breaks out of its usual path, these moments often signal big changes. Even if you’re new to charts, spotting these “road breaks” can help you understand what might come next.
Furthermore, Archrock appears overvalued with a high P/E ratio, and price forecasts for 2025 suggest potential declines of up to 30% . This increases the risk of a sideways or bearish trend in the coming months.
$CRM Salesforce Trade IdeaStrong support at $260-265 with improving margins (net profit 15-17%). PE ratio down to 41 from 100+ in 2023. 16 analyst BUYs vs 3 SELLs.
Entry: $274-275 Target: $300-305 Stop: $258
Risk/reward ~1:2. Demand zone holding, volume confirms. #StockMarket #Trading

HDFC AMC Long_ Support @ 20 DEMAHDFC AMC Long:
-Price takes support @ 20 DEMA
- Good Volume
- Enter long when the price is favorable in the lower time frame
- SL: Close below 20 DEMA

(Daytrading) APPL going upH1 chart is respecting the uptrend.
Price has retested the 50 SMA on the H1 timeframe.
Price also touched the Ichimoku Cloud on H1.
→ Based on the risk-to-reward ratio, I’m expecting a Call position.

TSLA (daytrading) break out and retest1. Still watching here (down trend is too strong)
We can see break out patterm
2. And came back to restest. But i worry about that tsla usually doesnt restest like that.
3. Hit sma 200 h1

(Daytring) APPL quickly trade1. Premarket created a support line
2. Sma 200,50 is here
3. Price goes up in the moring just pull back to retest.
=> entry. Take profit whenever i feel good

Breaking out!The price breaks through the purple resistance and is preparing to start an upward movement.
A compression triangle formation is taking shape, with the lows resting on the underlying purple trendline.
At $203.3, the weekly 100-period simple moving average (SMA100, green line) is located. A close above this level would be an important confirmation of the bullish reversal.

$ZM Long Setup (Probabilistic Bias: Bullish)Chart: 1H | Framework: Smart Money Concepts + Fibonacci + ORB | Date: July 8, 2025
🧠 Technical Insight:
Zoom ( NASDAQ:ZM ) has reclaimed its Equilibrium Zone (around $78) after sweeping liquidity into the Discount Area and tapping a bullish Order Block near $76. A clear CHoCH (Change of Character) signals a potential structural reversal.
🔍 Key Levels:
Support Zone (Discount Area): $75.80–76.50
Equilibrium/POI Zone: $78.00
Target 1 (Fibonacci 0.786): $80.65
Target 2 (Fair Value Gap / 0.886): $82.71
Target 3 (Strong High / Supply): $84.00–85.00
Invalidation: Below $75.30
📊 Volume Spike on July 5-8 confirms active participation near lows—suggesting possible accumulation.
🌐 Macro Context:
Recent Fed comments hint at rate pause or mild easing, boosting tech sentiment.
AI adoption remains a long-term catalyst for enterprise SaaS solutions—beneficial to Zoom’s growth narrative.
Nasdaq leadership rotation may favor ZM’s mean reversion after underperformance.
🔥 Catalyst Watch:
Earnings expected late July—option flow may front-run results.
Monitor implied volatility and ORB breakout ranges (15-min 0930–0945) for intraday confirmation.
📌 Summary (VolanX Signal Score):
Trend Reversal Probability: 67%
Risk-to-Reward: 2.8R
Bias: LONG
Conviction: Moderate to High
📉 Not Financial Advice — For Research Purposes Only
#ZM #SmartMoneyConcepts #WaverVanir #VolanX #OrderBlocks #Equilibrium #TechStocks #Fibonacci #Liquidity #OptionsFlow #MacroUpdate #TradingView #EarningsPlay #ORBStrategy #CHoCH

PLTR temporary top?Bearish case
Monthly RSI at 91
Weekly candles encountering resistance
Daily candles under the 20 day SMA
Bullish case
Monthly candle not a clear bearish candle, no monthly volume spike or no monthly RSI double top like SMCI and no bearish divergence detected yet.
Weekly no continuation down after first 2 red weekly candles
Daily volume spike suggest temp bottom
Conclusion
Let's see the next weekly candle from July 7 to 11.


NVDA Analysis To 164?Quick breakdown of NVDA
Appears we hit our corrected level, we could go deeper possibly or hold at this level and drive up to 164
This is looking like a nice little setup long indeed
Trade Smarter Live Better
Kris/Mindbloome Exchange

CSCO Long CallsCisco's uptrend exceeded previous highs and heading toward 127% extension from the 4/9 Tariff lows.
Prices are currently consolidating between $68 and $70 with a volume level.
I am buying in the lower 1/2 - 1/4 of the range with an expectation of a move back to the $70 level and beyond.
August 15 67.5 Calls
E - $68.50
T1 - 69.80
S.L. 30% of option Price

DDOG - Recent entry to S&P500, looking for entry point on $150+I've started looking into #DDOG with its recent addition into the S&P500. The current chart setup looks like a cup and handle. It will be re-testing the 150 and 160 level. If it can break out beyond $155, it has momentum to climb higher with more institutional investors coming in. Note it has been above this level before in 2021 and it was close before in Q4 2024. It has got steady growth in their financials each quarter.

AAPL can we hit 260?
Appears we are making a correction down to the levels of 208 then if that does not hold 205 with a possible drive up to the 260.
Question is are we going drive deeper with the correction ?
Be Careful folks this is a wild one
Trade Smarter Live Better
Kris/Mindbloome Exchange
