PEP is in the Wyckoff Accumulation phaseThis Week (July 8 - 12):
Support: The recent consolidation shelf around $130.00 is the first line of defense. The absolute low and our line in the sand is the Selling Climax low at $127.60.
Resistance: The 20-week moving average at $138.30 is the immediate ceiling it needs to break through.
Next Month (July/August):
Support: The $127.60 low remains the critical long-term support.
Resistance: If it can clear the $140 level, the next major area of resistance to watch is around $150.00, a previous support zone that will likely attract sellers.

(NFLX) Brake out I would like to see (NFLX) brake this consolidation pattern. Once it does we should see a hard push past the resistance. It both of these happen I will be getting in on the pull back.

Tesla's Self-Inflicted Crisis of ConfidenceInvestors wanted Elon Musk to double down on EVs. Instead, they got a new political party and another reason to sell the stock.
Musk vs Trump: A Fight Investors Didn’t Ask For
Tesla’s latest sell-off has little to do with earnings or electric vehicles. Shares dropped 6.8% on Monday after Elon Musk announced plans to launch a new US political party, escalating his feud with Donald Trump and reigniting investor concerns about distraction at the top.
The fallout from Musk’s political re-entry has been swift. Tesla’s valuation has lost over $200 billion since late May, when Musk’s role in Trump’s short-lived government efficiency task force came to an end. His renewed focus on political activism contradicts April’s pledge to spend “far more” time on Tesla, and comes at a moment when the business is already under pressure from slowing EV sales and collapsing regulatory tailwinds.
Politics, Profits and a Shrinking Mandate
Trump’s so-called “big, beautiful bill” is slashing support for electric vehicles across the board. Gone is the $7,500 federal tax credit, set to expire in September. Gone too are the emissions penalties that allowed Tesla to bank billions in regulatory credits from legacy automakers. William Blair analysts estimate that over $2 billion in high-margin profit is now at risk.
The political clash is getting personal. Trump has mocked Musk’s behaviour as a “train wreck”, suggested deportation, and floated nationalising SpaceX. Investors, meanwhile, are left questioning whether Musk’s growing list of battles is starting to erode Tesla’s long-term advantage. The distraction risk is real, and the market is responding.
Technical Breakdown: Key Levels in Play
Tesla’s share price has woefully underperformed this year. The stock is down 22% year-to-date, while the S&P 500 is up 6%. Recent price action highlights just how vulnerable Tesla has become to the political whims of its CEO. The public fallout with Trump helped define a new swing high in May, which now acts as clear resistance. A new swing low was formed in early June, and that is now the short-term level bulls need to defend.
Adding Keltner Channels to the chart puts the recent volatility into perspective. The sideways bands and price bouncing between them show a market stuck in broad equilibrium. There’s little directional conviction, but that may be changing. Monday’s sell-off pushed Tesla below the volume-weighted average price anchored to the April lows. If the shares remain below this VWAP and break under the June swing lows, it would confirm the attempted recovery has failed and signal that the bears are back in control.
For now, Tesla isn’t trading like a high-growth innovator. It’s trading like a politically charged meme stock with no clear trend and no adult supervision.
Tesla (TSLA) Daily Candle Chart
Past performance is not a reliable indicator of future results
Disclaimer: This is for information and learning purposes only. The information provided does not constitute investment advice nor take into account the individual financial circumstances or objectives of any investor. Any information that may be provided relating to past performance is not a reliable indicator of future results or performance. Social media channels are not relevant for UK residents.
Spread bets and CFDs are complex instruments and come with a high risk of losing money rapidly due to leverage. 85.24% of retail investor accounts lose money when trading spread bets and CFDs with this provider. You should consider whether you understand how spread bets and CFDs work and whether you can afford to take the high risk of losing your money.

DOW is in the Wyckoff accumulation phaseThis Week (July 8 - 11):
Support: The recent low at $27.10 is the immediate floor. The ultimate support is the Selling Climax low at $25.10.
Resistance: The 20-day moving average (green line) around $28.50 is the first hurdle. Above that, look for a test of $30.00.
Next Month (July):
Support: The $25.10 low absolutely must hold.
Resistance: The primary target is the top of the trading range, established by the Automatic Rally, at $33.00.

Costco is in the Wyckoff distribution phaseThis Week (July 8 - 11):
Support: The immediate floor is at $965. Below that, the low from the initial sell-off around $955 is critical.
Resistance: The 20-day moving average (that green line) at ~$992 is the first ceiling. If it gets frisky, look for sellers to appear at $1,030.
Next Month (July):
Support: If $955 breaks, this whole structure fails. The next major stop would be the April lows around $872. That's the edge of the cliff.
Resistance: The all-time high of $1,067 is the ultimate party zone that the bouncers (sellers) are not letting anyone back into right now.

HER Short (clear head and shoulder)A clear head and shoulder pattern has been drawn on HER.
Going into shorting territory.
How far do you think it might fall?

Apple May Dip to $203 FVG Before Resuming UptrendFenzoFx—AAPL (Apple) is bullish, testing the $210.0 resistance while Stochastic warns of an overbought market.
A dip to the bullish FVG at $203.0 is likely before the uptrend resumes.

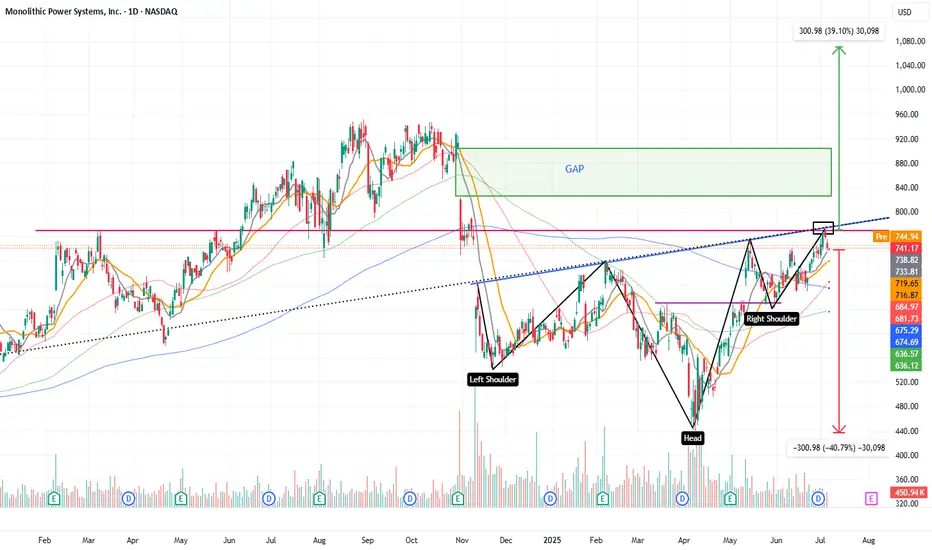
Inverse head and shoulders with a gap to close towards 1070$The price is completing the formation of an inverse head and shoulders pattern, with a head-to-neckline distance of approximately $300.
This suggests a potential breakout target around $1070.
Along the way, there is also a significant gap that has remained unfilled for several months.
The stock belongs to a company that manufactures power management chips used in all types of electronic devices, with steadily growing revenue
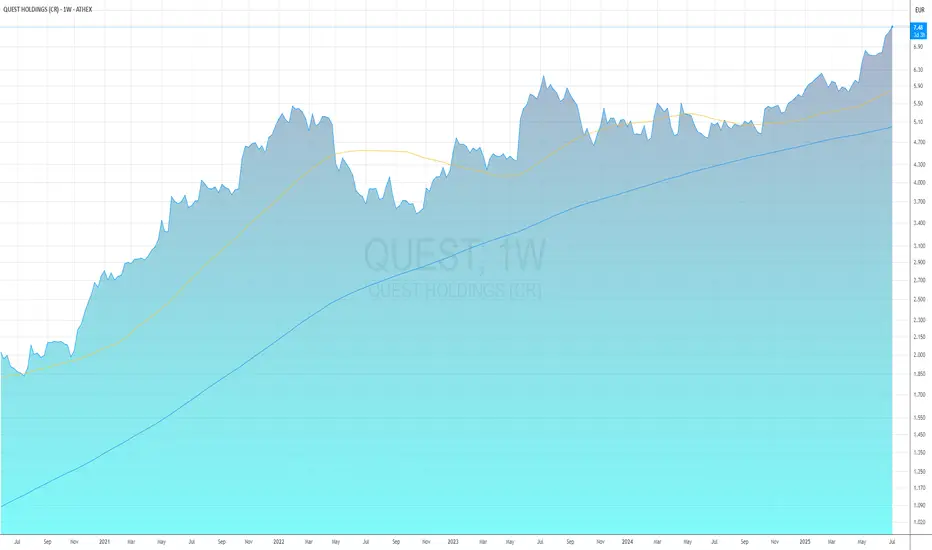
Quest Holdings: A Strategic Pivot and the Prospect of ShareholdQuest Holdings: A Strategic Pivot and the Prospect of Shareholder Returns
**ATHENS, GREECE** – Quest Holdings (ATH:QUEST) has been a standout performer on the Athens Stock Exchange, with its share price demonstrating a significant upward trend over the past year. This rally is underpinned by the company's solid financial performance across its diverse segments and, more recently, by a strategic move that has unlocked substantial value: the sale of a stake in its successful courier subsidiary, ACS. Now, investors are keenly anticipating what the company will do with its bolstered cash position, with many eyeing a potential, significant capital return.
Strong Performance and Strategic Growth*
Quest Holdings has consistently delivered robust results, showcasing growth across its primary business pillars: IT services (Uni Systems), commercial activities (Info Quest Technologies, iSquare), and green energy. The group's ability to expand its IT services internationally and capitalize on the strong demand for digital transformation projects has been a key driver of its profitability. For 2025, the company projects continued revenue growth and an even higher growth rate for its operating profitability (EBITDA), which is expected to surpass €100 million.
This solid operational performance has provided a strong foundation for the stock's appreciation, which has seen its price rise by over 40% in the last 12 months, hitting new 52-week highs in early July 2025.
The Game-Changing ACS Deal
The most significant catalyst for Quest's recent momentum was the strategic agreement announced in late 2024 for its courier services arm, ACS. Quest Holdings agreed to sell a 20% stake in ACS to General Logistics Systems (GLS), a major European parcel and express service provider and a long-term partner of ACS.
Key details of the transaction:
* **Sale Price:** The 20% stake was sold for a consideration of approximately €74-€77 million.
* **Call Option:** Crucially, the deal includes a call option for GLS to acquire the remaining 80% of ACS shares. This option can be exercised on either October 31, 2025, or October 30, 2026.
* **Valuation:** The agreement implies a minimum valuation of €370 million for 100% of ACS, a figure that crystallizes the significant value Quest has built in the courier business over 25 years.
This deal was a strategic masterstroke. It not only brought a substantial cash injection into Quest Holdings but also secured a powerful strategic partner for ACS, ensuring its continued dominance and growth in the Greek market with planned investments in sorting centers, electric vehicles, and digital transformation.
Anticipation of a Capital Return
The successful sale of the ACS stake has significantly strengthened Quest's already healthy balance sheet. At the end of 2024, the group boasted a net cash position of €82 million, fortified by the proceeds from the deal. This has given the management ample firepower for new investments, such as the recent acquisition of a majority stake in the home appliance company Benrubi.
However, the key question on every investor's mind is shareholder remuneration. With such a strong cash position and the prospect of an even larger windfall if GLS exercises its option to buy the remaining 80% of ACS, the market widely anticipates a generous capital return.
Analysts covering the stock have already begun to factor this into their models. Some reports suggest the possibility of a **special dividend** distributed from the proceeds of the initial 20% sale, on top of the company's regular dividend payout. Quest has a track record of rewarding its shareholders, and the current financial strength provides a solid basis for such a move.
Outlook: A Value Proposition
Even after its recent rally, many analysts believe Quest Holdings remains attractively valued. When stripping out the implied €370 million valuation of ACS from the group's total enterprise value, the remaining core businesses—particularly the high-growth IT services and the margin-accretive commercial activities—appear to be trading at a compelling discount compared to their peers.
The combination of:
* Consistent growth in core operations.
* A strategic, value-unlocking deal with ACS.
* A robust balance sheet with a strong net cash position.
* The high probability of a significant capital return to shareholders.
...presents a powerful investment case. As the October 2025 deadline for the first GLS call option approaches, all eyes will be on Quest Holdings, not just for its operational performance, but for its next move in rewarding the shareholders who have supported its successful journey.
BIDU 1D: triangle breakoutBIDU 1D: triangle breakout + real-world AI deployment boosts bulls
Baidu (BIDU) breaks out of a triangle within a falling channel on the daily chart, with solid volume, reclaim of the 50MA, and approach to the 200MA. $90.09 flips into support. Targets stretch to $105.47 / $113.68 / $124.06 (Fibo levels).
Fundamentally, Car Inc just launched a robo-car rental service powered by Baidu’s Apollo unit. Fully autonomous, bookable for 4 hours to 7 days — this is not future tech, it’s live now. With a $32.6B market cap and low P/E (~12), BIDU looks positioned for revaluation if sentiment shifts.
Tactical setup: entry by market or retest of $90, stop below $82.
When the robot drives customers - you just drive the trade.

Wedge Watch: SPACE42 Poised for Liftoff from Falling Orbit?
➤ 📈 RECOMMENDATION: BUY (Speculative)
➤ 🔍 REASONING:
📉 Chart Pattern: This is a falling wedge — a classic bullish pattern often seen at the end of a downtrend.
🚀 Bullish Signal: A breakout above the upper wedge line 📈 typically signals the start of an **uptrend**.
📊 Volume: Look for increasing volume** on the breakout 🔊 — this confirms momentum.
📐 Trend Structure: The narrowing price range with higher lows = buyers are stepping in gradually 💪.
🛠️ Action Strategy:
🟢 Entry: Buy on breakout above the upper trendline.
🛡️ Stop-loss: Just below the recent swing low inside the wedge.
🎯 Target: Take the height of the wedge and project it upward from the breakout level.

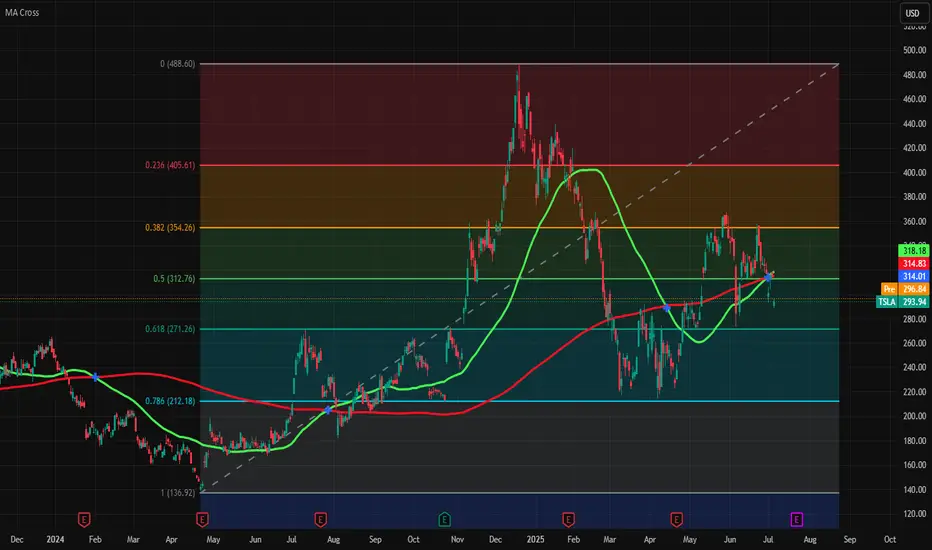
Tesla is on edge of Golden crossTesla is on edge of golden cross (50 and 200 days moving average crossover) and fresh entry is possible above green line of 50 days MA (318.18) and SL is 271 and TP is 354.
If it fall then wait for 271 level or again cross above green line.
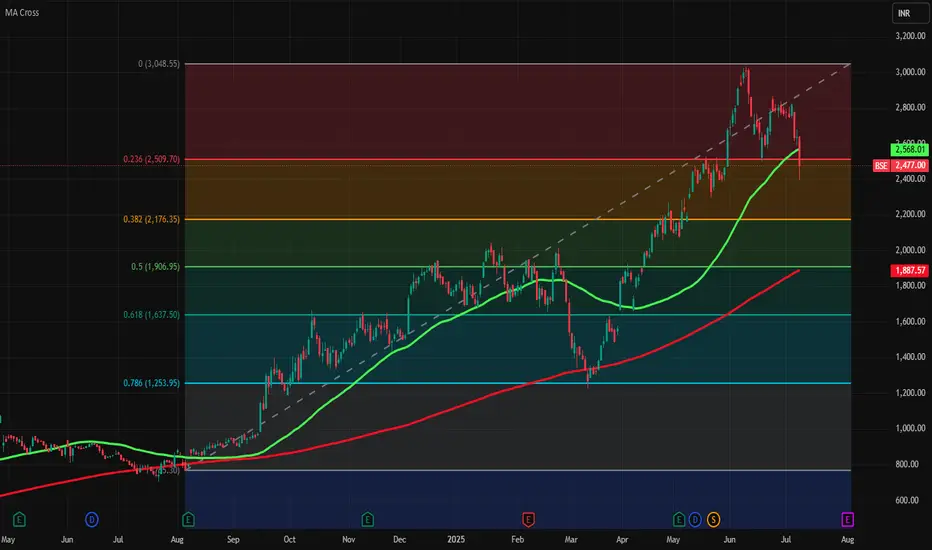
Fresh buying and selling entry in BSEAs we can watch it is falling 50 days moving average (green line) and fall from its support of 2509 and currently selling entry is possible in it till 2176.35 and if it more fall the next level of support is 1907.
Fresh buying is possible at near 2176.35 level and SL is 1907 and TPs are 2509 and 3048.
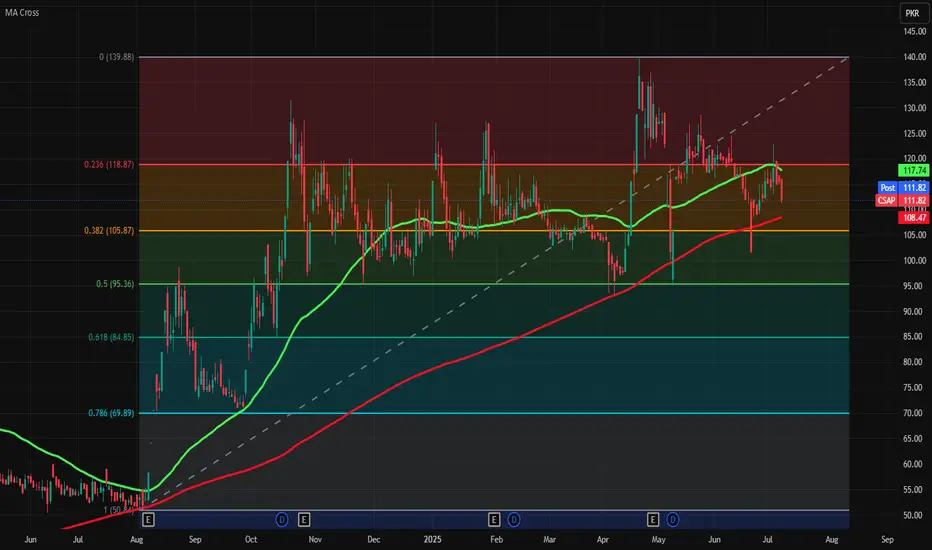
Fresh entry for CSAPAs you can watch it is now below 50 days moving average (green line) and it is also near to 200 days moving average (red line).
Buying conditions:
1) if it cross above green line (117.74)
2) If it fall below from red line (108.47) and cross above it
3) If it fall more red line then wait for its strong support of 105.87 and if it fall below it then wait for cross over above 105.87 level to take fresh entry.
SL is 84.8 and TPS are 118.87 and 139.88
Note: This is not a buy/sell trade call.
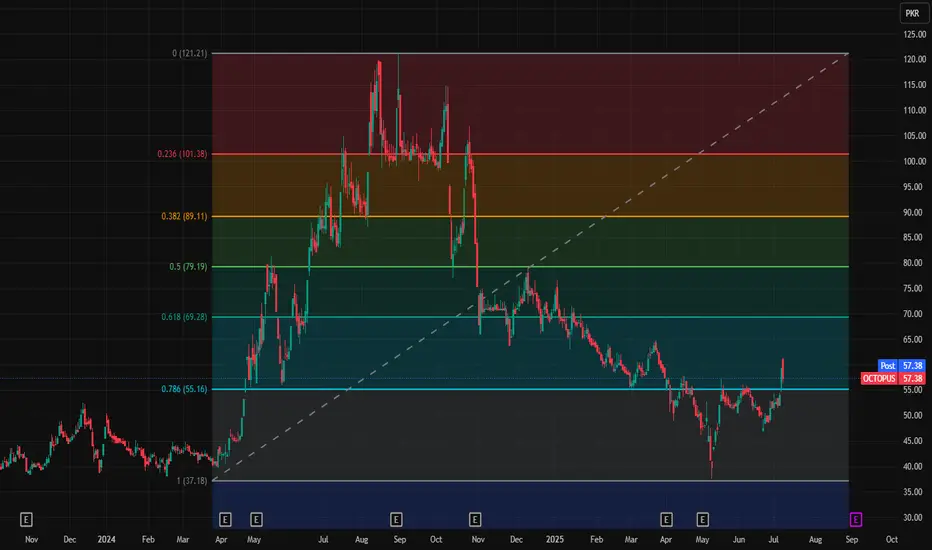
Fresh entry for OctopusOctoous is near to its support of 55.16 and if it fall below it and again cross above it then fresh entry is possible with SL of 37.18 and TPs are 69.28 and 79.19.
Note: This is not a buy/sell trade call.
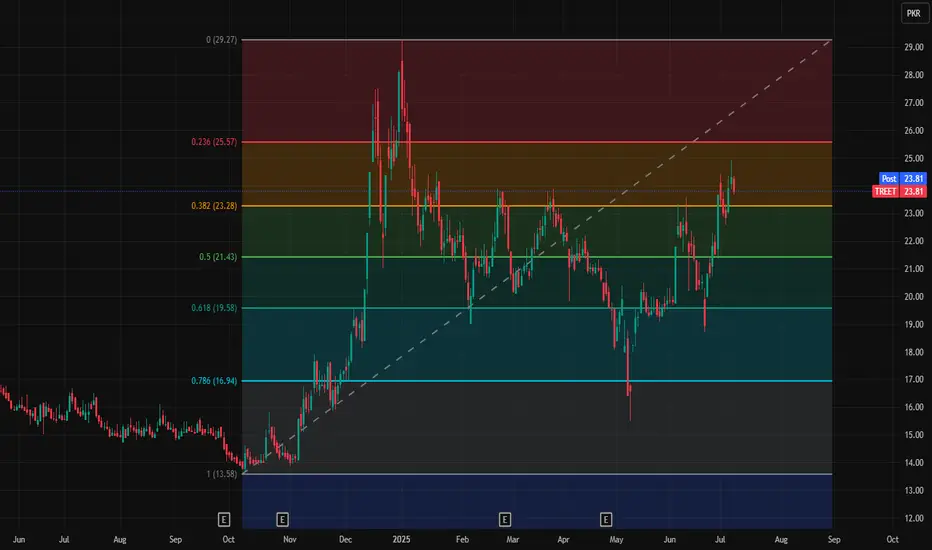
Fresh entry for TreetTreet is near its support level of 23.28 and fresh entry is possible at this level with SL 21.4 and TPs 25.57 and 29.27
Note: This is not a buy/sell trade call.