Titan at Best Support Zone !! This is the 4 hour chart of Titan Company.
Titan having a good support zone near 3400-3460 level.
If this level is sustain , then we may see higher prices in Titan company.
Thank You !!

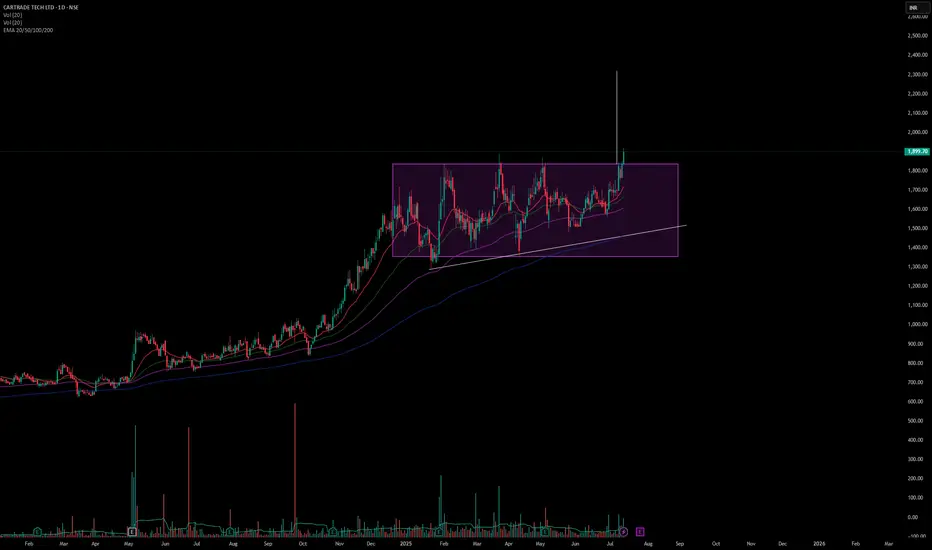
Long Cartrade Tech LTD . This stock has broken out of a rectangle pattern and trending at 1899.70. We can take a swing trade in this stock with an SL of 7.5% which will hit at 1750 and target of 22% which we will achieve at 2320. Our risk & reward ratio is 1:3.
LTTS Weekly Trade Setup(14th-18th July 2025) – Parallel ChannelThis week, L&T Technology Services (LTTS) is showing a potential breakout opportunity that requires patience and precision. As the stock approaches a key resistance zone near ₹4445, traders should resist the urge to jump in early and instead wait for a breakout and confirmed re-test before entering any long positions.
Let’s break this down.
1. Why the Breakout is Important
- LTTS has been consolidating within a parallel channel between ₹4280 (support) and ₹4445 (resistance). Breakouts from such structures often trigger significant moves — but only when confirmed.
- A false breakout can trap early traders. Hence, waiting for the price to break above ₹4445 and then re-test this level is critical.
2. The Strategy – Wait and React
📌 Step 1: Watch for Breakout
Monitor price action as it approaches and breaches the ₹4445 resistance.
Look for strong bullish candles with volume to validate the breakout.
📌 Step 2: Wait for Re-test
After breakout, price may pull back to test the previous resistance.
This re-test acts as a confirmation that bulls are defending the breakout.
📌 Step 3: Look for Confirmation
Enter only when you see a bullish candlestick pattern (like a bullish engulfing or hammer) near the re-test level on 15-min or 1-hour charts.
🛡️ Stop Loss:
Place your stop below the swing low of the re-test.
This protects you if the breakout fails.
🎯 Target:
Profit booking zone is near ₹4580–₹4600.
Risk/reward ratio: 1:2, 1:3, 1:4+
3. Why Re-test Entries are Powerful
They allow low-risk entries with a tight stop loss.
You avoid chasing price and reduce emotional trading.
Confirmation helps you filter out false breakouts.
4. Final Words
In trading, discipline often beats speed. This LTTS setup is all about timing and structure.
🔔 Watch for the breakout.
🧘♂️ Wait for the re-test.
🎯 Enter only with confirmation.
If executed properly, this trade offers a clean, high R:R opportunity with a clearly defined setup.

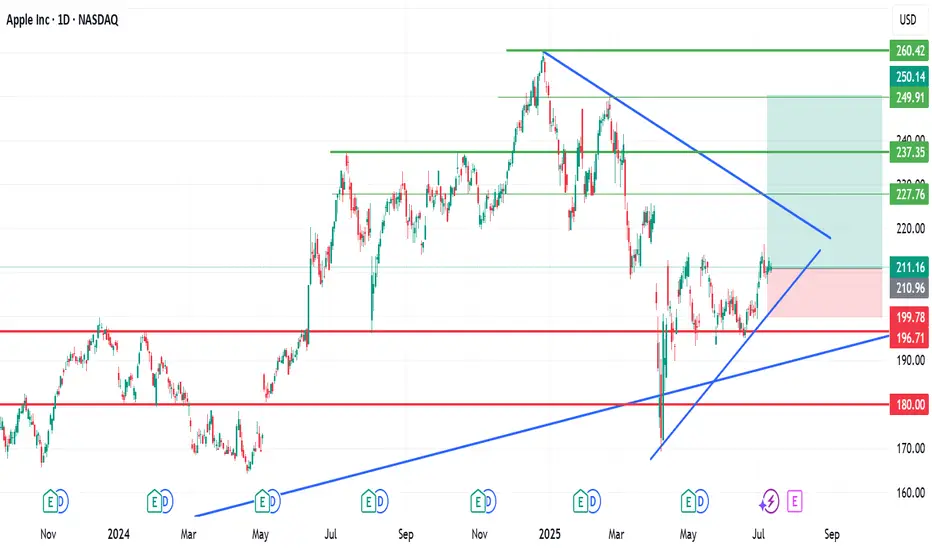
AAPL - Another Possible BreakoutsHello Everyone,
Apple AAPL is the another possible breakouts in my list.
Good entry point could be 205-206 , Re-test point.
228-230 is target price for me , which is approx %10 above from 205-206.
I tried to draw possible price action on Graphs.
Same as I mentioned in GOOG , Apple is Apple and you can get it in every price point for long term.
But short term you can watch the these price points that i mentioned to get some gain.
This is just my thinking and it is not invesment suggestion , please do not make any decision with my anaylsis.
Have a lovely Sunday and good start a Week

GOOG - Possible Break OutHello Everyone,
Happy Sunday to All.
I would like to make a quick Analyse on GOOG. When i was scanning the stocks,i reliazed that this could be a possible breakout and could be a opportunity to buy.
This looks like a breakout and i am expecting to Re-test trend line which price level 175 $.
Then first target is 190-192 which is approx %8 - 10 above from 175.
If it will restest and hit the 175 , this could be good entry point.
If not then first target is 190-192 which is approx %5 above current price level.
Long Term , of course Google is Google no doubt to jump in every price points :)
For me, short term i would wait 175 and put my order to that price , then wait for next moves.
This is just my thinking and it is not invesment suggestion , please do not make any decision with my anaylsis.
Have a lovely Sunday and good start a Week

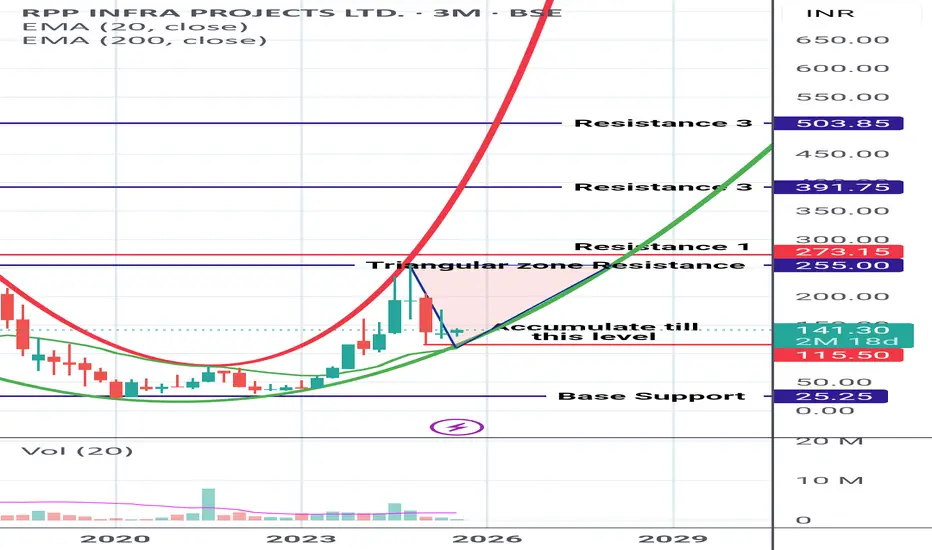
RPP INFRA (Early Birds PreyRPP INFRA
In Parabolic uptrend pattern.
Currently trading in Triangular zone. On closing above the triangular marked zone, Good rally can be expected
Shared it for Reference purpose based on chart pattern.
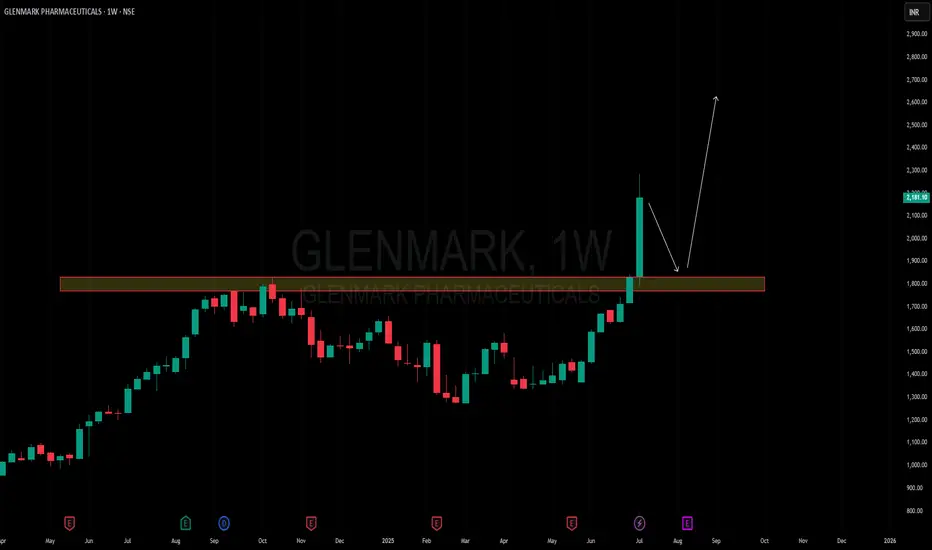
Amazing breakout on WEEKLY Timeframe - GLENMARKCheckout an amazing breakout happened in the stock in Weekly timeframe, macroscopically seen in Daily timeframe. Having a great favor that the stock might be bullish expecting a staggering returns of minimum 25% TGT. IMPORTANT BREAKOUT LEVELS ARE ALWAYS RESPECTED!
NOTE for learners: Place the breakout levels as per the chart shared and track it yourself to get amazed!!
#No complicated chart patterns
#No big big indicators
#No Excel sheet or number magics
TRADE IDEA: WAIT FOR THE STOCK TO BREAKOUT IN WEEKLY TIMEFRAME ABOVE THIS LEVEL.
Checkout an amazing breakout happened in the stock in Weekly timeframe.
Breakouts happening in longer timeframe is way more powerful than the breakouts seen in Daily timeframe. You can blindly invest once the weekly candle closes above the breakout line and stay invested forever. Also these stocks breakouts are lifelong predictions, it means technically these breakouts happen giving more returns in the longer runs. Hence, even when the scrip makes a loss of 10% / 20% / 30% / 50%, the stock will regain and turn around. Once they again enter the same breakout level, they will flyyyyyyyyyyyy like a ROCKET if held in the portfolio in the longer run.
Time makes money, GREEDY & EGO will not make money.
Also, magically these breakouts tend to prove that the companies turn around and fundamentally becoming strong. Also the magic happens when more diversification is done in various sectors under various scripts with equal money invested in each N500 scripts.
The real deal is when to purchase and where to purchase the stock. That is where Breakout study comes into play.
Check this stock which has made an all time low and high chances that it makes a "V" shaped recovery.
> Taking support at last years support or breakout level
> High chances that it reverses from this point.
> Volume dried up badly in last few months / days.
> Very high suspicion based analysis and not based on chart patterns / candle patterns deeply.
> VALUABLE STOCK AVAILABLE AT A DISCOUNTED PRICE
> OPPURTUNITY TO ACCUMULATE ADEQUATE QUANTITY
> MARKET AFTER A CORRECTION / PANIC FALL TO MAKE GOOD INVESTMENT
DISCLAIMER : This is just for educational purpose. This type of analysis is equivalent to catching a falling knife. If you are a warrior, you throw all the knives back else you will be sorrow if it hits SL. Make sure to do your analysis well. This type of analysis only suits high risks investor and whose is willing to throw all the knives above irrespective of any sectoral rotation. BE VERY CAUTIOUS AS IT IS EXTREME BOTTOM FISHING.
HOWEVER, THIS IS HOW MULTIBAGGERS ARE CAUGHT !
STOCK IS AT RIGHT PE / RIGHT EVALUATION / MORE ROAD TO GROW / CORRECTED IV / EXCELLENT BOOKS / USING MARKET CRASH AS AN OPPURTUNITY / EPS AT SKY.
LET'S PUMP IN SOME MONEY AND REVOLUTIONIZE THE NATION'S ECONOMY!
I am bullish on Apple (AAPL)I am bullish on Apple (AAPL)
Looking at my cahrt, you will seen my thoughts.
$237, $237 and $260 are my medium and long-term buy targets.
Trade with care as pullbacks are possible along the journey nortward.
Like, follow, share and comment
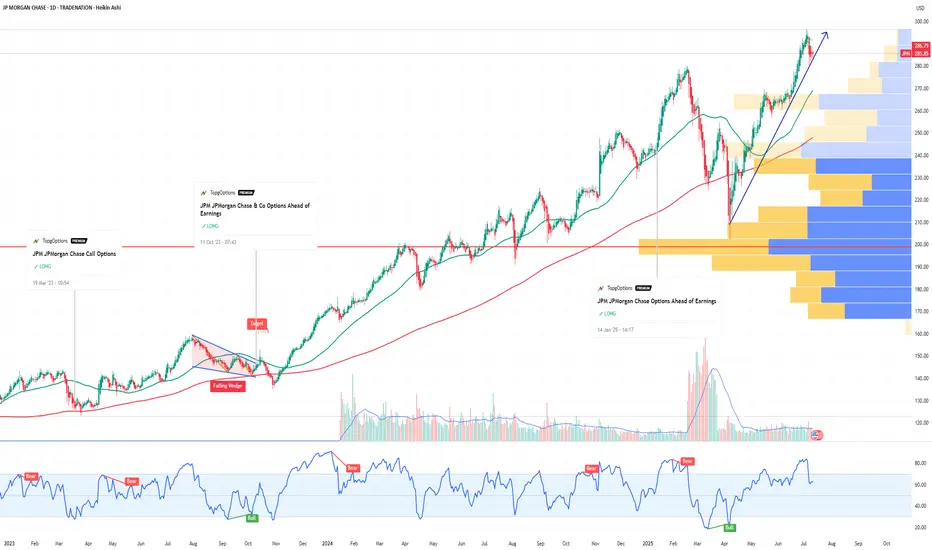
JPM JPMorgan Chase & Co Options Ahead of EarningsIf you haven`t bought JPM befor the rally:
Now analyzing the options chain and the chart patterns of JPM JPMorgan Chase & Co prior to the earnings report this week,
I would consider purchasing the 290usd strike price Calls with
an expiration date of 2026-1-16,
for a premium of approximately $20.20.
If these options prove to be profitable prior to the earnings release, I would sell at least half of them.
Disclosure: I am part of Trade Nation's Influencer program and receive a monthly fee for using their TradingView charts in my analysis.
Trade Idea: $HOOD – $106C by 7/25 | Bullish Setup🧠 Thesis:
After topping out at $100, NASDAQ:HOOD pulled back ~10%. I believe this recent pullback sets up a healthy base for a continuation move back toward $100+ in the coming sessions. If momentum kicks in, we could see a push toward the $106 level by expiration.
📊 Key Levels:
Resistance: $95.60 → $97.34 → $99.77 → $102 → $106
Support: $94.00 (uptrend line), $92.97 (higher low), $90.97 (must hold for bulls)
📌 Trade Strategy:
I'm scaling into the $106 Calls expiring 7/25.
Looking for:
A breakout above $97.34 to trigger upside momentum
Profit-taking zones around $99.77 and $102
Final target near $106 (ITM zone)
Risk is managed below $92.97.
🧭 Notes:
Watching broader market sentiment and NASDAQ:QQQ correlation closely. Volume confirmation will be key on any breakout attempts.

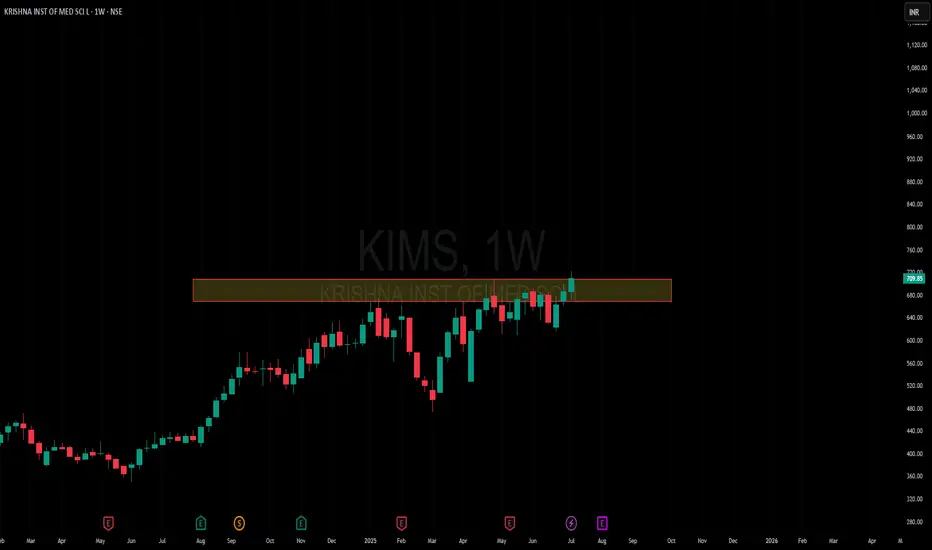
Amazing breakout on WEEKLY Timeframe - KIMSCheckout an amazing breakout happened in the stock in Weekly timeframe, macroscopically seen in Daily timeframe. Having a great favor that the stock might be bullish expecting a staggering returns of minimum 25% TGT. IMPORTANT BREAKOUT LEVELS ARE ALWAYS RESPECTED!
NOTE for learners: Place the breakout levels as per the chart shared and track it yourself to get amazed!!
#No complicated chart patterns
#No big big indicators
#No Excel sheet or number magics
TRADE IDEA: WAIT FOR THE STOCK TO BREAKOUT IN WEEKLY TIMEFRAME ABOVE THIS LEVEL.
Checkout an amazing breakout happened in the stock in Weekly timeframe.
Breakouts happening in longer timeframe is way more powerful than the breakouts seen in Daily timeframe. You can blindly invest once the weekly candle closes above the breakout line and stay invested forever. Also these stocks breakouts are lifelong predictions, it means technically these breakouts happen giving more returns in the longer runs. Hence, even when the scrip makes a loss of 10% / 20% / 30% / 50%, the stock will regain and turn around. Once they again enter the same breakout level, they will flyyyyyyyyyyyy like a ROCKET if held in the portfolio in the longer run.
Time makes money, GREEDY & EGO will not make money.
Also, magically these breakouts tend to prove that the companies turn around and fundamentally becoming strong. Also the magic happens when more diversification is done in various sectors under various scripts with equal money invested in each N500 scripts.
The real deal is when to purchase and where to purchase the stock. That is where Breakout study comes into play.
Check this stock which has made an all time low and high chances that it makes a "V" shaped recovery.
> Taking support at last years support or breakout level
> High chances that it reverses from this point.
> Volume dried up badly in last few months / days.
> Very high suspicion based analysis and not based on chart patterns / candle patterns deeply.
> VALUABLE STOCK AVAILABLE AT A DISCOUNTED PRICE
> OPPURTUNITY TO ACCUMULATE ADEQUATE QUANTITY
> MARKET AFTER A CORRECTION / PANIC FALL TO MAKE GOOD INVESTMENT
DISCLAIMER : This is just for educational purpose. This type of analysis is equivalent to catching a falling knife. If you are a warrior, you throw all the knives back else you will be sorrow if it hits SL. Make sure to do your analysis well. This type of analysis only suits high risks investor and whose is willing to throw all the knives above irrespective of any sectoral rotation. BE VERY CAUTIOUS AS IT IS EXTREME BOTTOM FISHING.
HOWEVER, THIS IS HOW MULTIBAGGERS ARE CAUGHT !
STOCK IS AT RIGHT PE / RIGHT EVALUATION / MORE ROAD TO GROW / CORRECTED IV / EXCELLENT BOOKS / USING MARKET CRASH AS AN OPPURTUNITY / EPS AT SKY.
LET'S PUMP IN SOME MONEY AND REVOLUTIONIZE THE NATION'S ECONOMY!
ACC Trade Setup for the Week(14–18 July 2025) – Uptrend ChannelACC Ltd. (NSE: ACC) has been trading inside a clean uptrend channel for the past few weeks, bouncing consistently between rising support and resistance. Now, it approaches a critical inflection point — the lower support of the channel.
While no breakdown has occurred yet, the structure is weakening, and a bearish opportunity may soon present itself. Let’s explore how to trade this if the setup confirms.
1. What’s Happening on the Chart?
ACC is trading close to the channel support zone (~₹1975).
The resistance zone near ₹2000–₹2020 has held strong.
A potential breakdown below the rising green support trendline could trigger a bearish move toward the ₹1910–₹1920 demand zone.
But nothing is confirmed yet — this is a watchlist setup.
2. Trade Setup – Conditional Bearish Opportunity
✅ Trade Plan:
Wait for breakdown of the rising support line.
After breakdown, wait for a re-test of the broken support zone (~₹1975–₹1980).
Look for bearish confirmation via a candlestick pattern (engulfing or strong rejection) on the 15-min or 1-hour timeframe.
🚨 Entry Trigger:
Only enter short if re-test holds and price starts reversing.
📉 Stop Loss:
SL should be above the re-test high (around ₹1990–₹1995).
🎯 Target:
Profit booking zone: ₹1910–₹1920.
Potential R:R: 1:2, 1:3, or even 1:4 depending on entry.
3. Why This Setup Matters
Trend exhaustion is visible near the upper resistance of the channel.
A clean breakdown + re-test gives a low-risk entry.
The 200 EMA lies near the target zone, providing confluence for mean reversion.
4. What If There’s No Breakdown?
If price respects the support and bounces again, no trade should be taken on the short side.
In that case, look for possible bullish reversal signals back toward channel resistance — or stay neutral.
5. Final Thoughts
This is a highly conditional setup — and patience is the key. Don’t jump the gun. The best trades happen after confirmation.
🔔 What to watch this week:
Breakdown below ₹1975 support
Re-test and rejection from ₹1975–₹1985
Confirmation candle (bearish engulfing)
Only then consider a short trade toward ₹1910 with a well-placed SL.
Plan your trade. Wait for structure. Trade only when the market shows its hand.

COIN Breakout Loading: Smart Money Reclaim Underway | WaverVanir🚀 COIN Breakout Loading: Smart Money Reclaim Underway | WaverVanir Alpha Alert
NASDAQ:COIN just tapped a deep discount zone, rebounded from the 0.5–0.618 retracement band, and is now reloading liquidity under the previous high.
⚙️ Technical Breakdown:
✅ Fibonacci Golden Pocket (0.618 at $384.67) was respected with strong wick rejections.
🧠 Volume compression hints at algorithmic absorption under $388.
🔴 Red Supply Block @ $393.91–$395.80 is next liquidity target.
🟡 EMA ribbon acting as dynamic support, stabilizing at $381–$382.
🎯 Target Structure:
🚀 Break $388 → blast through $393.91 (1.236) → ignite options gamma toward $400.19
🔥 Your move, institutions. This is the last discount before markup.
💰 Trade Thesis:
Holding 7/11 $387.5C @ 0.71 – Target Sell @ $1,000 per contract.
Time is short. But so is volatility.
One wick above $393.91 can detonate open interest.
🧠 If this reclaims $388 with a strong candle and volume surge, expect FOMO to carry this into the gamma squeeze zone by EOD.
📍 Posted by WaverVanir International LLC – Quant-Fueled Liquidity Engine | VolanX Protocol Alpha Layer
#COIN #Coinbase NASDAQ:COIN #OptionsFlow #GammaSqueeze #LiquidityRaid #SmartMoney #TradingStrategy #SMC #QuantEdge #FibLevel #WaverVanirAlpha #VolanX #BreakoutTrade #VolumeProfile #BuyTheDip #HighConvictionTrade

Micron Technology - Another +50% rally will follow!Micron Technology - NASDAQ:MU - will rally another +50%:
(click chart above to see the in depth analysis👆🏻)
About two months ago Micron Technology perfectly retested a confluence of support. This retest was followed by bullish confirmation, nicely indicating a reversal. So far we saw a rally of +100%, but looking at the channel pattern and previous cycles, another +50% will follow.
Levels to watch: $200
Philip (BasicTrading)
#LONGTERMVISION

MTN Nigeria Stock: A Strong Rally smashing the roofMTN Nigeria Stock: A Strong Rally smashing the roof
MTN Nigeria stock has demonstrated remarkable growth since trading around the 170 naira zone in December 2024.
As of December 9th, the stock was priced at 170 naira but has steadily rallied over the months to surpass several resistance levels (N320, N357 & N386).
Based on this momentum, the nearest most significant support zone is N386. This is a zone with confluence between an ascending resistance trendline and a support level.
The question is.
1. Can the buy continue with this vertical push-up up
2. Will the N386 confluence zone continue to hold this stock from falling?
Trade with care.
Please like, follow, and share your thoughts.

ADOBE MONEY SNATCH! High-Reward Long Setup (Police Trap Alert!)🚨 ADOBE HEIST ALERT: Bullish Bank Robbery Plan! (High-Risk, High-Reward Loot) 🚨
🌟 ATTENTION, MARKET PIRATES & MONEY SNATCHERS! 🌟
(Hola! Bonjour! Marhaba! Hallo!)
🔥 THIEF TRADING STRATEGY 🔥 – ADOBE INC. (ADBE) is primed for a bullish heist! Time to steal profits like a pro!
🔓 ENTRY POINT: "BREAK THE VAULT!"
"The loot is unguarded!" – Go LONG at any price, but for smarter robbers:
Set Buy Limit orders (15m/30m recent swing levels).
ALERT UP! Don’t miss the heist signal!
🛑 STOP-LOSS: "ESCAPE ROUTE!"
Thief SL: Nearest 2H nearest Swing Low (Adjust based on your risk tolerance & lot size).
Police (Bears) are lurking – Don’t get caught!
🎯 TARGET: 440.00 (OR BAIL BEFORE THE COPS ARRIVE!)
Scalpers: Stick to LONG side only!
Big Bankroll? Charge in! Small stack? Join the swing robbers!
Trailing SL = Your Getaway Car!
📢 WHY ADOBE Inc?
🐂 Bullish momentum + Overbought but greedy!
🚨 High-risk Red Zone – Trend reversal? Police trap? Bears are strong here!
💸 "Take profits & TREAT YOURSELF – You earned this loot!"
📡 STAY SHARP, THIEF!
Fundamentals, News, COT Reports, Geopolitics – CHECK THEM! (Linkkss ☝👉👆👉).
Market shifts FAST! Adapt or get caught holding bags!
⚠️ WARNING: NEWS = VOLATILITY TRAP!
Avoid new trades during news!
Trailing stops = Your bulletproof vest!
💥 BOOST THIS HEIST! 💥
"Like & Boost = Stronger Robbery Crew!"
💰 More boosts = More profit heists! 🚀
Stay tuned… Next heist coming soon! 🏴☠️🤑

PLTR - Palantir Technologies: Why PLTR is the Perfect PlayExceptional Performance Leadership
Palantir Technologies has established itself as the undisputed champion of the U.S. stock market in 2025. The stock has delivered extraordinary returns of 402.92% over the past 12 months and 87.89% year-to-date, making it the best-performing stock in both the S&P 500 and Nasdaq-100 indices. Currently trading at $142.10, the stock has surged from lows around $21, representing one of the most dramatic momentum plays in modern market history.
Powerful AI-Driven Revenue Growth
The company's financial performance has been nothing short of spectacular. Palantir's U.S. commercial AIP (Artificial Intelligence Platform) revenue has surpassed a $1 billion annual run rate with 71% year-over-year growth. The company reported Q1 2025 revenue of $883.86 million, beating consensus estimates and growing 39% year-over-year. This growth trajectory is being driven by unprecedented demand for AI solutions across both commercial and government sectors.
The company's customer base has expanded to 769 total customers, up 39% year-over-year, with 44% of revenue now coming from commercial clients. This diversification away from pure government dependency represents a significant strategic achievement that provides multiple growth vectors.
Strategic Government AI Dominance
Maven Smart System Contract Expansion
Palantir's government business has reached new heights with its Maven Smart System contract being increased by $795 million, bringing the total value to over $1.3 billion through 2029. Pentagon leaders boosted the contract citing "growing demand" for the system across all military branches, including the Army, Navy, Air Force, Space Force, and Marine Corps.
Stargate AI Initiative Leadership
The company holds a central position in the $500 billion Stargate AI infrastructure project, positioning it as a backbone for America's AI future. This initiative represents one of the largest technological undertakings in U.S. history, designed to establish domestic AI superiority and reduce reliance on foreign systems.
Strategic Partnerships
Palantir has formed landmark partnerships with Microsoft for classified AI deployment and Accenture Federal Services for comprehensive government AI implementation. These alliances significantly expand the company's reach and delivery capabilities across the federal ecosystem.
Technical Momentum Confirmation
Bullish Technical Setup
The stock exhibits exceptional technical strength with multiple confirmation signals:
Moving Average Alignment : All major moving averages (20-day, 50-day, 200-day) are positioned bullishly below the current price, indicating sustained upward momentum
RSI Positioning: At 58.42, the RSI shows healthy momentum without being overbought, providing room for continued advancement
Volume Confirmation: Recent trading volumes have consistently exceeded 50 million shares daily, indicating strong institutional participation
Golden Cross Pattern: The 50-day moving average at $131.9 remains above the 200-day moving average at $101.7, confirming the bullish trend
Breakout Pattern
The stock has successfully broken above the $140 resistance level with strong volume, targeting the $175-$220 range based on technical analysis. The pennant pattern breakout above $140 has been confirmed by institutional buying pressure and retail momentum.
Institutional Investment Surge
Record Institutional Participation
Institutional ownership has reached 45.65% of outstanding shares, with $19.19 billion in institutional inflows over the past 12 months versus only $10.43 billion in outflows. This represents a net institutional buying pressure of nearly $9 billion, demonstrating strong professional investor confidence.
Premium Analyst Coverage
Wedbush Securities has raised its price target to $160, calling Palantir the "Messi of AI" and positioning it as a top pick in their "IVES AI 30" list. The firm sees Palantir's AIP platform as foundational for the trillion-dollar AI spending wave and believes the company has a "golden path to become the next Oracle".
Competitive Advantages and Market Position
Architecture-Agnostic Platform
Palantir's AIP is architecture-agnostic, seamlessly integrating with both centralized cloud systems and decentralized frameworks. This versatility allows the company to serve diverse client needs across multiple sectors, from government defense to commercial healthcare.
Network Effects and Data Flywheel
The company benefits from powerful network effects where more customers generate more data, which improves AI models and increases retention rates. This creates a self-reinforcing competitive advantage that becomes stronger over time.
Government Moats
Palantir's deep government relationships and security clearances create substantial barriers to entry. Multi-year government contracts provide revenue stability and growth visibility that few technology companies can match.
Financial Strength and Profitability
The company has demonstrated seven consecutive quarters of GAAP profitability with expanding margins. Adjusted operating margins have improved to 36% in Q1 2025 from 29% previously, showing operational excellence alongside revenue growth. The company maintains a strong balance sheet with $4 billion in cash and equivalents.
Investment Thesis Summary
Palantir Technologies represents the perfect convergence of momentum, fundamentals, and catalysts that defines exceptional investment opportunities:
Momentum Factors:
402.92% twelve-month returns leading all major indices
Continuous institutional accumulation with $9 billion net inflows
Technical breakout above key resistance with volume confirmation
Fundamental Catalysts:
$1 billion+ AIP commercial revenue run rate with 71% growth
$1.3 billion+ government contract pipeline expansion
Central role in $500 billion Stargate AI infrastructure initiative
Strategic Positioning:
Architecture-agnostic platform creating multiple market opportunities
Government relationships providing defensive moats and growth visibility
Network effects and data flywheel creating competitive advantages
Risk-Adjusted Opportunity:
Clear support levels at $137-$140 range providing defined risk parameters
Multiple price targets ranging from $155-$220 suggesting significant upside potential
Strong balance sheet and cash generation providing downside protection
Palantir Technologies embodies the rare combination of explosive growth, defensive positioning, and strategic importance that creates generational investment opportunities. The company's leadership in AI government applications, combined with accelerating commercial adoption, positions it as a cornerstone holding for the AI revolution.

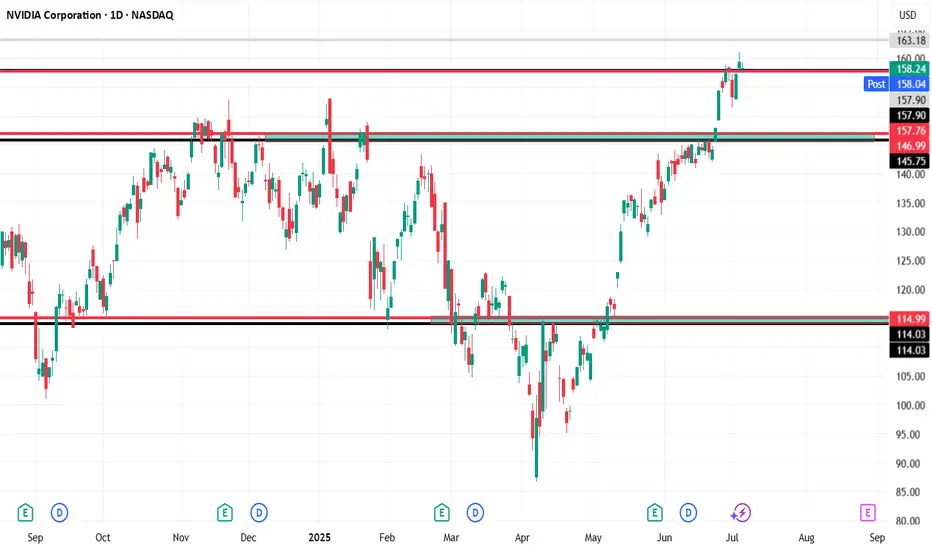
NVDA📊 NVIDIA (NVDA) – Daily Chart Technical Analysis
Entry Point:
A long position is considered at $158, assuming the price holds above $157.78.
Resistance & Target:
The first target is set at $163, which is a clear resistance zone on the chart based on historical price reactions.
If momentum continues beyond that, higher targets could be considered in future analysis.
Stop Loss:
A tight stop-loss is placed just below key support at $157 to manage risk.
🔄 Weekly Bearish Scenario:
If the price closes below $157, this invalidates the bullish setup:
The first downside target would be $146, which is a previously established support zone.
A further drop could extend toward $115, especially if broader market weakness or sector rotation occurs.
📌 Key Technical Zones:
Support Zones: $157.78, $157.00 (critical for bullish continuation)
Resistance Zones: $158.12, $163.18
Multiple historical rejections and price consolidations are noted near these zones, highlighting their significance.
Summary:
As long as NVDA remains above $157.78, the outlook remains bullish targeting $163. However, a confirmed breakdown below $157 could shift the sentiment sharply bearish, targeting $146 and possibly $115.
NYKAA - Cup and HandleGood candle today, valid entry for a swing trade. The volume candle on earnings day is hiding the high volume candles printed in the last week. Keep today's low as SL

MSTR stock has seen a strong rally since JuneSince June, MSTR stock has seen a strong rally—rising from the mid‑$300s to above $430—driven by a few key factors:
Bitcoin’s continued ascent has fueled sentiment. Bitcoin recently hit fresh record highs (above $118K), driven by a weakening dollar and bullish macro trends, which in turn boosted bitcoin-linked equities like MicroStrategy.
In short, MSTR’s rally since June has been largely Bitcoin-driven: a powerful combination of rising crypto prices, ongoing BTC purchases, proactive capital raises, and positive analyst sentiment creating a bullish feedback loop.
Let me know if you'd like a breakdown of Bitcoin’s trend or deeper insight on MSTR’s financing strategy.
$447 will be my next buy TP.
Please, share your thought, like, share and follow me.

MP Materials Options Ahead of EarningsIf you haven`t bought MP before the previuos earnings:
Now analyzing the options chain and the chart patterns of MP Materials prior to the earnings report this week,
I would consider purchasing the 25usd strike price Calls with
an expiration date of 2025-6-20,
for a premium of approximately $2.97.
If these options prove to be profitable prior to the earnings release, I would sell at least half of them.

META Platforms Long Setup – Ready for the Next Move?💣 META Masterplan: Bullish Break-In Activated! 💼📈
🌟Hi! Hola! Ola! Bonjour! Hallo!🌟
Dear Money Makers & Silent Strategists, 🤑💰💸✈️
We’ve locked in on our next high-value digital vault: META Platforms Inc.
Built on our signature Thief Trading Style™ — where fundamentals meet stealth technical precision — this is your map to the bullish jackpot.
📍 ENTRY PLAN – Door’s Unlocked!
✅ Enter at any level — this heist is already in motion.
OR
🎯 Set your Buy Limit on a 15m/30m swing low or high — classic pullback infiltration.
🛑 STOP LOSS – Your Exit Route
Before breakout? Hold the line.
After breakout? Drop your SL at the recent 4H swing low – and size it to your risk appetite.
This isn’t luck — it’s calculated theft. 🔐
🎯 TARGET ZONE – Grab & Vanish
🎯 Aim: 770.00
But if the cops (aka sellers) show up early, get out with your loot — no shame in a clean getaway.
“Profit is the win. Perfection is fantasy.”
⚡ SCALPERS' TIPS – Quick In & Out
💵 Big wallet? Enter now.
💳 Tight budget? Follow the swing team.
Either way — longs only, and trailing SL is your safety rope.
📊 WHY META? – Intel Behind the Mission
🔍 This plan is reinforced by:
🔥 Strong Fundamentals
📈 Sentiment Signals
🧠 Quantitative + Macro Flow
💼 COT Data
🌐 Intermarket Correlations
It’s all aligning — the pressure’s building, and the breakout door is creaking open...
🚨 TRADING ALERT – Stay Outta Trouble
💥 Avoid placing new trades during major news drops.
🎯 Use trailing SL to protect and lock profits — your getaway vehicle must be ready.
💖 Support the Heist? Smash Boost!
Fuel the mission — every Boost empowers the crew.
This is Thief Trading Style — we don’t chase, we plan, strike, and vanish with the win. 🏆💪🐱👤
📡 Another breakout mission incoming. Stay hidden. Stay profitable. 🤑🚀

Mean Reversion Trade: MA1. RSI in oversold region
2. Price likely to rebound back the the mean
Trade Rules:
Entry Trigger - RSI has cross below oversold region, enter limit buy at close price
Exit Trigger - Close at market when close price cross above exit trigger (Red step line)
