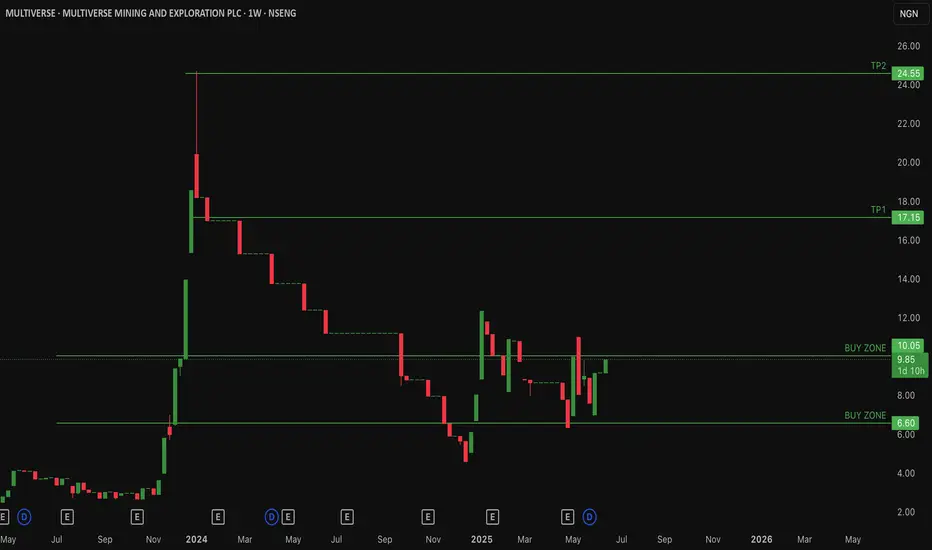
$MULTIVERSE Multiverse over 60% retracement from All time HighNSENG:MULTIVERSE Multiverse Mining & Exploration Plc focuses on quarrying solid minerals (granite, zinc, tin, tantalite, barite, columbite, gold, etc.) in Nigeria, with operations in Ogun and Nasarawa State.
Currently NSENG:MULTIVERSE has lost over 60% of its value from an all time high of 24.50/share and is in consolidation.
Current price: 9.85naira/share
Low risk Buy zone levels is between 6.8naira - 10naira/share
Expecting #Multiverse to retest previous resistances at 17naira/share and 24naira/share if price attempts a recovery.
📈 Key Levels
Breakout above ₦10.20 Breakout zone – key resistance turning into support if broken
₦17.1 TP1 – next major resistance (target)
₦24.5 TP2 – higher resistance / bull target
Invalidation of this idea is a weekly close under 6.8naira/share
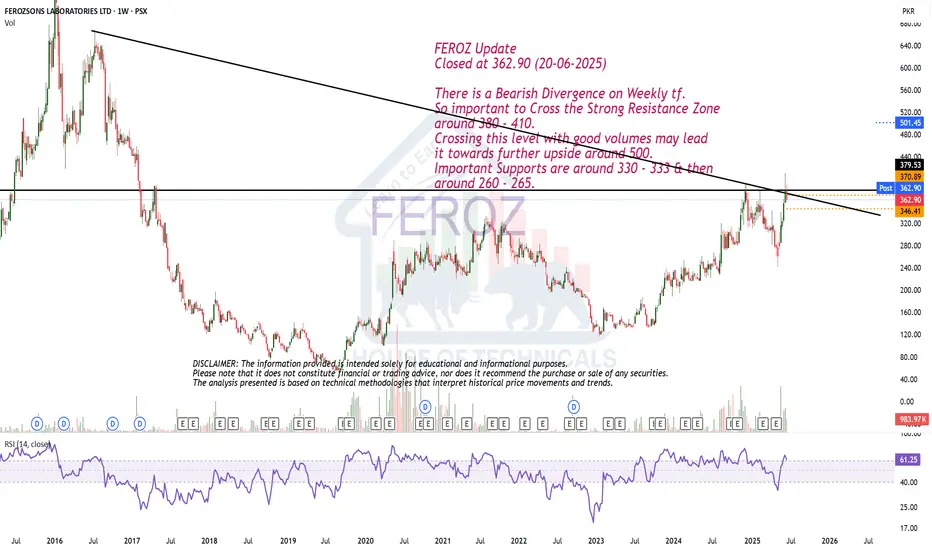
Bearish Divergence on Weekly tf.FEROZ Update
Closed at 362.90 (20-06-2025)
There is a Bearish Divergence on Weekly tf.
So important to Cross the Strong Resistance Zone
around 380 - 410.
Crossing this level with good volumes may lead
it towards further upside around 500.
Important Supports are around 330 - 333 & then
around 260 - 265.
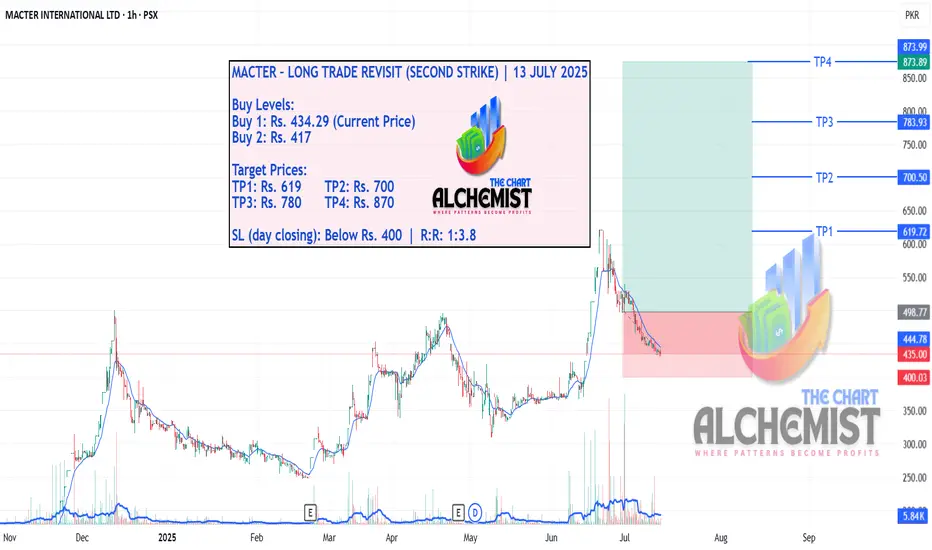
MACTER – LONG TRADE REVISIT (SECOND STRIKE) | 13 JULY 2025MACTER – LONG TRADE REVISIT (SECOND STRIKE) | 13 JULY 2025
After a successful first strike call that achieved all targets, MACTER experienced a deeper-than-expected pullback. With the stop loss now adjusted below Rs. 400, we are issuing a revisit entry as a Second Strike, based on renewed bullish potential.
GOOGL Raid Plan: Bulls Set to Hijack the Chart!💎🚨**Operation GOOGL Grab: Robbery in Progress! Swing & Run!**🚨💎
🌟Hi! Hola! Ola! Bonjour! Hallo! Marhaba!🌟
Dear Money Makers & Silent Robbers, 🤑💰💸✈️
Get ready for another high-stakes market heist – this time, we’re raiding the vaults of GOOGL (Alphabet Inc.) using the Thief Trading Strategy™. Based on sharp technical intel and subtle fundamental whispers, the setup is clear: the bulls have cracked the code, and it’s time to grab our loot.
🟢 🎯 ENTRY POINT - THE LOOT ZONE
"The vault is wide open!"
Snatch your bullish entry anywhere on the chart, but the pros will place limit buys on recent pullbacks (15m/30m zones), either on swing lows or highs. The pullback is your door in — don’t miss it!
🛑 STOP LOSS - ESCAPE ROUTE
Set the Thief SL at the recent 2H swing low (162.00).
But remember, each robber’s risk appetite is unique — adjust your SL based on your size, cash, and courage.
🎯 TARGET - GETAWAY MONEY
💼 Main Target: 186.50
Or if heat rises early, vanish with your gains before the full score hits. Disappear like a ghost — profit first, questions later!
🧲 FOR SCALPERS – THE QUICK GRAB
Only ride the long wave — shorting is off-limits in this mission.
If your wallet is loaded, dive in. If not, join the swing crew.
Use trailing SL to protect your cash stack 💰.
📈 THE SETUP – WHY THIS RAID WORKS
The GOOGL Market is bursting with bullish energy — a classic Red Zone robbery moment.
Overbought tension, fakeouts, trend shifts — exactly where we love to strike! Consolidation and reversals = opportunity for the brave.
📣 TRADING ALERT - NEWS AHEAD!
🚨 Avoid entries during news releases – they trigger alarms!
Use trailing SL to lock in your stash, especially during high-volatility windows.
🔍 TIPS FROM THE THIEF’S DESK
Stay updated with the latest whispers — from fundamentals to geopolitical noise, COT positioning to sentiment swings. The market changes faster than a thief on the run — so adapt fast!
💖 Show some love: 💥Hit that Boost Button💥
Let’s fuel this robbery plan with more power and precision.
Every day in the market is a new heist — let’s win like thieves, not sheep. 🏆💪🤝❤️🚀
I'll be back soon with another masterplan...
📡 Stay sharp, stay hidden — and always aim for the vault. 🤑🐱👤🎯

BATA – LONG TRADE (SECOND STRIKE) | 13 JULY 2025BATA – LONG TRADE (SECOND STRIKE) | 13 JULY 2025
The stock broke out of a consolidation phase (marked in light pink) after remaining in a downtrend (marked in blue channel). It achieved TP1 in our previous call and has now formed multiple bullish structures that are expected to act as major support for the next leg up.

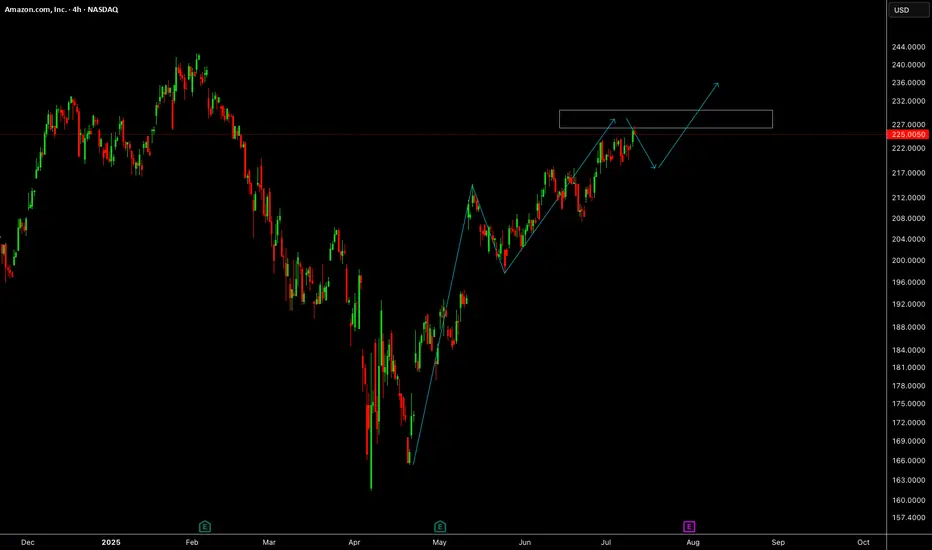
AmazonAmazon needs small correction and further push up towards 235 level.
Disclosure: We are part of Trade Nation's Influencer program and receive a monthly fee for using their TradingView charts in our analysis.
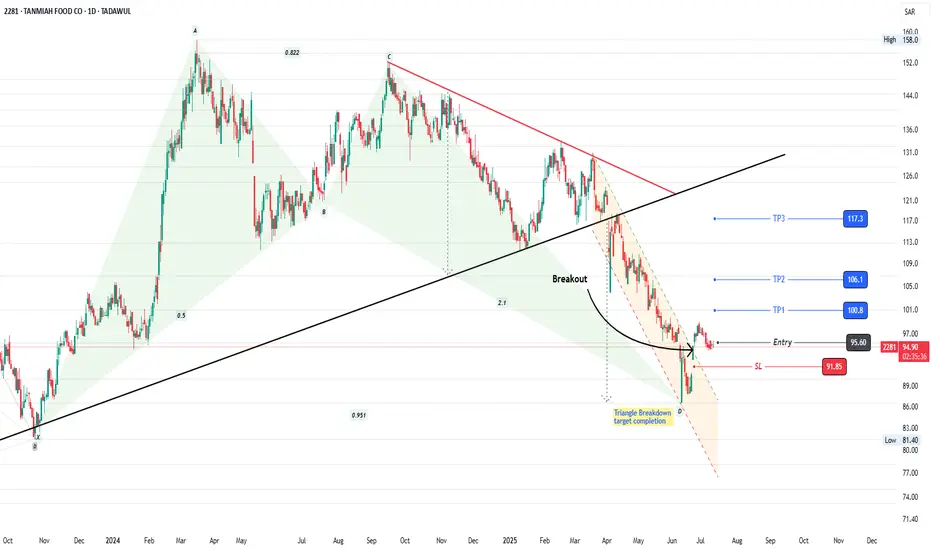
2281: Bullish Harmonic Pattern2281: Bullish Harmonic Pattern
2281 is struggling since last ATH in Sept 2024. Beautifully forming a Bullish harmonic pattern at significant support level.
Breakout of descending parallel channel is observed. Formation of HH and HL confluence is also favoring bulls.
Take Entry now or
After formation of another HH (breakout of psychological support level of 100)
Trail your stop loss accordingly.
Manage your risk.
Enjoy the ride!
DELL eyes on $116.10: Golden Genesis fib will determine TrendDELL has been a sleepy stock with mixed earnings.
Now testing a proven Golden Genesis at $116.01
Look for a Break-and-Retest to start an Uptrend.
.
See "Related Publications" for other plots ---------------------->>>>>>>
This one in particular is caught the BOTTOM exaclty:
===================================================
.

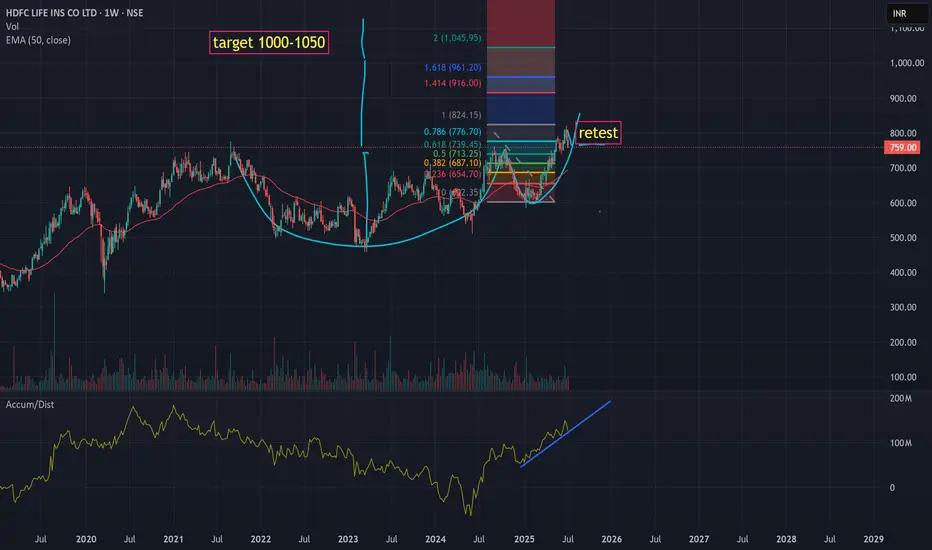
should move to 1000 Range after current retest of breakout Should try to breakout from the support retest as there is no negative news and result is due this week. Should run to 820-850 this week before results if not manipulated.
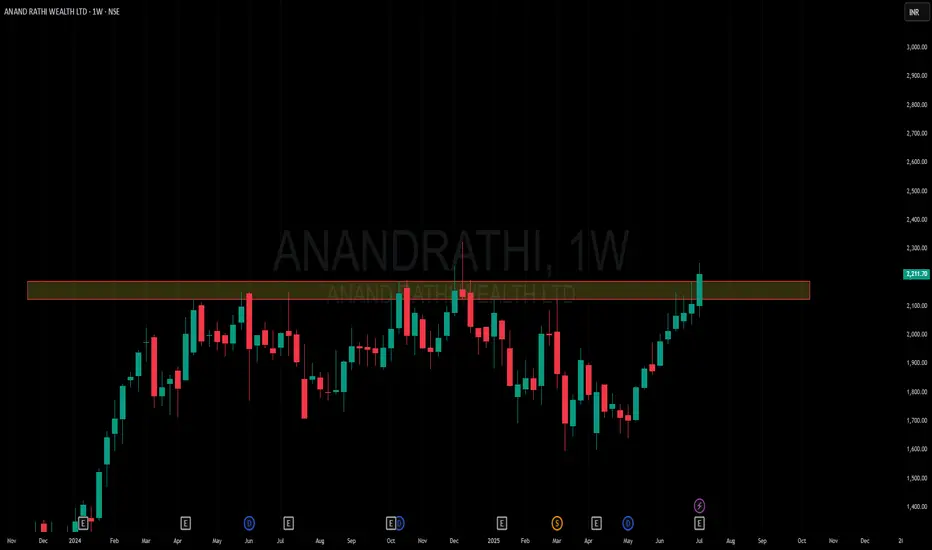
Amazing breakout on WEEKLY Timeframe - ANANDRATHICheckout an amazing breakout happened in the stock in Weekly timeframe, macroscopically seen in Daily timeframe. Having a great favor that the stock might be bullish expecting a staggering returns of minimum 25% TGT. IMPORTANT BREAKOUT LEVELS ARE ALWAYS RESPECTED!
NOTE for learners: Place the breakout levels as per the chart shared and track it yourself to get amazed!!
#No complicated chart patterns
#No big big indicators
#No Excel sheet or number magics
TRADE IDEA: WAIT FOR THE STOCK TO BREAKOUT IN WEEKLY TIMEFRAME ABOVE THIS LEVEL.
Checkout an amazing breakout happened in the stock in Weekly timeframe.
Breakouts happening in longer timeframe is way more powerful than the breakouts seen in Daily timeframe. You can blindly invest once the weekly candle closes above the breakout line and stay invested forever. Also these stocks breakouts are lifelong predictions, it means technically these breakouts happen giving more returns in the longer runs. Hence, even when the scrip makes a loss of 10% / 20% / 30% / 50%, the stock will regain and turn around. Once they again enter the same breakout level, they will flyyyyyyyyyyyy like a ROCKET if held in the portfolio in the longer run.
Time makes money, GREEDY & EGO will not make money.
Also, magically these breakouts tend to prove that the companies turn around and fundamentally becoming strong. Also the magic happens when more diversification is done in various sectors under various scripts with equal money invested in each N500 scripts.
The real deal is when to purchase and where to purchase the stock. That is where Breakout study comes into play.
Check this stock which has made an all time low and high chances that it makes a "V" shaped recovery.
> Taking support at last years support or breakout level
> High chances that it reverses from this point.
> Volume dried up badly in last few months / days.
> Very high suspicion based analysis and not based on chart patterns / candle patterns deeply.
> VALUABLE STOCK AVAILABLE AT A DISCOUNTED PRICE
> OPPURTUNITY TO ACCUMULATE ADEQUATE QUANTITY
> MARKET AFTER A CORRECTION / PANIC FALL TO MAKE GOOD INVESTMENT
DISCLAIMER : This is just for educational purpose. This type of analysis is equivalent to catching a falling knife. If you are a warrior, you throw all the knives back else you will be sorrow if it hits SL. Make sure to do your analysis well. This type of analysis only suits high risks investor and whose is willing to throw all the knives above irrespective of any sectoral rotation. BE VERY CAUTIOUS AS IT IS EXTREME BOTTOM FISHING.
HOWEVER, THIS IS HOW MULTIBAGGERS ARE CAUGHT !
STOCK IS AT RIGHT PE / RIGHT EVALUATION / MORE ROAD TO GROW / CORRECTED IV / EXCELLENT BOOKS / USING MARKET CRASH AS AN OPPURTUNITY / EPS AT SKY.
LET'S PUMP IN SOME MONEY AND REVOLUTIONIZE THE NATION'S ECONOMY!
MSTR MICROSTRATEGY As of July 11, 2025, MicroStrategy Incorporated (MSTR) is trading at approximately $434.58 per share on the NASDAQ, showing a strong daily gain of about 3.04% (+$12.84). The stock has experienced significant growth recently, with a 3-month return of around 45% and a 1-year return exceeding 220%.
Key Highlights about MicroStrategy (MSTR):
Industry: Software - Application
Market Cap: Approximately $118.8 billion
Shares Outstanding: About 273 million
Trading Range (Year): Low near $102.40 and high around $543.00
Volume: Active trading with daily volumes around 18 million shares
CEO: Phong Q. Le
Headquarters: Tysons Corner, Virginia, USA
Business: MicroStrategy provides enterprise analytics software and services, including a platform for data visualization, reporting, and analytics. It serves a broad range of industries including finance, retail, technology, and healthcare.
Recent Price Trend
The stock has steadily appreciated from about $255 in February 2025 to over $430 in July 2025.
Recent trading range for July 11 was between $423.70 and $438.70.
After-hours trading shows a slight dip to around $433.25.
Outlook
The next earnings announcement is scheduled for July 31, 2025.
Analysts forecast the stock price could range between $434.58 and $798.13 in 2025, reflecting optimism about the company’s growth prospects and market position.
MicroStrategy’s strong correlation with Bitcoin price movements (due to its large BTC holdings) often influences its stock volatility and performance.
In summary: MicroStrategy is a major player in enterprise analytics software with a highly volatile stock influenced by its Bitcoin exposure and market sentiment. Its stock price has surged strongly in 2025, reflecting both business fundamentals and crypto market dynamics.

Buy this stock if you want to get burnedThis isn't going to be a V shaped recovery y'all. Another leg down is on the way.

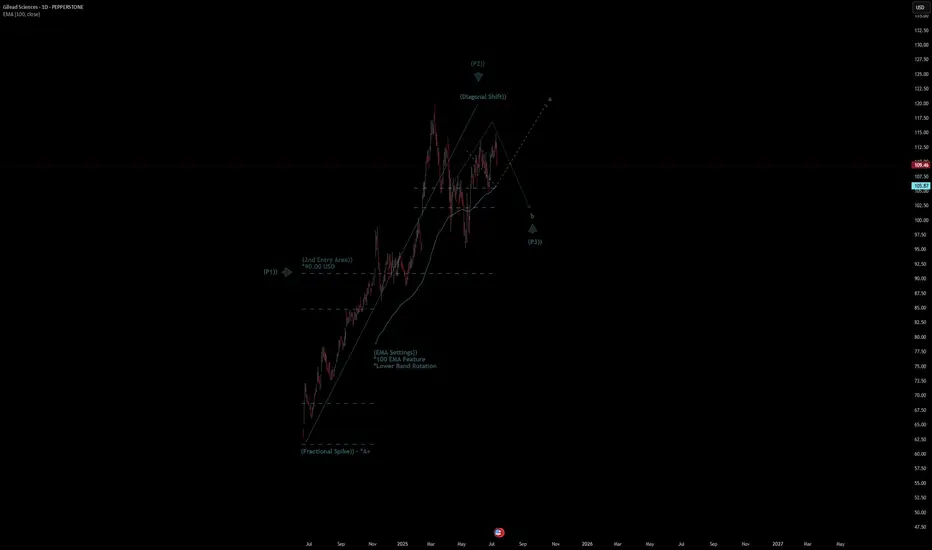
Gilead Sciences Quote | Chart & Forecast SummaryKey Indicators On Trade Set Up In General
1. Push Set Up
2. Range Set Up
3. Break & Retest Set Up
Notes On Session
# Gilead Sciences Quote
- Double Formation
* (Fractional Spike)) - *A+ | Completed Survey
* (2nd Entry Area)) - *90.00 USD | Subdivision 1
- Triple Formation
* (P1)) / (P2)) & (P3)) | Subdivision 2
* (TP1) = a / Long Consecutive Range
* (TP2) = b / Short Consecutive Pullback | Subdivision 3
* Daily Time Frame | Trend Settings Condition
- (Hypothesis On Entry Bias)) | Regular Settings
- Position On A 1.5RR
* Stop Loss At 98.00 USD
* Entry At 110.00 USD
* Take Profit At 126.00 USD
* (Uptrend Argument)) & No Pattern Confirmation
- Continuation Pattern | Not Valid
- Reversal Pattern | Not Valid
* Ongoing Entry & (Neutral Area))
Active Sessions On Relevant Range & Elemented Probabilities;
European-Session(Upwards) - East Coast-Session(Downwards) - Asian-Session(Ranging)
Conclusion | Trade Plan Execution & Risk Management On Demand;
Overall Consensus | Buy

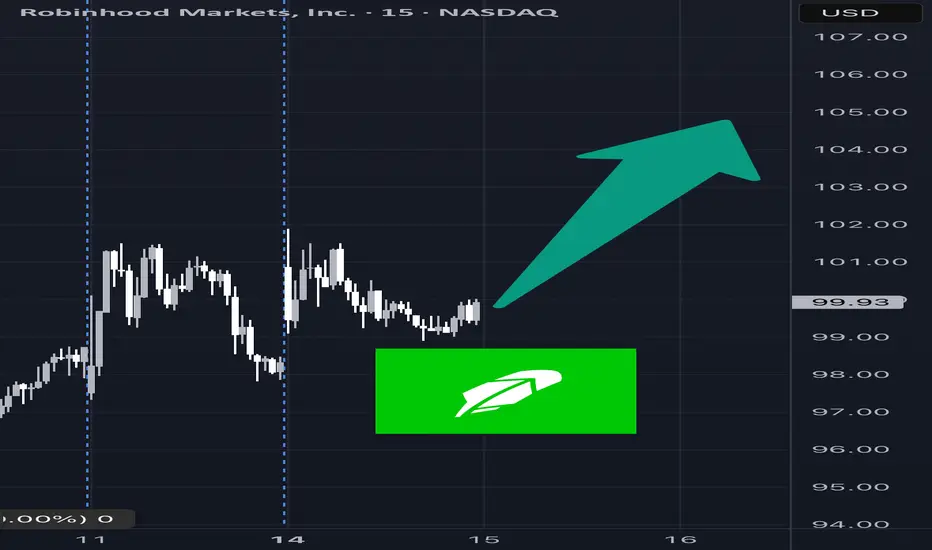
HOOD Weekly Call Option Setup – 07/14/2025 $106C | Exp. July 18
📈 HOOD Weekly Call Option Setup – 07/14/2025
$106C | Exp. July 18 | Breakout Watch Above $100 👀
⸻
🔥 BULLISH MOMENTUM BUILDING
🟢 HOOD is pushing hard into $100 resistance — price riding above 10/50/200 EMAs on all timeframes.
📊 RSI hot (65.6 on 5m / 71.6 daily), but not maxed out — short-term pullback possible, but trend still bullish.
💰 Volume + call flow favor more upside.
⸻
📰 Catalyst:
Positive crypto market sentiment = increased trading activity = good for HOOD’s core business.
VIX at 16.40 = risk-on environment = perfect for high-beta names like this one.
⸻
🎯 Trade Plan – High R/R Call Setup
Clean structure, riding sentiment — but be quick around $100.
{
"ticker": "HOOD",
"type": "CALL",
"strike": 106,
"exp": "2025-07-18",
"entry": 0.92,
"target": 1.38,
"stop": 0.46,
"size": 1,
"confidence": "70%",
"entry_timing": "market open"
}
🔹 Entry: $0.92
🎯 Target: $1.38 (+50%)
🛑 Stop: $0.46 (-50%)
📅 Expiry: 07/18/25
📈 Confidence: 70%
💼 Strategy: Naked Call
⸻
💬 Model Consensus:
“Moderately Bullish” — clean momentum + bullish call flow = good entry.
⚠️ Watch RSI + $100 resistance — quick rejection is possible.
⸻
📌 Why $106C?
🔸 OI building there → potential magnet
🔸 Cheaper than ATM but within reach
🔸 High gamma setup if we break $100 early
⸻
💡 Trade Smart:
🏃 Get in early → fade into strength
🧠 Position size accordingly → don’t get greedy
📢 Tag your trading buddy who’s still ignoring HOOD 😏
#HOOD #OptionsTrading #BreakoutSetup #CryptoMomentum #AITrading #CallOptions #FlowPlay #TradingView #0DTE #
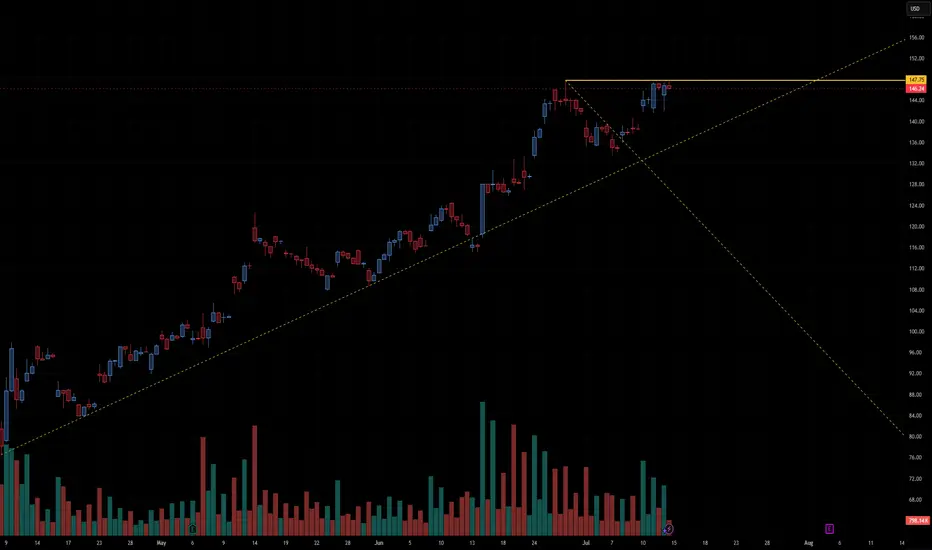
CVNA will falling rates save this darling?VNA (Carvana Co.) shows a strong bullish trend with a breakout setup forming. Here’s a detailed technical analysis:
📈 Trend Analysis: Strong Uptrend
CVNA has been in a clear uptrend, characterized by higher highs and higher lows since March.
The ascending yellow trendline confirms consistent buying interest with each pullback being bought.
This trendline is acting as dynamic support and continues to hold the structure of the uptrend intact.
📊 Consolidation Below Resistance
The stock is currently consolidating just below the horizontal resistance at $75.42.
Multiple candles are pressing against this level without significant rejection, which is a bullish sign of accumulation.
Consolidation under resistance, particularly in an uptrend, often leads to a bullish breakout.
🧱 Key Levels
Resistance: $75.42 – Price has tested this level multiple times, forming a potential bullish breakout level.
Support: $67.87 – A key horizontal level from a prior breakout area. Also roughly aligns with the ascending trendline, giving this support more significance.
🔊 Volume Analysis
Volume has been steady but slightly rising as price approaches the resistance.
Watch for a volume spike on the breakout above $75.42, which would add strong confirmation of buying interest and trigger potential upside follow-through.
📍 Potential Scenarios
✅ Bullish Breakout
A clean close above $75.42 could ignite a breakout move.
Potential target zones:
$80–82 short term, based on the height of the previous consolidation.
Higher if momentum builds, given the strength of the current trend.
⚠️ Bearish Pullback
If price fails to break out and drops below the trendline, it could trigger a short-term correction.
First support test would be $67.87; a break below this could shift sentiment bearish in the short term.
🧠 Summary
CVNA is showing classic bullish continuation signals: strong uptrend, consolidation below resistance, and rising support. This ascending triangle pattern often resolves to the upside. Traders should watch for a breakout above $75.42 with volume for a potential entry, while maintaining awareness of support at $67.87 for risk management.
CCJ stead as she goes but triple top failure ahead?Cameco Corp. (CCJ) shows a strong uptrend with a consolidation just below resistance, which is a bullish technical pattern. Let’s break it down:
🔍 Technical Analysis of CCJ
1. Trend Structure
Clear uptrend: The stock has been making a series of higher highs and higher lows since March.
Ascending trendline (yellow dashed line): Price continues to respect this trendline as dynamic support, indicating sustained buying momentum.
2. Resistance Zone
Horizontal resistance at ~$75.42: This level has been tested multiple times but not yet convincingly broken.
The recent candles are testing this level again, showing pressure building. This increases the probability of a breakout.
3. Support Zone
Horizontal support at ~$67.87: This was the breakout level from a prior consolidation in early June and has acted as support since then.
Also aligns with the ascending trendline, forming a rising base—a sign of strength.
4. Volume Analysis
Volume has been picking up slightly during the current approach to resistance, but a significant spike in volume on a breakout would add strong confirmation.
Notably, there was strong volume during previous rallies—momentum buyers may be waiting for a confirmed breakout before re-entering.
✅ Bullish Scenario
A daily close above $75.42, ideally on above-average volume, could trigger a breakout with a target toward $80–82 in the near term.
The steep angle of the ascending trendline supports a continued rally if broader market conditions are favorable.
⚠️ Bearish/Neutral Scenario
If price fails to break above $75.42 and drops below the ascending trendline, look for a retest of the $67.87 level.
A break below that support could open the door for a deeper pullback toward the mid $60s.
🧠 Summary
CCJ is in a bullish consolidation pattern with strong support from a rising trendline and a flat-top resistance at ~$75.42. The setup resembles a classic ascending triangle, a continuation pattern that often resolves with a breakout in the direction of the prevailing trend (up).
Watch closely for:
A breakout candle above $75.42 with strong volume
Potential pullbacks toward the trendline for entries if breakout fails temporarily

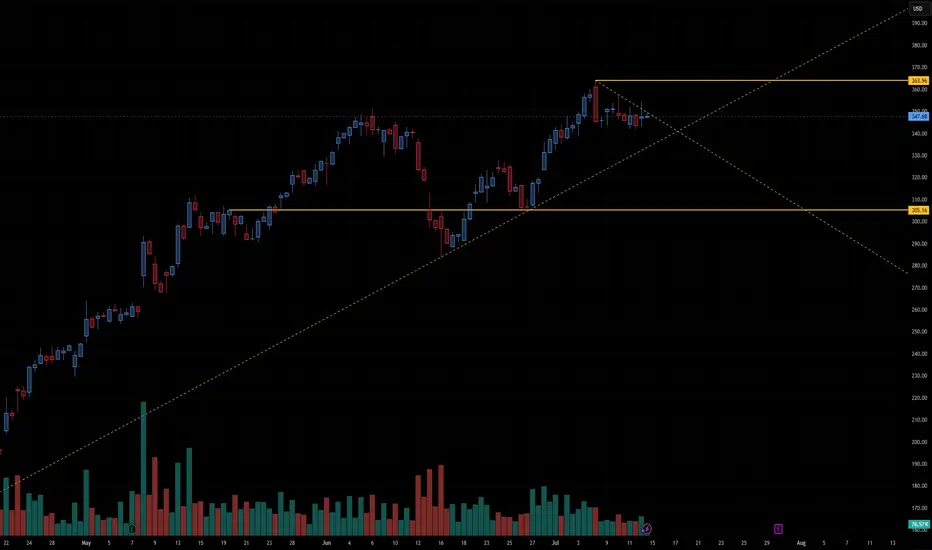
AMD preparing to break out or fail at resistance🔍 Chart Structure & Key Levels
Horizontal Resistance:
The stock is repeatedly testing the $147.75 level, which is acting as a horizontal resistance (shown in orange). Price has stalled here for several sessions, creating a tight range just below resistance—a common precursor to breakouts.
Ascending Trendline Support:
A long-term upward trendline (dashed yellow) supports the current move. Price has respected this line multiple times, showing a strong bullish structure over the past few months.
Volume Analysis:
Volume has decreased during the recent consolidation near the highs, which is typical before a breakout. However, we want to see a volume spike on a confirmed breakout above $147.75 to validate strength.
Symmetrical Triangle / Coil:
There's a tightening pattern forming between the rising trendline and the flat resistance, indicating price compression. This type of structure is often resolved with a large directional move.
✅ Bullish Scenario
A confirmed breakout above $147.75 with volume expansion could trigger a strong upward move.
Price could quickly target the psychological level near $150, and potentially beyond to $155+, based on the height of the prior impulse wave.
⚠️ Bearish Breakdown Scenario
If price fails to break above $147.75 and breaks the ascending trendline, a pullback to $140 or $135 becomes likely.
A breakdown would invalidate the current bullish structure and signal a potential short-term reversal.
🧠 Summary
This chart is in a bullish consolidation with a coiled setup just under major resistance. A breakout above $147.75 is the critical level to watch for upside continuation. Traders should monitor volume and candlestick confirmation before entering positions.
AAPL PREPARING FOR A LARGER MOVEAAPL clearly shows a descending channel pattern, marked by two parallel downward-sloping yellow trendlines. Within that broader structure, the price is currently consolidating in a narrow range between two horizontal yellow lines:
Resistance around $210.98
Support around $207.46
🔍 Current Technical Setup
Consolidation Range
AAPL is moving sideways in a tight range between $207.46 and $210.98. This narrow trading zone within a broader descending channel is typical of compression before a breakout.
Descending Channel Context
The channel suggests a longer-term downtrend bias, but the compression at these levels can lead to a breakout in either direction, especially when volume starts to increase.
Support Zone ($207.46)
This level has been tested and held, making it a key line to watch. A breakdown below this support would likely trigger a sharper selloff toward the lower channel boundary, near $203–$204.
Resistance Zone ($210.98)
This level lines up with the upper boundary of the current consolidation and the midline of the descending channel. A breakout above would invalidate the local downtrend and could send price to test the top of the channel (~$214+).
Volume Clues
Volume is relatively low during this sideways movement, which often precedes a high-volume breakout as indecision resolves.
📈 Scenarios to Watch
Bullish Breakout
Above $210.98 and the descending trendline.
Likely target: $214–$216
Confirmation: Volume spike + strong bullish candle
Bearish Breakdown
Below $207.46 support.
Target: $203 or lower, testing channel support.
Confirmation: Increasing red volume + bearish momentum
🧠 Summary
AAPL is in a compressed state, with a tight horizontal range forming inside a broader downward-sloping channel. This often sets the stage for a powerful directional move. Traders should closely monitor breaks of $210.98 or $207.46 to catch the next leg — either a reversal toward higher levels or continuation of the downtrend.

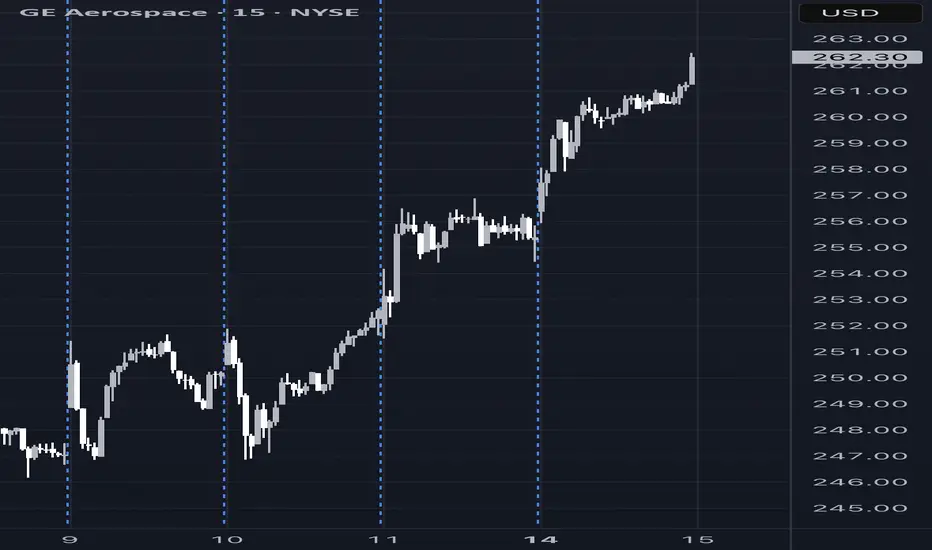
GE Weekly Options Trade Setup – 07/14/2025 $290C | Exp. July 18
📈 GE Weekly Options Trade Setup – 07/14/2025
$290C | Exp. July 18 | Bullish Catalyst In Play
⸻
🔥 BULLISH MOMENTUM CONFIRMED
✅ All 5 major AI models (Grok, Claude, Gemini, Llama, DeepSeek) agree:
GE just broke out — strong momentum, price above MAs, MACD bullish.
📰 Catalyst: Citigroup Upgrade 💥
Low implied volatility + analyst boost = ideal environment for calls.
⚠️ Caution: RSI is overbought, signaling possible short-term pullback. This is a fast trade, not a swing.
⸻
🎯 Trade Plan – High Conviction Setup
Entry at open, ride breakout continuation 🚀
{
"ticker": "GE",
"type": "CALL",
"strike": 290,
"exp": "2025-07-18",
"entry": 0.89,
"target": 1.78,
"stop": 0.45,
"size": 1,
"confidence": "70%",
"entry_timing": "market open"
}
🔹 Entry: $0.89
🎯 Target: $1.78 (+100%)
🛑 Stop: $0.45 (-50%)
📅 Expiry: 07/18/25
📈 Confidence: 70%
💼 Strategy: Naked Call
⸻
📌 Why $290C?
High strike = low cost, great R/R. High OI, and supported by breakout levels from DeepSeek & Grok models.
🧠 Model Sentiment:
“Moderately Bullish” – All point to upside, but suggest smart risk management due to hot RSI.
⸻
💡 Quick Notes
⚠️ Overbought ≠ reversal — just be quick.
📊 Citigroup news is driving flows — but don’t hold into chop.
💬 Tag someone who’s been sleeping on GE 👇
#GE #OptionsTrading #BreakoutPlay #CallOption #AITrading #WeeklySetup #FlowWatch #0DTE #tradingview
$DHER to $40- XETR:DHER i.e Delivery Hero is working towards profitability and exiting markets where it doesn't want to burn on operations.
- Company is becoming leaner, meaner and strategic in areas where it operates and dominates.
- Region MENA is growing (31% YoY)
- It has nice free cash flow per share growth. XETR:DHER posted ~227% YoY growth in free cash flow, putting it in the top 10% of its peers, well above its 3‑year average of ~32% .

LDOS LONG🚀 NYSE:LDOS – Breakout Setup After Months of Accumulation
NYSE:LDOS is showing a high-conviction breakout setup after six months of tight accumulation. Here's what I'm seeing:
🔹 Flagging on the 8EMA with low volume – classic bullish continuation
🔹 Clean structure with higher lows and controlled pullbacks
🔹 Volume drying up during the recent consolidation = potential energy building
🔹 Breakout in progress with RSI staying strong but not overbought
🔹 Accumulation range forming a solid launchpad
📈 With earnings due Aug 5 (BMO) and strong fundamental backing, I expect volume to come in soon and fuel the next leg higher.
🟢 Targets:
$184 short-term
$211 by year-end
🔴 Stop:
$159 – below the accumulation base and prior support zone
Why I Like It:
✅ EPS growth +325% YoY
✅ Forward P/E only 14.1
✅ Strong ROE (31%) + institutional accumulation
✅ Momentum without overextension
✅ Positioned in a defensive-growth sector with macro tailwinds (defense, cybersecurity, AI)
📊 Looks like smart money has been accumulating – and it's almost time to move.

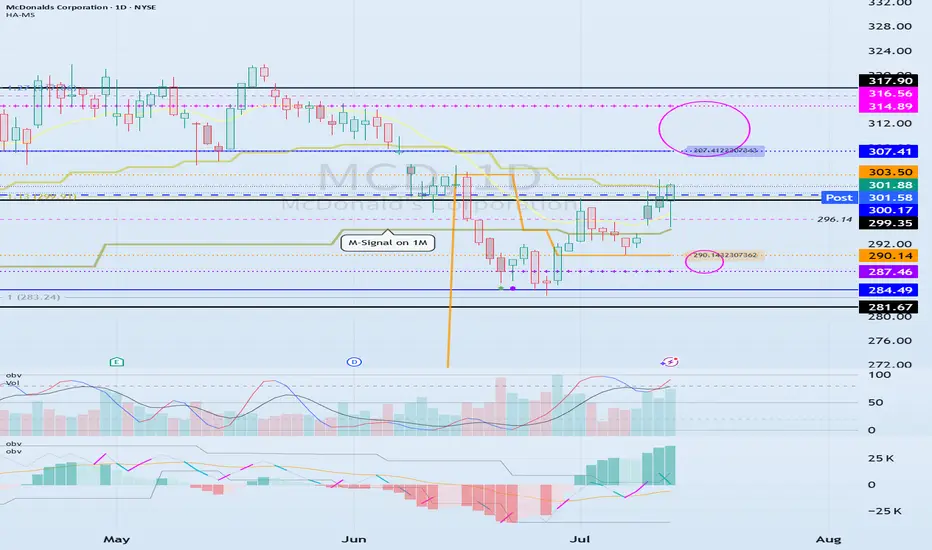
The key is whether it can be supported and rise near 300.17
Hello, traders.
If you "Follow", you can always get new information quickly.
Have a nice day today.
-------------------------------------
(MCD 1D chart)
Before following the basic trading strategy, the first thing to check is whether the current price is above or below the M-Signal indicator on the 1M chart.
If the price is below the M-Signal indicator on the 1M chart, there is a possibility that it will turn into a medium- to long-term downtrend.
Therefore, if possible, it is recommended to trade stocks whose prices are above the M-Signal indicator on the 1M chart.
If the price is below the M-Signal indicator on the 1M chart, you should respond quickly and briefly using the short-term trading (day trading) method.
-
The support and resistance zones can be seen as the 287.46-290.14 zone and the 307.41-314.89 zone.
The 287.46-290.14 zone is the DOM(-60) ~ HA-Low zone, and the 307.41-314.89 zone is the HA-High ~ DOM(60) zone.
These two zones are likely to form a trend depending on how they break through, so they can be seen as support and resistance zones.
-
The 300.17-316.56 zone is the HA-High ~ DOM(60) zone on the 1W chart.
Therefore, we need to check whether it can receive support and rise in the 300.17-316.56 zone.
Therefore, if it falls near the 307.41-314.89 range, you should check for support near 300.17.
-
If it rises above the HA-High ~ DOM(60) range, it is likely to show a step-up trend, and if it falls in the DOM(-60) ~ HA-Low range, it is likely to show a step-down trend.
-
Thank you for reading to the end.
I hope you have a successful transaction.
--------------------------------------------------