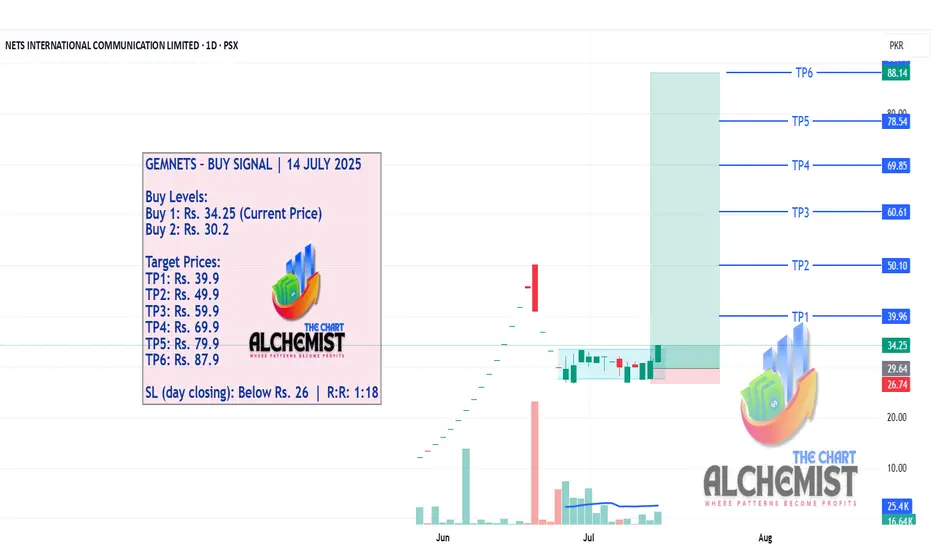
GEMNETS – BUY SIGNAL | 14 JULY 2025GEMNETS – BUY SIGNAL | 14 JULY 2025
After a strong move from Rs. 12 to Rs. 20, GEMNETS entered a pullback phase, which has now transformed into a bullish flag and reaccumulation zone — a powerful structure setting up for another leg higher.
GADT – BUY SIGNAL (THIRD STRIKE) | 14 JULY 2025 | 1H TIME FRAMEGADT – BUY SIGNAL (THIRD STRIKE) | 14 JULY 2025 | 1H TIME FRAME
After breaking out of a slightly upsloping trading range (marked in light blue) and achieving a high of Rs. 570, GADT pulled back. With the pullback nearly complete, we expect a bounce and a run toward multiple quantified displacement targets.

Fortis Healthcare Long:Fortis Healthcare Long:
- Price takes support @ 20 DEMA
- Near All time high
- Hidden Bullish Divergence
- Earnings call in next month

KEI Industries Long_Support @ 20 DEMAKEI Industries Long:
- Price takes support at 20/50 & 200 Daily EMA
- Hidden Bullish Divergence
- Earnings next week
- Enter Long when the prices are favorable in the lower timeframe
- SL: Close below 20 DEMA

AGL – BUY SIGNAL (THIRD STRIKE) | 14 JULY 2025AGL – BUY SIGNAL (THIRD STRIKE) | 14 JULY 2025
After achieving a high of Rs. 75 and correcting into a selling climax, AGL reversed sharply and entered a sideways accumulation. Recent price action now suggests the stock is poised to move upward.

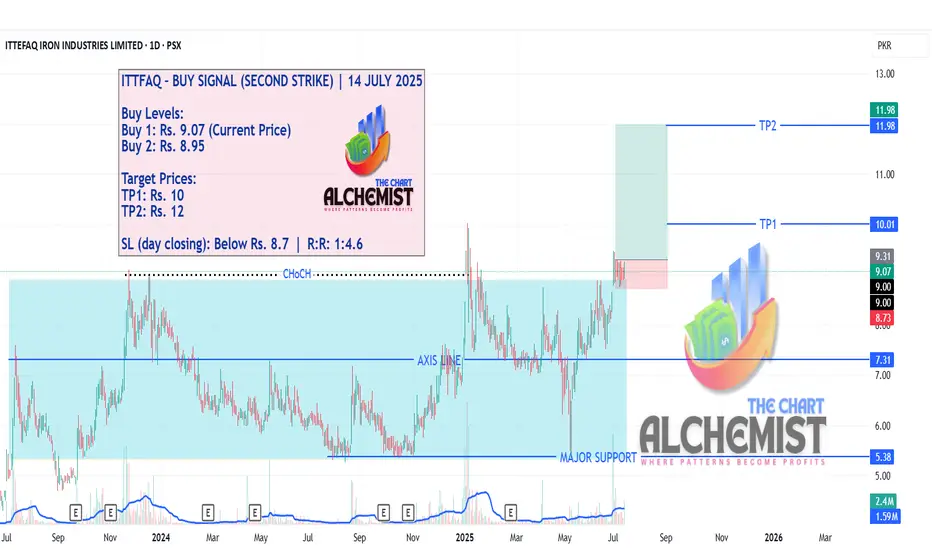
ITTFAQ – BUY SIGNAL (SECOND STRIKE) | 14 JULY 2025ITTFAQ – BUY SIGNAL (SECOND STRIKE) | 14 JULY 2025
Given the recent formation of a bullish structure, we're revising both buy and stop loss levels to reflect the current opportunity.
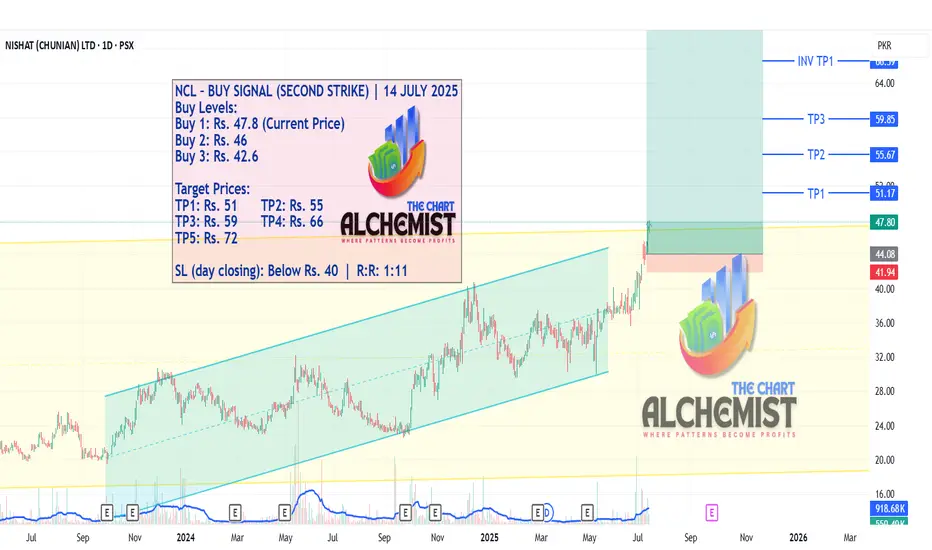
NCL – BUY SIGNAL (SECOND STRIKE) | 14 JULY 2025NCL – BUY SIGNAL (SECOND STRIKE) | 14 JULY 2025
After a successful first strike that achieved all targets, NCL has now broken out of consolidation zones on both higher (yellow) and shorter (light blue) time frames. This setup presents a strong second strike opportunity.
EMCO – BUY SIGNAL | 14 JULY 2025EMCO – BUY SIGNAL | 14 JULY 2025
After breaking out of a trading range (light blue channel) and achieving a high of Rs. 59, EMCO completed its pullback and retest phase, positioning itself for upward movement.

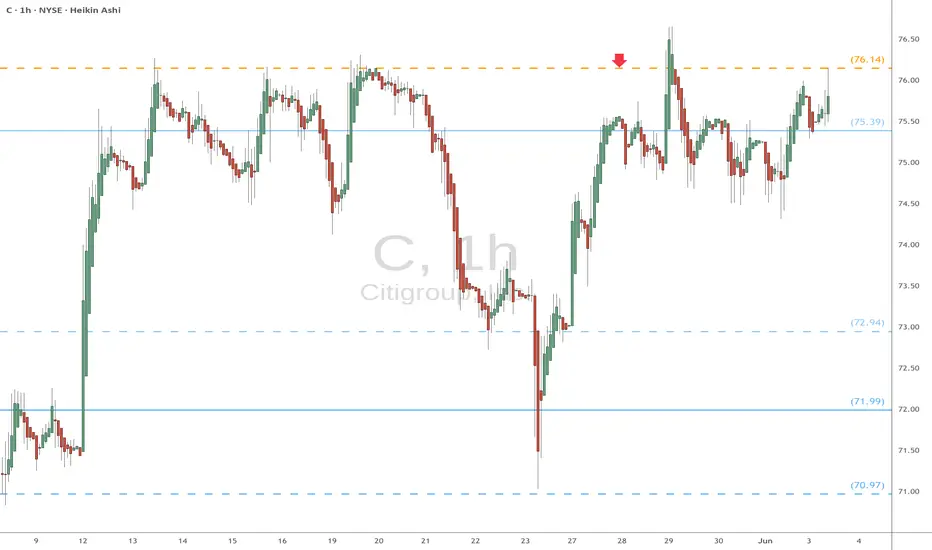
C (Citi) eyes on $76.14: Golden Covid ready to launch BreakOutC with all banks has recovered to pre-tariff levels.
It has pierced a proven Golden Covid fib at $76.14
Look for a Retest (preferably with a Ping) for entry.
PLTR: Trend Analysis 📈 PLTR | SMC Trend Continuation or Reversal? Watch This Key Zone
🔍 Chart Type: 15m
🧠 Strategy: Smart Money Concepts (LuxAlgo), EMA Stack (20/50/100/200)
📊 Volume Surge: 177.99K
🧭 Narrative: Institutional Accumulation + Premium Rejection
🚨 Current Price: $145.88
📍 Market Structure:
Price is currently reacting from a Premium Zone just above a recent Break of Structure (BoS).
We've seen a Chg of Character (ChgofCHoCH) and several bullish BoS confirming smart money intent.
Volume expansion at the highs suggests potential liquidity grab.
📐 Key Levels:
Premium Zone near $146
Equilibrium at ~$143
Discount Zone begins near $140
Strong Edge (deep discount) below $138
Long-term Target remains at $165.11 if bullish channel is respected.
📉 Bearish Scenario:
Break below Equilibrium and retest of Discount Zone = liquidity sweep
Watch if price retraces toward $140.10 (blue line) or lower for a higher-probability long.
📈 Bullish Scenario:
Break above current swing high confirms expansion toward $152+ and eventually $165.11
EMA stack remains bullishly aligned → trending continuation likely unless broken with momentum.
🔎 Institutional Insight:
Smart Money is likely building positions below equilibrium before major continuation. Liquidity pockets between $138–$140 are prime zones for potential long entries.
📆 Watchlist Catalyst:
Earnings cycle or Palantir federal contract news could align with breakout.
🧠 VolanX DSS Rating: BULLISH BIAS
✅ Structure: Bullish
✅ Volume: High
✅ Liquidity: Grabbed above recent highs
⛔ Confirmation: Await premium rejection or retrace to discount
—
🔁 Executed via VolanX Scanner + WaverVanir DSS
📊 Trade the future. Protect the edge. Lead with intelligence.
#WaverVanir #PLTR #SmartMoneyConcepts #VolumeProfile #MarketStructure #TechnicalAnalysis #VolanX #InstitutionalTrading #QuantFinance #TradingEdge #PropTrading

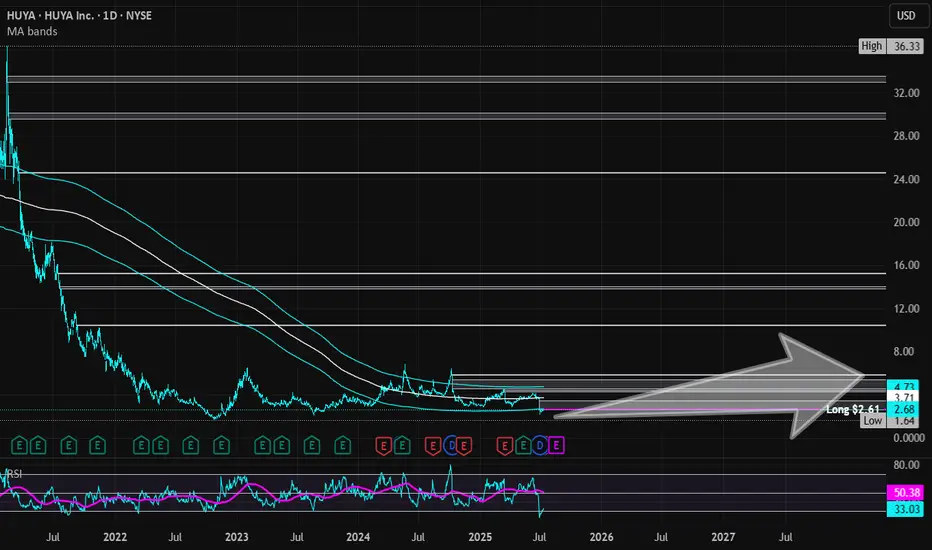
HUYA | HUYA | Long at $2.61HUYA NYSE:HUYA operates game live streaming platforms in China. This stock got my attention based on the reported fundamentals and price position, but moderate "Chinese delisting" risks exist given the US's new political administration.
Book Value = $3.23 (Undervalued)
Forward P/E = 4.1x (Growth)
Debt-to-equity = 0x (Healthy)
Quick Ratio = 1.56x (Healthy)
Altman's Z Score = <1.8 (Bankruptcy risk is relatively high)
From a technical analysis perspective, the stock price momentum has shifted upward based on the historical simple moving average. The price often consolidates within and slightly outside of this simple moving average band before progressing higher (after a long period of selling). While near term-declines are a risk, a longer-term hold (if the fundamentals do not change and delisting doesn't occur) may pay off given the value, growth, and overall health of the company.
Thus, at $2.61, NYSE:HUYA is in a personal buy zone.
Targets into 2028:
$3.45 (+32.2%)
$5.80 (+122.2%)
$HIMS - ORBCLEAN breakout for NYSE:HIMS today.
DP_ORB Indicator marked it at candle close outside of ORB Zone, with confirmation bias from a higher high, and volume. All take profits were hit!
If you want the DP_ORB Indicator for FREE:

Viking Holdings (VIK) – Sailing Ahead in Luxury TravelCompany Snapshot:
Viking NYSE:VIK is a premium cruise operator targeting affluent retirees and “active agers”, offering adult-only ships and experiential itineraries designed for high-value travelers seeking enrichment and comfort.
Key Catalysts:
Premium Brand with Pricing Power 💰
Unlike many peers, Viking has avoided deep discounting, maintaining premium pricing—a testament to brand equity and customer loyalty, protecting margins amid inflationary pressures.
Exceptional Demand & Occupancy 📈
Occupancy rates consistently above 90% reflect both high demand and strong operational execution, boosting revenue per cruise and signaling long-term customer retention.
Tailwinds from Demographic Trends 👴🏻👵🏻
Viking is uniquely positioned to benefit from the global growth in affluent aging populations, who prioritize experience-driven travel over material consumption.
Investment Outlook:
Bullish Entry Zone: Above $46.00–$47.00
Upside Target: $75.00–$76.00, powered by brand strength, margin durability, and demographic-driven demand.
🛳️ As a leader in luxury cruising, Viking is charting a long-term growth course anchored in loyalty, premium experiences, and generational travel trends.
#VikingCruises #VIK #LuxuryTravel #ExperientialTourism #CruiseStocks #ActiveAgers #RetirementBoom #TravelDemand #PremiumBrand #ConsumerDiscretionary

ZM: Okay My time to get paid. If the market wills, my contracts will be in the money! playing some butterflies.
-Sam

ADBE watch $362-364: Key Support zone must hold to end DownTrendADBE was struggling before last earnings and dumping since.
Currently trying to lift out of a significant support at $362-364
Looking for a Break-n-Retest of zone top Genesis fib at $324.26
.

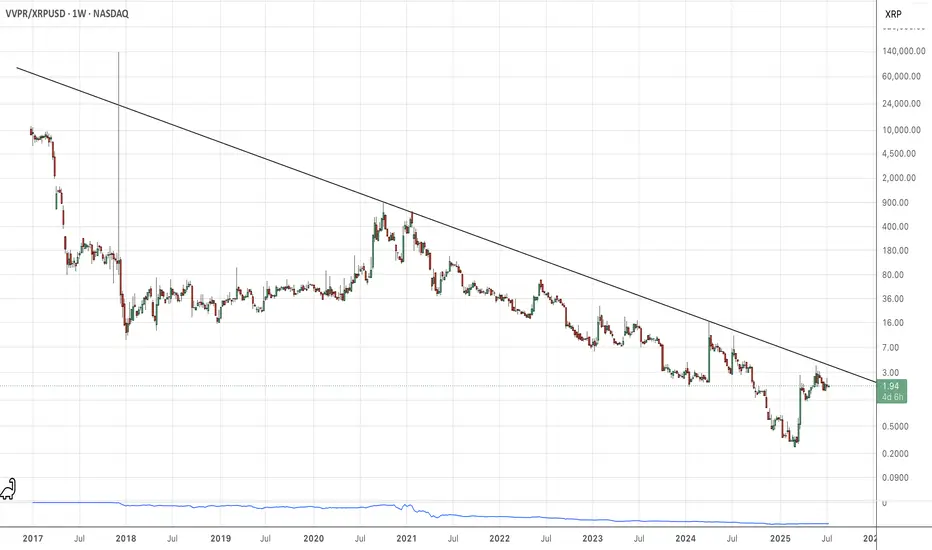
VivoPower/RippleIf you concatenate VVRP/XRP, you can see that Ripple has been outperforming VVRP. But, we have a bunch of touches of the descending overhead, and I bet that VVPR breaks out from the overhead and starts outperforming XRP.
hdfc bank on side way formation hdfc bang today formed a negative pattern can go in consolidation for a while trendline support is good and needs to sustain above it for positive trend hold

Analyzing and trading stocks using Dr. Elder's Three Screen MethThe first thing I do is analyze the weekly chart. Here I want to see price divergence to the MACD indicator
Next, I go to the daily chart and want to see the divergence between the price and the indicator
I then move to the hourly chart and look for the divergence here.
The price has only risen a couple of points above the previous peak, but that's enough for me. I enter a trade when the bar is broken
NYSE:BK

Stocks SPOT ACCOUNT: WMT stocks Buy Trade with Take ProfitStocks SPOT ACCOUNT: NYSE:WMT stocks my buy trade with take profit.
This is my SPOT Accounts for Stocks Portfolio.
Trade shows my Buying and Take Profit Level.
Spot account doesn't need SL because its stocks buying account.
Looks good Trade.
Disclaimer: only idea, not advice

Stocks SPOT ACCOUNT: QUBT stocks buy trade with take profitStocks SPOT ACCOUNT: NASDAQ:QUBT stocks my buy trade with take profit.
This is my SPOT Accounts for Stocks Portfolio.
Trade shows my Buying and Take Profit Level.
Spot account doesn't need SL because its stocks buying account.

Stocks SPOT ACCOUNT: AMD stocks buy trade with take profitStocks SPOT ACCOUNT: NASDAQ:AMD stocks my buy trade with take profit.
This is my SPOT Accounts for Stocks Portfolio.
Trade shows my Buying and Take Profit Level.
Spot account doesn't need SL because its stocks buying account.

Stocks SPOT ACCOUNT: TESLA stocks buy trade with take profitStocks SPOT ACCOUNT: MARKETSCOM:TESLA stocks my buy trade with take profit.
Buy Stocks at 297 and Take Profit at 319.
This is my SPOT Accounts for Stocks Portfolio.
Trade shows my Buying and Take Profit Level.
Spot account doesn't need SL because its stocks buying account.

MRK eyes on $80.36/74: Double Golden zone break to end DownTrendMRK and all pharma has been dropping forever.
Just pierced the Double Golden zone yet again.
Break and Hold of this zone will say "bottom".
.
