Long above 13960Nonstop move after the breakout of 10,350, stock is moving in a upward channel respecting upper and lower bend as resistance and support, out of 3 past sessions, stock formed 2 weak candles, today's low at 13,620 can act as immediate support (Not marked), below that stock may find next support at 13,285, 12,720 and zone at 12,010 - 12,210 can be the good support to hold the price from further fall, above 13,960 stock may chase for 14,775, 15,385 and 15,920. (On a weekly TF stock looks quite week so far.) CMP: 13,705

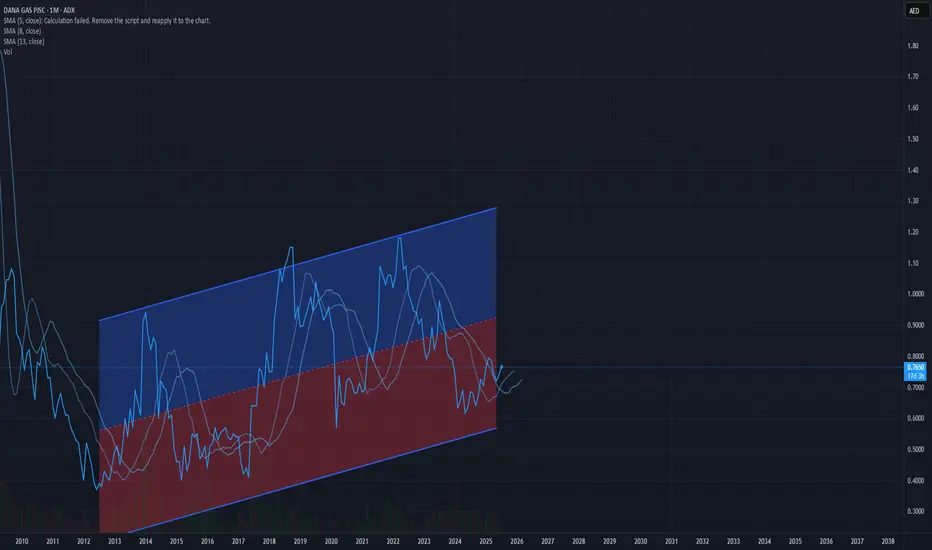
on an up treand from the historical data of the past few years adding the dividents of this year looking very appeling and on an up treand looks to reach the 1-1.2 target before the end of the year
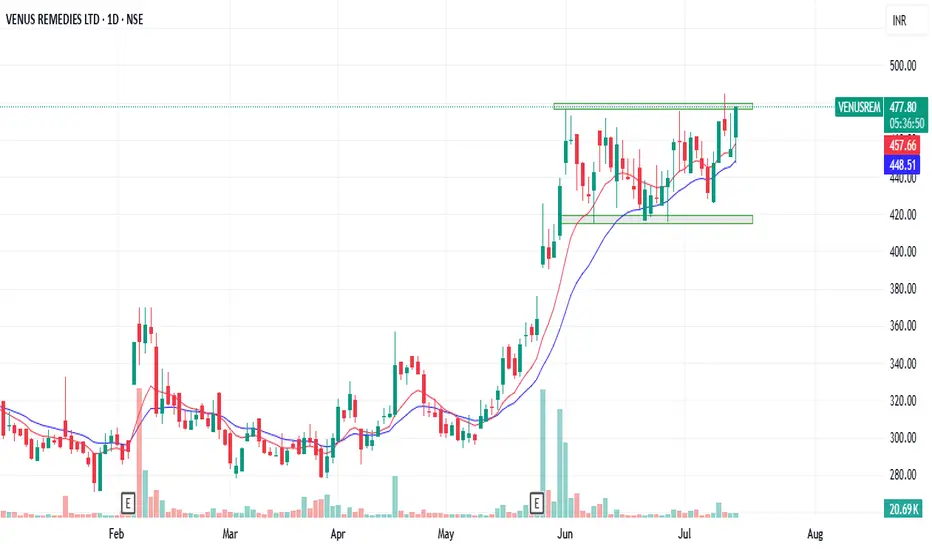
over all a good time to enter on this uptrend
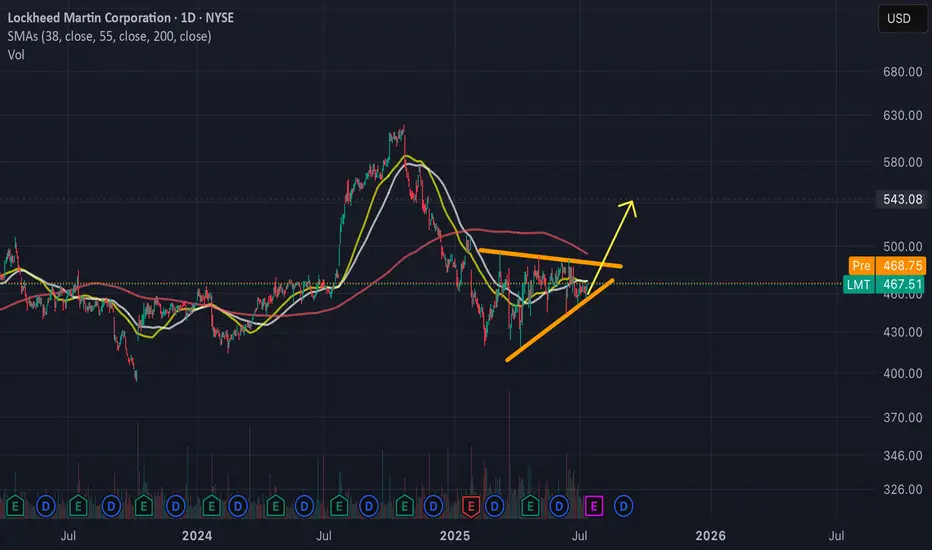
Lockheed 25-07-14 - 467 USD - moving higherLockheed with high demand for following products:
- Himars
- F -35
- rockets for Patriot System
Gap around 540 USD. Moving average preparing for golden cross.
Expect 540 USD within 12 Months.
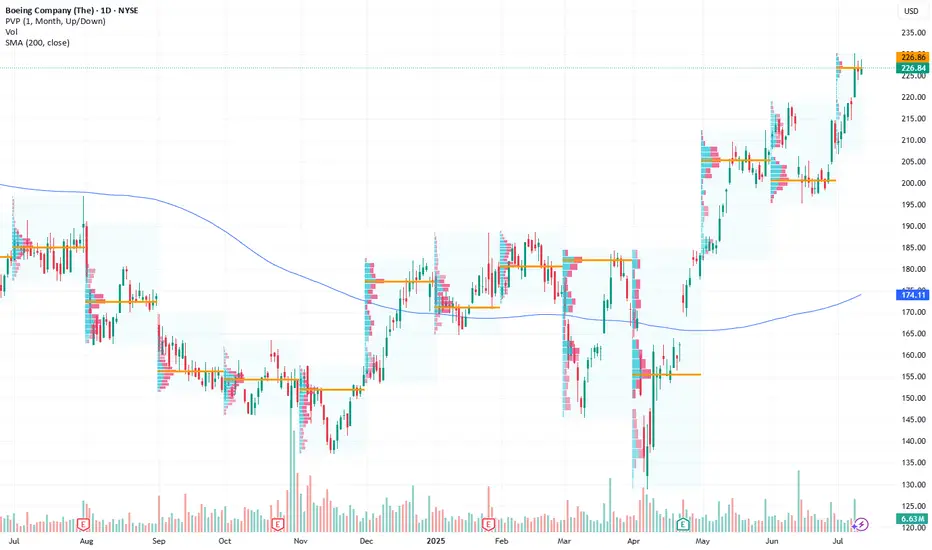
Long Opportunity: Boeing Could Take Flight Next WeekCurrent Price: $226.84
Direction: LONG
Targets:
- T1 = $233.00
- T2 = $238.00
Stop Levels:
- S1 = $223.00
- S2 = $218.00
**Wisdom of Professional Traders:**
This analysis synthesizes insights from thousands of professional traders and market experts, leveraging collective intelligence to identify high-probability trade setups. The wisdom of crowds principle suggests that aggregated market perspectives from experienced professionals often outperform individual forecasts, reducing cognitive biases and highlighting consensus opportunities in Boeing.
**Key Insights:**
Boeing continues to be a key player in the aerospace industry. Strong demand in its commercial airplane segments, coupled with resilient defense contracts, provides the company with stability. The ongoing recovery in airline travel globally adds further momentum to growth, presenting opportunities to capitalize on this positive outlook. Boeing's concerted efforts to address operational inefficiencies and ramp up production capacity also add value, particularly as the company pivots to meet increasing demand in the commercial aviation industry.
The aerospace giant has also benefited from favorable regulatory measures and accelerated demand recovery in Asia and Europe, key regions for international travel plays. Boeing's focus on ramping up production of the 737 MAX series while maintaining strong growth in its aftermarket services positions it for sustained revenue gains.
**Recent Performance:**
Boeing has demonstrated steady upward movement over recent sessions while largely consolidating within a tight technical range. Volumes have remained consistent, signaling sustained investor confidence despite broader market uncertainties. The current price action shows a favorable risk-to-reward setup approaching key resistance levels.
**Expert Analysis:**
Market sentiment remains optimistic due to strong tailwinds in the commercial aviation sector. Analysts point to Boeing's better-than-expected execution on fulfilling delayed orders, particularly for the 737 MAX. Despite concerns over persistent supply chain disruptions, experts note that Boeing's strategic partnerships and operational agility mitigate the long-term risks. Investors are encouraged by the company's forward guidance, although higher material costs remain a watch point for margins.
Technically, Boeing is testing critical resistance at $230. Analysts view a break of this region as a trigger for additional gains, leading to breakout opportunities toward the $240 level.
**News Impact:**
Boeing recently increased its production targets for 2024 and announced strategic moves to expand global service offerings. Positive sentiment surrounding favorable regulatory measures, coupled with improving demand for replacement planes and international travel, has boosted outlooks. Continued commitments from airline giants to upgrade fleets support robust future order flow.
**Trading Recommendation:**
A long position in Boeing at the current price of $226.84 targets a movement to $233.00 (T1) and $238.00 (T2). Stops should be placed at $223.00 (S1) and $218.00 (S2) to limit downside risks. This trade benefits from near-term positive catalysts, including volume consistency, strong market sentiment, and supportive global travel demand recovery.
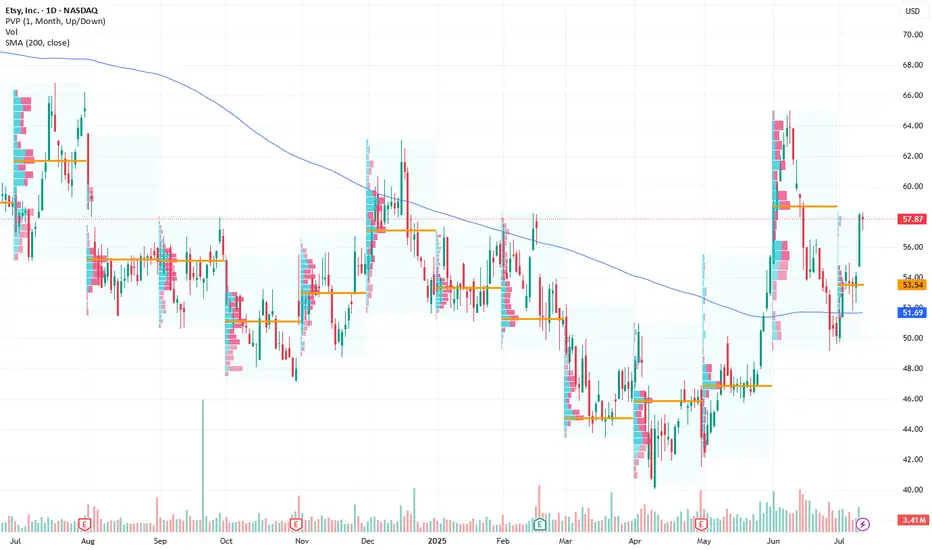
Etsy Positioned for a Strong Bullish Move Next WeekCurrent Price: $57.87
Direction: LONG
Targets:
- T1 = $60.50
- T2 = $64.00
Stop Levels:
- S1 = $56.00
- S2 = $54.50
**Wisdom of Professional Traders:**
This analysis synthesizes insights from thousands of professional traders and market experts, leveraging collective intelligence to identify high-probability trade setups. The wisdom of crowds principle suggests that aggregated market perspectives from experienced professionals often outperform individual forecasts, reducing cognitive biases and highlighting consensus opportunities in Etsy.
**Key Insights:**
Etsy has broken out of a descending wedge pattern, a bullish technical indicator that frequently signifies the end of a downturn and a shift in market sentiment. This breakout is complemented by a “golden cross” formation, where a short-term moving average crosses above its long-term counterpart, often associated with sustained bullish trends. These technical patterns, paired with increasing volume during the breakout, indicate growing investor confidence and the potential for significant upward momentum in the near term.
The company’s niche focus on craft-based e-commerce positions it well amid trends favoring small business support and unique products, adding further long-term growth potential. Recent volume-weighted metrics also show positive divergence, signaling underlying demand even during market-wide hesitations.
**Recent Performance:**
Etsy has recently recovered from a multi-month decline, trading at $57.87 after forming a strong support base around $54. This recovery has been marked by increasingly higher lows and higher highs, confirming the presence of an uptrend. The breakout from its descending wedge pattern was accompanied by above-average trading volume, underscoring market conviction in the move.
**Expert Analysis:**
Analysts are optimistic about the breakout’s implications, citing the combination of technical indicators that suggest Etsy is entering a bullish zone. A short-term target range between $60 and $64 aligns with Fibonacci retracement levels from prior downturns, while a long-term price objective could extend significantly higher if the upward trajectory sustains. The golden cross and robust RSI levels further validate a bullish stance, suggesting that momentum is far from peaking.
**News Impact:**
No major news headlines have directly driven Etsy’s recent movements, but broader macroeconomic factors, such as holiday season spending increases and potential improvements in consumer sentiment, could provide additional tailwinds. Furthermore, Etsy’s unique marketplace offering remains a draw for consumers even amid economic uncertainty, which could shield it from industry-specific headwinds.
**Trading Recommendation:**
With Etsy showing clear signs of bullish momentum and technical breakout patterns, a long position is recommended for traders seeking short- to medium-term gains. The initial target at $60.50 and the secondary target at $64.00 present attractive profit areas, while stop levels at $56.00 and $54.50 provide ample downside protection. This trade setup is supported by the confluence of technical signals, recent performance trends, and the company’s stable market positioning.
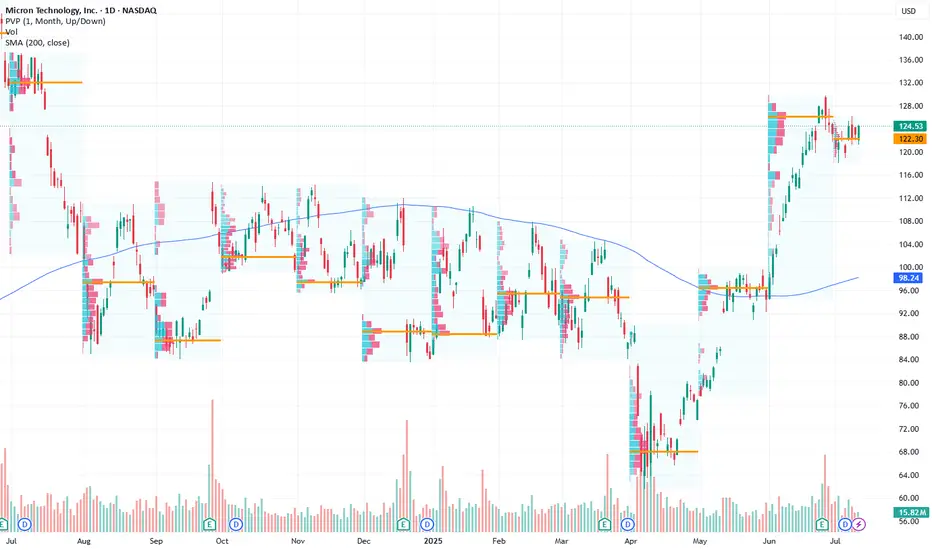
Micron Technology Inc.: Optimistic Long-Term Outlook Driven by ACurrent Price: $124.53
Direction: LONG
Targets:
- T1 = $128.50
- T2 = $130.00
Stop Levels:
- S1 = $123.00
- S2 = $120.00
**Wisdom of Professional Traders:**
This analysis synthesizes insights from thousands of professional traders and market experts, leveraging the collective intelligence to identify high-probability trade setups. The wisdom of crowds principle suggests that aggregated market perspectives from experienced professionals often outperform individual forecasts, reducing cognitive biases and highlighting consensus opportunities in Micron Technology Inc.
**Key Insights:**
Micron Technology Inc. (MU) remains a leading semiconductor company well-positioned to benefit from AI-driven demand for high-bandwidth memory, a key growth catalyst in the sector. Despite broader sector challenges with technical divergences, a break above the $130 resistance level could signal continued bullish momentum, while holding the $120 support level is critical to avoid triggering downside risks. Investors should carefully monitor price movements and geopolitical developments for directional cues.
**Recent Performance:**
Micron has traded within a tight range recently, reflecting a period of consolidation as investors weigh AI growth prospects against broader semiconductor market uncertainties. The stock has demonstrated notable relative strength, supported by positive macroeconomic trends. However, it remains vulnerable to external pressures, such as tariffs and concerns over China's economic stability.
**Expert Analysis:**
Industry experts project strong long-term demand for semiconductors driven by AI applications, with Micron benefiting from its leadership in memory technology. Optimism is underpinned by growing investments in data centers and cloud computing. Nevertheless, analysts urge caution due to potential near-term headwinds stemming from technical signals, geopolitical challenges, and macroeconomic factors such as demand fluctuations.
**News Impact:**
Reports of China's economic slowdown and upcoming policy decisions could significantly influence Micron’s short-term price movements. Additionally, developments related to tariffs and supply chain dynamics remain pivotal for assessing risks. The overarching AI growth story continues to be a key driver of optimism, which bolsters the long-term outlook for Micron’s growth narrative.
**Trading Recommendation:**
In light of Micron’s strong positioning in AI-driven markets, traders may consider a LONG position, with an entry at current levels ($124.53) and initial targets set at $128.50 and $130.00. Stops should be set conservatively at $123.00 and $120.00 to safeguard against downside risks. Carefully track any geopolitical or macroeconomic developments that might affect the broader semiconductor sector.
PayPal: Short Position Recommended as Bearish Divergence SignalsCurrent Price: $71.36
Direction: SHORT
Targets:
- T1 = $69.00
- T2 = $66.50
Stop Levels:
- S1 = $73.00
- S2 = $74.50
**Wisdom of Professional Traders:**
This analysis synthesizes insights from thousands of professional traders and market experts, leveraging collective intelligence to identify high-probability trade setups. The wisdom of crowds principle suggests that aggregated market perspectives from experienced professionals often outperform individual forecasts, reducing cognitive biases and highlighting consensus opportunities in PayPal.
**Key Insights:**
PayPal is currently showing bearish divergence on its technical charts. This pattern signals potential downward pressure in the near term, as momentum indicators weaken in alignment with subdued price action. Increased competition from fintech rivals like Stripe and Shopify, coupled with slowing transaction volume due to macroeconomic headwinds, further exacerbates the bearish outlook. Regulatory scrutiny over Buy Now Pay Later (BNPL) services and cryptocurrency initiatives has also dampened investor sentiment, adding to immediate challenges.
**Recent Performance:**
The stock has consistently underperformed relative to the broader market indices in recent weeks. Recent price movements indicate a lack of momentum, as resistance levels hold firm and sellers dominate. The fintech sector as a whole has struggled to regain investor confidence amid rising interest rates and overall market uncertainty.
**Expert Analysis:**
While PayPal remains a long-term innovator in digital payments with a diverse ecosystem including Venmo and other strategic assets, analysts have shifted focus to short-term concerns. Sizable growth in competition from nimble startups and well-funded businesses is eroding PayPal's market share. Additionally, its earnings growth has plateaued in recent quarters, with slowing active user growth underpinning these challenges. The stock's valuation appears stretched given the competitive pressures and an uncertain macroeconomic backdrop.
**News Impact:**
Recent developments, such as PayPal's exploration into blockchain initiatives and partnerships with global payment platforms, highlight its forward-thinking strategy. However, the immediate market reaction has been muted due to concerns over execution risk and the pace of e-commerce growth normalization post-pandemic. Until breakthrough results emerge from these initiatives, the short-term outlook remains bearish.
**Trading Recommendation:**
Given the bearish divergence and weak price momentum, a short position is recommended for PayPal at the current price of $71.36. A target of $69.00 (T1) and a secondary target of $66.50 (T2) provide lucrative reward potential. For risk management, place stops at $73.00 (S1) and $74.50 (S2). Traders should remain vigilant for any macroeconomic developments or earnings updates that could alter sentiment.

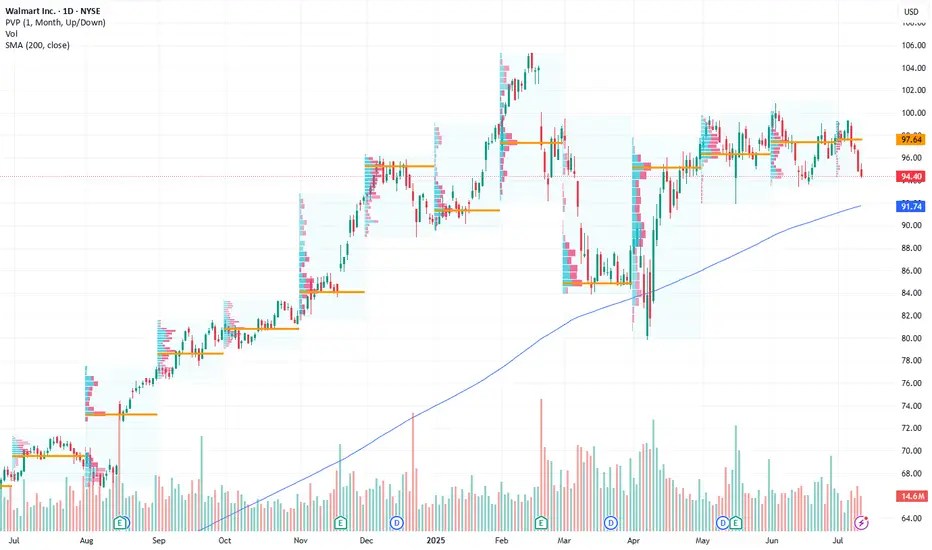
Walmart: Retail Giant Positioned for Growth Amid Bullish MomentuCurrent Price: $94.40
Direction: LONG
Targets:
- T1 = $98.20
- T2 = $101.80
Stop Levels:
- S1 = $92.10
- S2 = $90.40
**Wisdom of Professional Traders:**
This analysis synthesizes insights from thousands of professional traders and market experts, leveraging collective intelligence to identify high-probability trade setups. The wisdom of crowds principle suggests that aggregated market perspectives from experienced professionals often outperform individual forecasts, reducing cognitive biases and highlighting consensus opportunities in Walmart.
**Key Insights:**
Walmart continues to demonstrate resilience within the retail sector, benefiting from strong consumer spending trends. Its position at the 200-day simple moving average (SMA) indicates a key technical support level, providing investors with an attractive entry point for potential upside. As e-commerce gains momentum, Walmart’s operational strengths, bolstered by strategic pricing and logistics, emphasize its long-term growth potential. Consumer discretionary spending remains robust despite inflationary pressures, solidifying Walmart's steady trajectory.
The company's push into hybrid models of shopping, blending in-store and online experiences, has given it a significant edge over competitors. With strong leadership and strategic investments in technology and supply chain efficiencies, Walmart has proactively positioned itself for sustained profitability.
**Recent Performance:**
In recent sessions, Walmart’s price has shown resilience by maintaining stability at the $94 range, aligning closely with its 200-day SMA. Despite broader market volatility, bullish sentiment in the retail sector has supported investor confidence. Comparatively, Walmart has showcased better performance than many of its peers in controlling costs while expanding its digital footprint.
**Expert Analysis:**
Market experts view Walmart as a bellwether of the retail industry. Its ability to balance cost leadership with quality offerings underscores a competitive advantage. This analysis shows optimism for Walmart's e-commerce investments and operational efficiency. Technical indicators such as a narrowing Bollinger band suggest potential volatility expansion, which combined with recent upward price action, hints at possible bullish momentum. Indicators of increasing relative strength support the potential for breakout levels.
**News Impact:**
Retail activity has been positively influenced by consumer interest in savings-focused platforms, with Walmart emerging as a primary destination. Events like Amazon Prime Day indirectly bolster competition, driving visibility toward Walmart's comparable discount strategies. Additionally, Walmart's robust supply chain measures have ensured product availability, catering to high consumer expectations and supporting its market credibility.
**Trading Recommendation:**
With Walmart holding key technical support levels and benefiting from strong consumer trends, a long position appears substantiated. Traders should consider entering near the current price with stops placed below $92 for risk mitigation. Price targets at $98.20 and $101.80 reflect meaningful upside potential spurred by favorable market dynamics and Walmart’s strategic initiatives.
Shriram financeShowing bullish signal.
But there is resistance after 8 to 9%
So define your SL before leap into it.
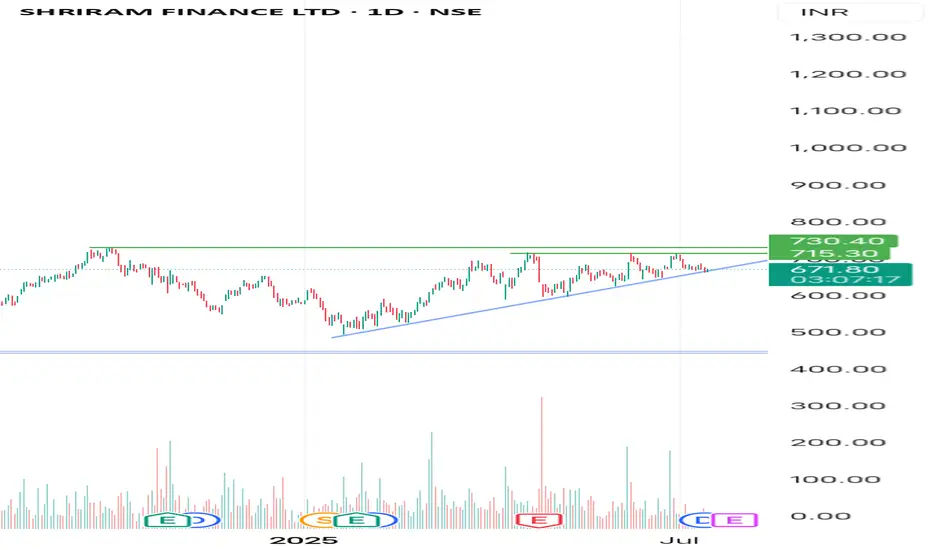
LongThis stock has broken its resistance level and trending with good volumes. We can take a swing trade in this stock with an SL of 6% and with target of 30%. Our profit and loss ratio is 1:5.
Points to remember:
* Take trade at current CMP.
* SL at point 1065.
* Target at point 1480.
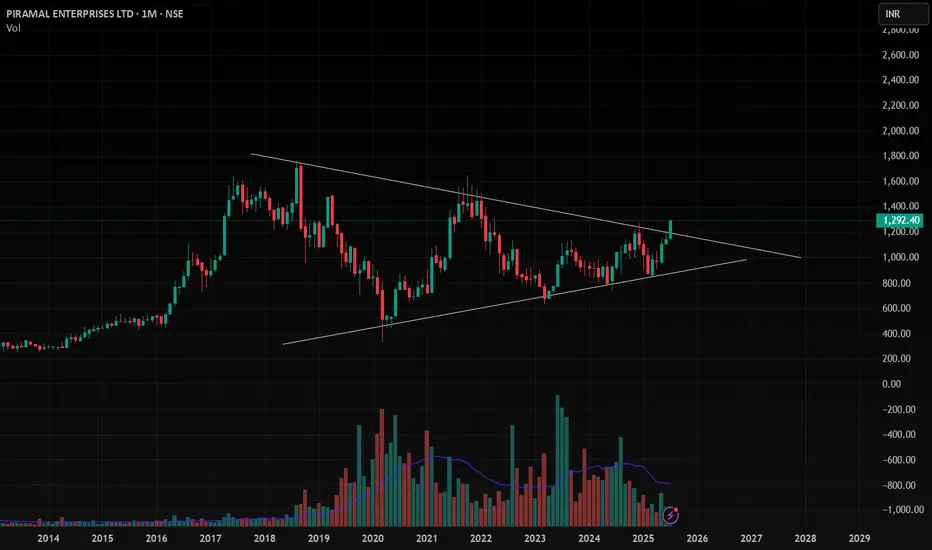
PEL , 1M , BullishThe Triangle Pattern is Breaking Out in Monthly Time Wait for Strong and Perfect close in Weekly Time and Enter after Confirmation .
Take Risk According to your capital
Follow for more ideas like this
PFC– At Resistance with Ascending Triangle PatternPower Finance Corporation (NSE: PFC) is forming a technically clean structure — trading within a rising trend channel and now testing a critical resistance zone around ₹430–₹440.
This is a make-or-break level, and the market could tip in either direction depending on how price reacts this week.
1. Chart Structure Overview
Support Zone: Defined by a rising green trendline connecting higher lows since March 2025.
Resistance Zone: Red band between ₹430–₹440, where price has previously reversed multiple times.
200 EMA (Blue Line): Currently hovering around ₹423, adding confluence as a dynamic support/resistance level.
This convergence makes the current price zone crucial for directional confirmation.
2. Two Trade Scenarios
Scenario 1: Bullish Breakout (Trend Continuation)
If the price breaks above ₹440 with strong bullish candles, traders can look for:
✅ Entry after a confirmed breakout + re-test of the ₹430–₹435 zone
🎯 Target Zones: ₹455, ₹470+
🛡️ Stop Loss: Below the swing low of the re-test (₹425 or as per price structure)
🔁 Risk/Reward: 1:2 or better
Scenario 2: Resistance Rejection (Short-Term Pullback)
If the price fails to break above ₹430–₹440 and shows reversal patterns:
✅ Entry on confirmation (e.g., bearish engulfing, rejection wick)
🎯 Target Zones: ₹410 (near rising trendline), possible extension to ₹400
🛡️ Stop Loss: Just above the resistance (~₹442–₹445)
🔁 Risk/Reward: 1:2 to 1:3 depending on entry
Thread>

“How Other People’s Fear Becomes Our Profit”From a behavioral and technical standpoint, LEVI presents a textbook short opportunity following its post-earnings overreaction. After a strong earnings beat, the stock surged over 13% intraday, reaching a high of $22.07. However, this rally quickly pushed RSI into overbought territory, triggering natural selling pressure. Much of this sell-off can be attributed to traders who previously bought near the $21–$22 range and are now looking to exit at breakeven—a classic example of loss aversion and anchoring bias. This emotional response often leads to temporary price spikes followed by sharp corrections. We are now observing that exact pattern, with the stock fading to $21.92 in after-hours and closing at $21.95, signaling buyer exhaustion.
Technically, this marks a short-term trend reversal—from bullish earnings momentum to a developing downtrend. The price action shows rejection at key resistance, weakening volume, and emotional exit zones being triggered. Now is a clean, high-probability shorting opportunity, with potential to capture 2–7% downside in the next 1–2 sessions, especially as the broader market reacts to inflated valuations and profit-taking behavior.

#DIXON - 4000 Pts move coming? 18246 or 9842.00?Date: 24-05-2025
#Dixon
Current Price: 14473
Pivot Point: 14044.00 Support: 13213.60 Resistance: 14882.04
Upside Targets:
Target 1: 15991.02
Target 2: 17100.00
Target 3: 18246.00
Target 4: 19392.00
Downside Targets:
Target 1: 12100.80
Target 2: 10988.00
Target 3: 9842.00
Target 4: 8696.00

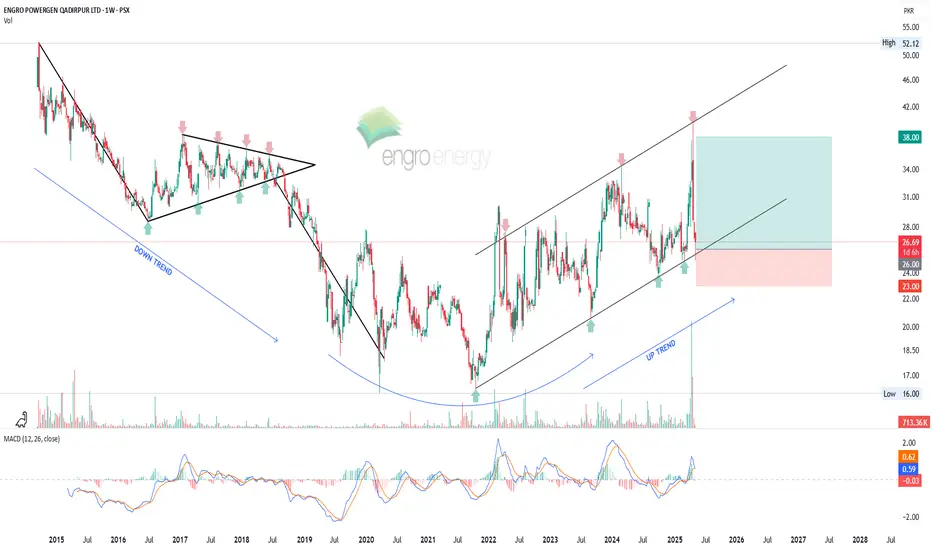
EPQL - Swing Trade SetupThe current price action is testing the support of an ascending parallel channel. A potential pullback from the 26 level, which aligns with the channel's support, is anticipated. If the price rebounds from this level, a swing trade setup could be confirmed, with a possible target of 38.
However, the MACD indicator has recently crossed over to the downside on weekly time frame, with red histograms forming. To confirm a more reliable entry point, we will await a reversal signal from the MACD indicator.
MSFT at Gamma Wall Crossroads–Will 506 Break This Time? July 14🧠 GEX and Options Sentiment (TanukiTrade GEX)
* GEX Zone Summary:
* 📈 Call Wall 1 (503.5–506.7) → major Gamma Resistance.
* 🧱 Gamma Wall (506.77) = Highest positive NETGEX — key sell zone for market makers.
* 🟢 GEX Flow: Moderate call dominance (1.95%) — not yet extreme bullish.
* 🟣 IVR 22.8 (low), IVX avg 25.2 – implied vol remains subdued.
* Options Suggestion:
* ⚠️ A move above 506.8 could trigger dealer hedging and gamma squeeze.
* Trade Idea (Bullish):
* Buy 510C or 515C (Jul 19/Jul 26 expiry) on breakout above 507 with volume.
* Stop: <503. Target: 512/516.
* 🚨 If rejection at Gamma Wall (506.8), fade the move:
* Trade Idea (Bearish):
* Buy 500P or 495P on rejection or candle close below 503.
* Target: 497.8 / 494. Stop: 506.5.
📉 1H Technical Trading Plan (Smart Money Concepts)
* Structure:
* Price made CHoCH → BOS toward 506 zone, now consolidating below resistance.
* Minor rejection seen from inside the purple supply box at 506.
* If bulls hold 501–503 zone, could be prepping a second push.
* Key Levels:
* Support: 501.48 / 497.78 / 494.11
* Resistance: 504.46 / 506.77
* Bias:
* 🟢 Bullish above 504.50, expecting breakout toward 510–512.
* 🔴 Bearish below 501.5, likely drop toward 497.8–495.
* Intraday Trading Setup:
* Scalp Long: Entry 504.5–505. Breakout candle confirmation.
* TP: 507. SL: 503.8
* Scalp Short: Entry <501.3
* TP: 498, SL: 503
* Swing Trade Scenario:
* Enter swing calls above 507. Hold for 515+ next week.
* Enter puts only if breakdown below 497.8 with CHoCH back down.
🎯 Final Thoughts:
MSFT is trading tightly below a significant GEX Call Wall, which often leads to a volatile breakout or strong rejection. If bulls push through 507+, we could see a sharp gamma squeeze into 510–515. However, if this fails, price may fade back toward 495–490 zone quickly. Patience at resistance is key.
Disclaimer: This analysis is for educational purposes only and does not constitute financial advice. Always do your own research and manage risk appropriately.

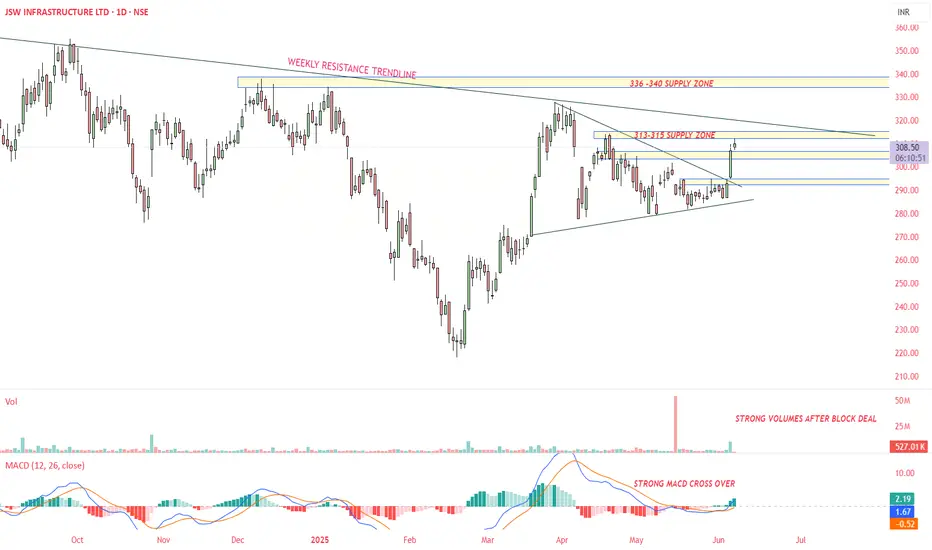
JSWINFRA - Daily time frame StudyFollowing are my Inputs for above chart reading -
1. MACD cross over
2. High volume Breakout of Symmetrical Triangle Pattern - Daily Time frame
3. It may go till weekly resistance line 330-340
This chart is only for educational purpose, Please contact your financial advisor for any trading or investment decisions.
PLTR at a Decision Point! for July 14GEX Walls and Wedge Breakdown Incoming?
🔸 GEX (Gamma Exposure) Breakdown for PLTR:
* Current Price: $141.99
* Key Gamma Resistance Zones:
* 📍 $145.15 – Highest Net Positive GEX (Gamma Wall)
* $144.58 – 2nd CALL Wall
* $146 – Overhead resistance from 2nd wall cluster
* Key Gamma Support Zones:
* $137 – HVL & 1st Put Layer
* $135 – 2nd Put Wall
* $132 – 3rd Put Wall
* $128.51 – GEX Low & Major Put Support
GEX Sentiment:
IVR: 39.3 (moderate)
IVx avg: 66.1
Options Flow Bias: CALL$ 56.7% – Slightly bullish
📈 Options Trade Strategy Based on GEX Zones:
🔹 Scenario A – Rejection from $145.15 (Most Probable):
* Bearish PUT Spread Play:
* Buy: $142.5 PUT
* Sell: $137 PUT (exp 7/19)
* Risk/Reward: Balanced downside toward HVL
* Trigger: If price stays below $142.5 and fails to reclaim $144.58
🔹 Scenario B – Breakout Above $145.15:
* Bullish CALL Play (speculative):
* Buy: $147.5 or $150 CALL
* Target: $155 (GEX9 zone)
* Only if: Price closes strongly above $145.5 on volume
🔸 GEX Outlook Summary:
* Upside capped at $146–$150 unless breakout volume enters
* Downside path to $135 / $132 is smoother if $140 breaks
* Gamma squeeze unlikely unless > $146
🧠 1-Hour Price Action & Intraday Trading Setup
⚙️ Market Structure:
* Trendline Support: Holding from recent rally
* CHoCH formed below resistance, suggesting a potential reversal
* BOS zone near $142.5–$144.6 creating supply
* Rising wedge breakdown forming
📊 Key Zones:
* Support: $140.53 (ascending trendline), then $137 (HVL)
* Resistance: $142.5 → $144.58 → $145.15
* Bearish Bias: As long as price is below $144.6
📉 Intraday Trading Plan (1H)
🔻 Short Setup:
* Entry: If price breaks below $140.50 with momentum
* TP1: $137
* TP2: $135
* Stop Loss: Above $144.60
🔼 Reversal Long (Less Probable):
* Entry: Break and hold above $145.15
* TP: $149.5 → $155
* SL: Below $143.5
🧭 Summary Thoughts:
* PLTR is sitting below strong GEX resistance with rising wedge weakness.
* Bearish structure forming unless bulls reclaim $145+ quickly.
* Favor PUT plays targeting $137–$135 unless breakout proves otherwise.
Disclaimer: This analysis is for educational purposes only and does not constitute financial advice. Always manage risk and do your own due diligence before trading.

NAVINFLOUR BROKEN ATHNavin flour has broken ATH and looks like a rounding bottom
with very minimum risk with stop of close below 4800 one can go long with target of 6800

TSLA / Earning seasonNASDAQ:TSLA showing nice price action bounce off the base last week. With earnings season here, watch the $315 level — a breakout could send it toward $320 and $326 next 🚀📈 #TSLA

