PROTECTED SOURCE SCRIPT
Updated Support and Resistance Lines [Swastik]
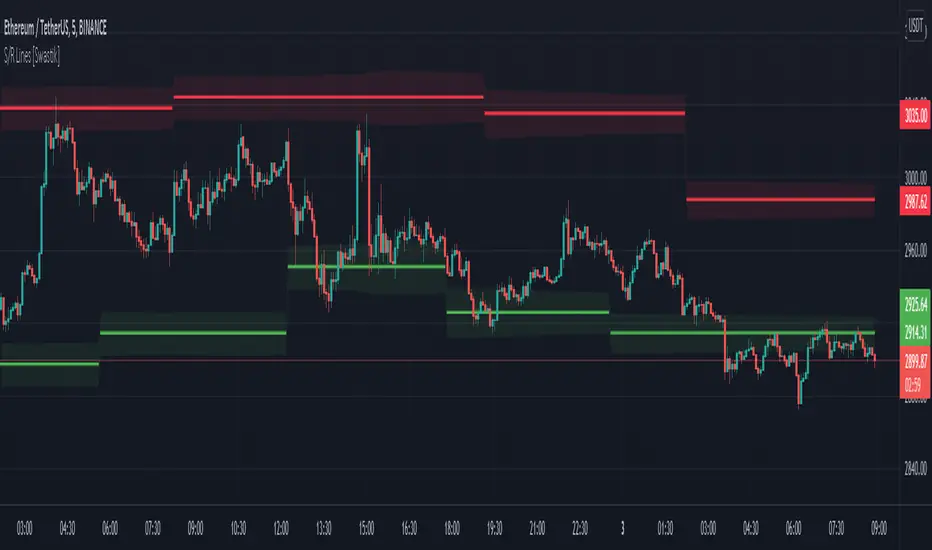
This indicator plots support and resistance lines automatically on the basis of the pivots created by the swings in the market.
You can increase the swing sensitivity if you want it to detect only larger swings.
There is a range drawn around the support and resistance lines based on the volatility of the market.
This works on every timeframe and the lines are drawn on the basis of swings in that timeframe.
This does not repaints and you can use it freely.
Release Notes
Added the alert conditions for crossing of the Support and Resistance LinesProtected script
This script is published as closed-source. However, you can use it freely and without any limitations – learn more here.
Disclaimer
The information and publications are not meant to be, and do not constitute, financial, investment, trading, or other types of advice or recommendations supplied or endorsed by TradingView. Read more in the Terms of Use.
Protected script
This script is published as closed-source. However, you can use it freely and without any limitations – learn more here.
Disclaimer
The information and publications are not meant to be, and do not constitute, financial, investment, trading, or other types of advice or recommendations supplied or endorsed by TradingView. Read more in the Terms of Use.