OPEN-SOURCE SCRIPT
Updated Ice Cream Volume Profile [Visible range]
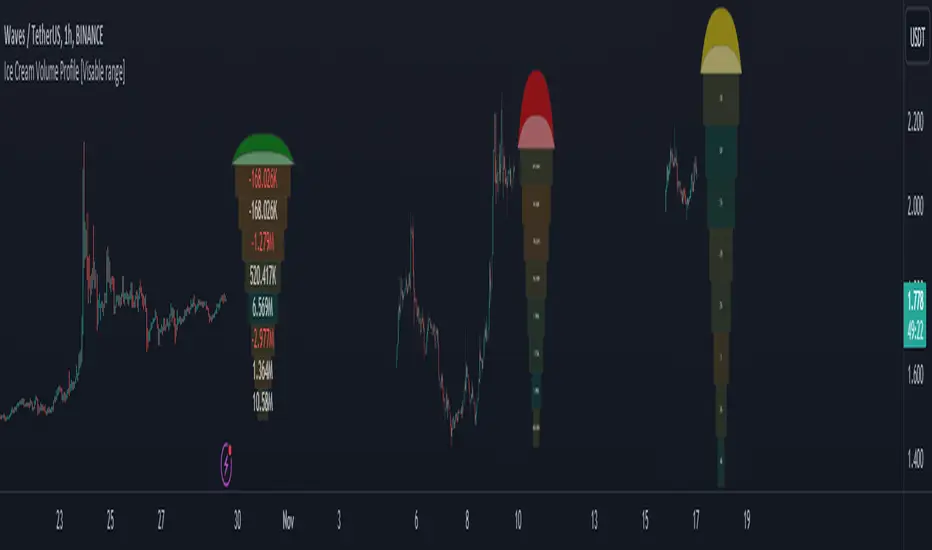
While exploring the new Pine Script feature, Polylines, I've created a fun project called the
Ice Cream Volume Profile for the visible range.
This fun project serves several purposes:
The top part of the ice cream cone changes color as follows:
Polylines are an excellent feature that enables us to create even more intriguing visuals in Pine Script.
Ice Cream Volume Profile for the visible range.
This fun project serves several purposes:
It displays the level at which the most trades (volume) occur.
It provides Delta volume information.
It counts how many times a bar closed within this level.
It assists in drawing support and resistance zones.
It aids in interpreting volume data.
The top part of the ice cream cone changes color as follows:
- Green: When the bullish volume exceeds 55% of the total volume.
- Red: When the bearish volume surpasses 55% of the total volume.
- Yellow: When neither Green nor Red exceeds 55% of the total volume.
Polylines are an excellent feature that enables us to create even more intriguing visuals in Pine Script.
Release Notes
Minor name changeOpen-source script
In true TradingView spirit, the creator of this script has made it open-source, so that traders can review and verify its functionality. Kudos to the author! While you can use it for free, remember that republishing the code is subject to our House Rules.
Links : linktr.ee/tzacks
Disclaimer
The information and publications are not meant to be, and do not constitute, financial, investment, trading, or other types of advice or recommendations supplied or endorsed by TradingView. Read more in the Terms of Use.
Open-source script
In true TradingView spirit, the creator of this script has made it open-source, so that traders can review and verify its functionality. Kudos to the author! While you can use it for free, remember that republishing the code is subject to our House Rules.
Links : linktr.ee/tzacks
Disclaimer
The information and publications are not meant to be, and do not constitute, financial, investment, trading, or other types of advice or recommendations supplied or endorsed by TradingView. Read more in the Terms of Use.