INVITE-ONLY SCRIPT
TM24_INTRADAY_SWING_TOOL_SPECIAL
Updated

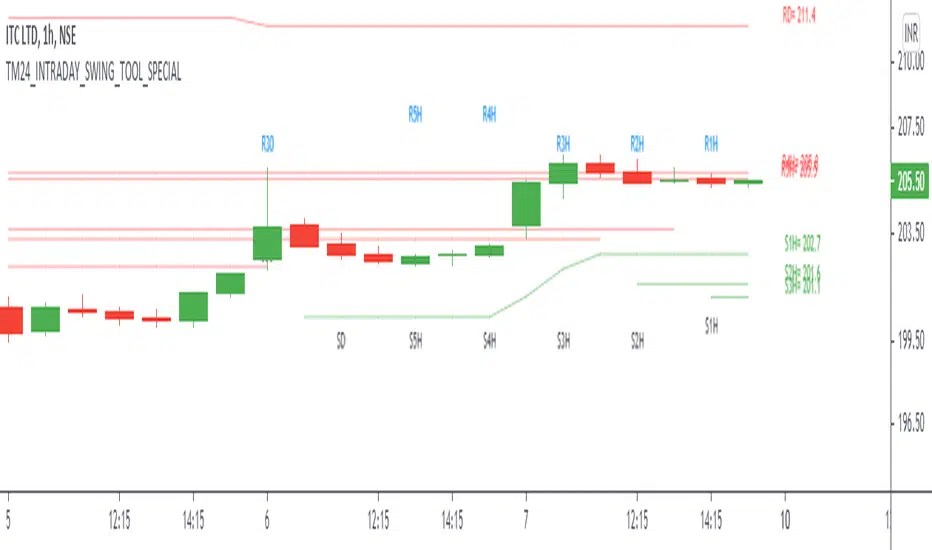
TM24_INTRADAY_SWING_TOOL_SPECIAL helps to identify following Things for Intraday-Swing Position on 5- 60 Minutes + timeframe along with Trend, Support , resistance , reversal and Breakout levels.
1. Market Trend (Different Timeframe)
2. Price Direction
3. Area of Support & Resistance
4. Price Momentum
Terminology Use ==> Red for downtrend and green for uptrend on that timeframe
Display and Interpretation ==> Buy Sale Signal with breakout 5-10-15-30-60-D-W-M for different time frames.
any value signal ending with * shows breakout of support/ resistance and value signal starting with * shows entry to a momentum zone.
Use market structure, chart pattern, trend lines for more support..
Time frame ==> Use proper Signal with 60 minute or daily time frame
What to Identify ==> Overall Trend for the Swing
How to Use ==>
See how and order buildup is seen and current order position. Also area for volatility and expected movement in price direction
Note: - Use market structure, chart pattern, trend lines and price action parameter for more confirmation.
Entry ==>
Let’s wait the proper area of support or resistance ( Area of Value in case of trend pattern use)
Exit ==>
SL of swing high/low out of market structure with proper risk management and target with proper Risk/ Reward Ratio
Use the Below Contacts to Access this Indicator
Release Notes
UpdatesRelease Notes
UpdateRelease Notes
UpdateRelease Notes
UpdateRelease Notes
UpdatesRelease Notes
UpdatesRelease Notes
UpdateRelease Notes
UpdatesRelease Notes
UpdateRelease Notes
UpdatesRelease Notes
UpdatesRelease Notes
UpdatesRelease Notes
UpdatesRelease Notes
UpdatesRelease Notes
UpdatesRelease Notes
UpdatesRelease Notes
UpdatesRelease Notes
UpdatesRelease Notes
UpdatesRelease Notes
UpdatesRelease Notes
UpdatesInvite-only script
Access to this script is restricted to users authorized by the author and usually requires payment. You can add it to your favorites, but you will only be able to use it after requesting permission and obtaining it from its author. Contact TradingMind24 for more information, or follow the author's instructions below.
TradingView does not suggest paying for a script and using it unless you 100% trust its author and understand how the script works. In many cases, you can find a good open-source alternative for free in our Community Scripts.
Author's instructions
″Regards
Trading Mind
Use the Below Contacts to Access this Indicator
Contact Form:-https://forms.gle/qwStQRp7hvv98D4g8
Email Us- tradingmind24@gmail.com
Whatsapp :- +91-
Telegram:- https://t.me/tradingmind24
Want to use this script on a chart?
Warning: please read before requesting access.
Disclaimer
The information and publications are not meant to be, and do not constitute, financial, investment, trading, or other types of advice or recommendations supplied or endorsed by TradingView. Read more in the Terms of Use.