PROTECTED SOURCE SCRIPT
Updated Expected Move Bands
Expected Moves
The Expected Move of a security shows the amount that a stock is expected to rise or fall from its current market price based on its level of volatility or implied volatility. The expected move of a stock is usually measured with standard deviations.
An Expected Move Range of 1 SD shows that price will be near the 1 SD range 68% of the time given enough samples.
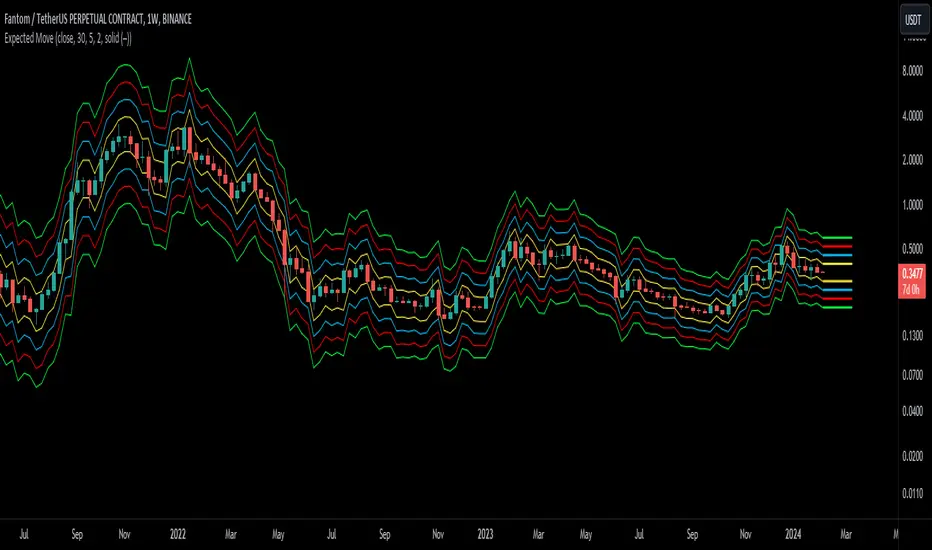
Expected Move Bands
This indicator gets the Expected Move for 1-4 Standard Deviation Ranges using Historical Volatility. Then it displays it on price as bands.
The Expected Move indicator also allows you to see MTF Expected Moves if you want to.
This indicator calculates the expected price movements by analyzing the historical volatility of an asset. Volatility is the measure of fluctuation.
This script uses log returns for the historical volatility calculation which can be modelled as a normal distribution most of the time meaning it is symmetrical and stationary unlike other scripts that use bands to find "reversals". They are fundamentally incorrect.
What these ranges tell you is basically the odds of the price movement being between these levels.
If you take enough samples, 95.5% of the them will be near the 2nd Standard Deviation. And so on. (The 3rd Standard deviation is 99.7%)
For higher timeframes you might need a smaller sample size.
Features


The Expected Move of a security shows the amount that a stock is expected to rise or fall from its current market price based on its level of volatility or implied volatility. The expected move of a stock is usually measured with standard deviations.
An Expected Move Range of 1 SD shows that price will be near the 1 SD range 68% of the time given enough samples.
Expected Move Bands
This indicator gets the Expected Move for 1-4 Standard Deviation Ranges using Historical Volatility. Then it displays it on price as bands.
The Expected Move indicator also allows you to see MTF Expected Moves if you want to.
This indicator calculates the expected price movements by analyzing the historical volatility of an asset. Volatility is the measure of fluctuation.
This script uses log returns for the historical volatility calculation which can be modelled as a normal distribution most of the time meaning it is symmetrical and stationary unlike other scripts that use bands to find "reversals". They are fundamentally incorrect.
What these ranges tell you is basically the odds of the price movement being between these levels.
If you take enough samples, 95.5% of the them will be near the 2nd Standard Deviation. And so on. (The 3rd Standard deviation is 99.7%)
For higher timeframes you might need a smaller sample size.
Features
- MTF Option
- Parameter customization
Release Notes
Improved the volatility calculations.Protected script
This script is published as closed-source. However, you can use it freely and without any limitations – learn more here.
Link Tree: linktr.ee/tradersendeavors
Access our indicators: patreon.com/user?u=80987417
Access our indicators: patreon.com/user?u=80987417
Disclaimer
The information and publications are not meant to be, and do not constitute, financial, investment, trading, or other types of advice or recommendations supplied or endorsed by TradingView. Read more in the Terms of Use.
Protected script
This script is published as closed-source. However, you can use it freely and without any limitations – learn more here.
Link Tree: linktr.ee/tradersendeavors
Access our indicators: patreon.com/user?u=80987417
Access our indicators: patreon.com/user?u=80987417
Disclaimer
The information and publications are not meant to be, and do not constitute, financial, investment, trading, or other types of advice or recommendations supplied or endorsed by TradingView. Read more in the Terms of Use.