BBPct FL Impulse [BackQuant]
Introducing BackQuant's BBPct FL Impulse — a powerful and unique trading indicator designed to detect impulse moves and exhaustion points in the market. This leading indicator combines Bollinger Band Percentage (BBPct) calculations with a for-loop system to generate clear long and short signals. Additionally, it plots support and resistance exhaustion levels directly on the chart, providing traders with a visual representation of key market levels.
The BBPct FL Impulse is designed for traders who want to anticipate price movements rather than react to lagging indicators. By utilizing the Bollinger Band Percentage, this indicator identifies moments when the price is pushing toward extremes, signaling the likelihood of impulse moves. It goes a step further by providing exhaustion levels where the market may reverse or pause, helping traders identify potential entries and exits.
Core Concept: Bollinger Band Percentage (BBPct)
The BBPct is the primary calculation driving this indicator. It measures where the price is relative to its Bollinger Bands, allowing traders to gauge overbought or oversold conditions. Bollinger Bands are a well-known tool used to define high and low points based on standard deviation from a moving average. The BBPct takes this one step further by showing how far the price is within the bands, as a percentage.
In this script, the BBPct is calculated using the closing price over a customizable BBPct Length (default set to 70) and a Multiplier that defines the width of the bands based on standard deviation. This helps detect when price pushes toward its upper or lower boundaries, indicating potential breakouts or pullbacks.
For-Loop Scoring Mechanism
The for-loop scoring system adds a layer of sophistication to this indicator. It evaluates the BBPct over a range of periods (defined by the Start and End parameters) and generates a score that measures the direction and strength of the price movement.
Long Signals: A long signal is triggered when the score surpasses the Long Threshold (default set at 40), indicating a strong bullish impulse.
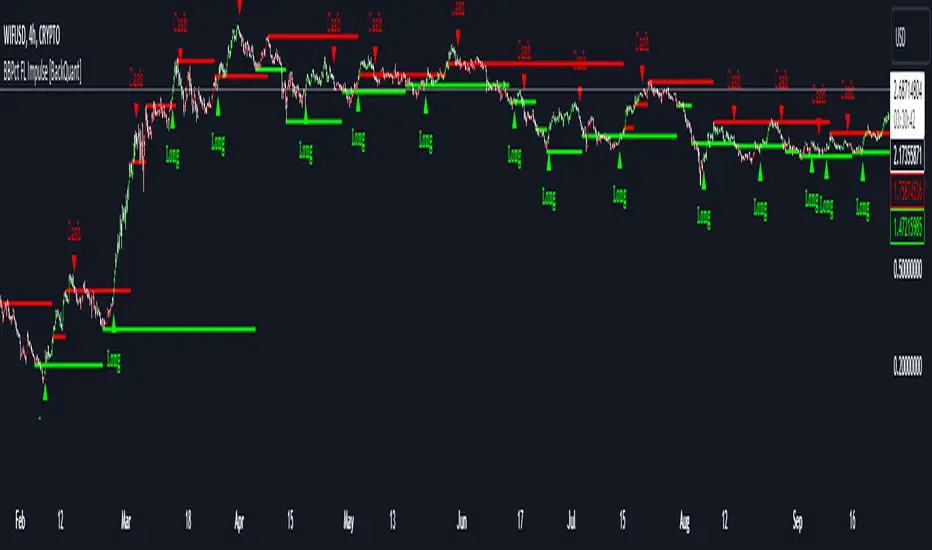
Short Signals: A short signal (labeled as "Cash" in this script) is triggered when the score crosses under the Short Threshold (default set at -10), suggesting the price has lost momentum and a bearish move may be coming.
These signals are highlighted on the chart with green triangles for Long and red triangles for Cash, giving traders clear visual cues for potential buy and sell points.
Key Feature: Exhaustion Levels (Support and Resistance)
One of the standout features of this script is the automatic plotting of Exhaustion Support and Resistance Levels. These levels represent points in the market where the price is likely to exhaust its movement and potentially reverse.
Support is plotted when the price shows signs of bullish exhaustion (low price points).
Resistance is plotted when the price shows signs of bearish exhaustion (high price points).
This dynamic support and resistance system uses a custom function based on price swings, analyzing exhaustion patterns to detect significant levels. The indicator allows traders to visualize key market zones where potential reversals or slowdowns may occur, helping to refine trade entries and exits.
Customization & Visualization
This indicator comes with a range of customizable settings, giving traders full control over how the signals are generated and displayed on the chart:
Calculation Source: Choose the price data used for the BBPct calculation (default is the closing price).
BBPct Length: Set the lookback period for the BBPct calculation, adjusting how smooth or reactive the indicator is to price changes.
Multiplier: Adjust the multiplier for the Bollinger Band calculation, controlling how wide or narrow the bands are and thereby affecting sensitivity.
Thresholds for Signals: Customize the thresholds for long and short signals, allowing you to fine-tune the sensitivity to different market conditions.
Show Long and Cash Signals: Toggle the display of long and short signals on the chart.
Exhaustion Levels: Toggle the display of support and resistance levels, adjusting the length of swings and the thickness of the lines to suit your preferences.
Trading Applications
The BBPct FL Impulse indicator is a versatile tool designed to help traders identify impulse moves and exhaustion points. Some of its key applications include:
Breakout Trading: By using the BBPct to detect when price moves toward the extremes of the Bollinger Bands, traders can anticipate potential breakouts and catch the beginning of strong price moves.
Reversal Trading: The exhaustion support and resistance levels provide key areas where price may reverse, allowing reversal traders to identify potential entries as the market shows signs of exhaustion.
Trend Following: The for-loop scoring system helps quantify the strength of price moves, enabling trend-following traders to stay in winning trades as long as the impulse remains strong.
Risk Management: By providing clear support and resistance levels, the indicator helps traders manage risk more effectively by highlighting zones where price may pause or reverse, allowing for better stop-loss placement.
Final Thoughts
The BBPct FL Impulse [BackQuant] is an advanced indicator that combines the precision of Bollinger Band Percentage calculations with the power of a for-loop scoring system and dynamic exhaustion levels. Whether you're looking to trade breakouts, reversals, or trends, this indicator offers the tools to help you make informed decisions in the market.
As always, it's important to backtest the indicator and adapt it to your specific trading style and market. No indicator is infallible, and it should be used as part of a broader trading strategy that includes sound risk management practices.
Invite-only script
Only users approved by the author can access this script. You'll need to request and get permission to use it. This is typically granted after payment. For more details, follow the author's instructions below or contact BackQuant directly.
TradingView does NOT recommend paying for or using a script unless you fully trust its author and understand how it works. You may also find free, open-source alternatives in our community scripts.
Author's instructions
Warning: please read our guide for invite-only scripts before requesting access.
Disclaimer
Invite-only script
Only users approved by the author can access this script. You'll need to request and get permission to use it. This is typically granted after payment. For more details, follow the author's instructions below or contact BackQuant directly.
TradingView does NOT recommend paying for or using a script unless you fully trust its author and understand how it works. You may also find free, open-source alternatives in our community scripts.
Author's instructions
Warning: please read our guide for invite-only scripts before requesting access.