PROTECTED SOURCE SCRIPT
Updated Dollar Cost Averaging Only Red Candles
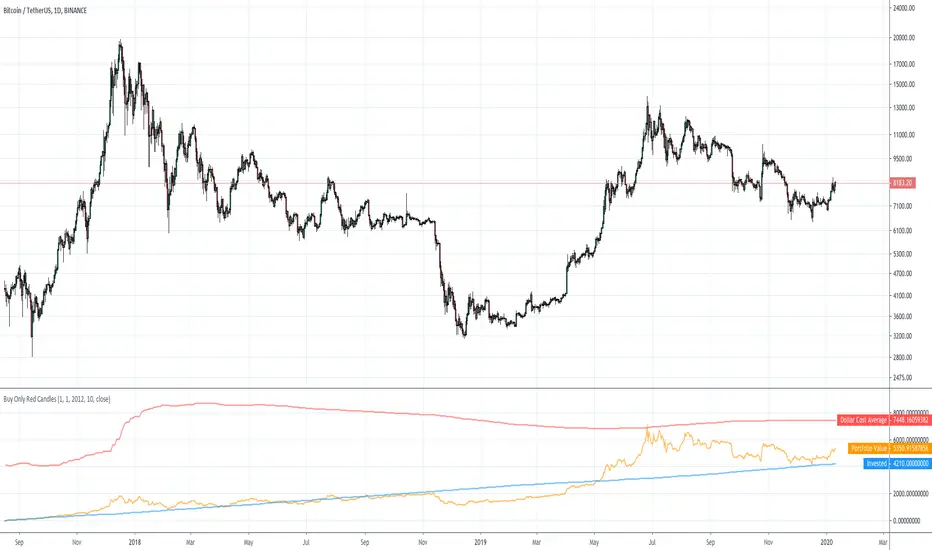
This just shows you the results if, for example, you bought the closing price each day that formed a red candle.
Works on other timeframes than daily.
In the options you can set your own start date, as well as the dollar amount to spend on each buy.
Displays your dollar cost average, total invested, and total portfolio value over time.
Works on other timeframes than daily.
In the options you can set your own start date, as well as the dollar amount to spend on each buy.
Displays your dollar cost average, total invested, and total portfolio value over time.
Release Notes
Fixed some problems, plus added an option in the settings to choose your source (open, close, low, high, etc).Protected script
This script is published as closed-source. However, you can use it freely and without any limitations – learn more here.
Disclaimer
The information and publications are not meant to be, and do not constitute, financial, investment, trading, or other types of advice or recommendations supplied or endorsed by TradingView. Read more in the Terms of Use.
Protected script
This script is published as closed-source. However, you can use it freely and without any limitations – learn more here.
Disclaimer
The information and publications are not meant to be, and do not constitute, financial, investment, trading, or other types of advice or recommendations supplied or endorsed by TradingView. Read more in the Terms of Use.