OPEN-SOURCE SCRIPT
Updated RSI Candles [cI8DH]
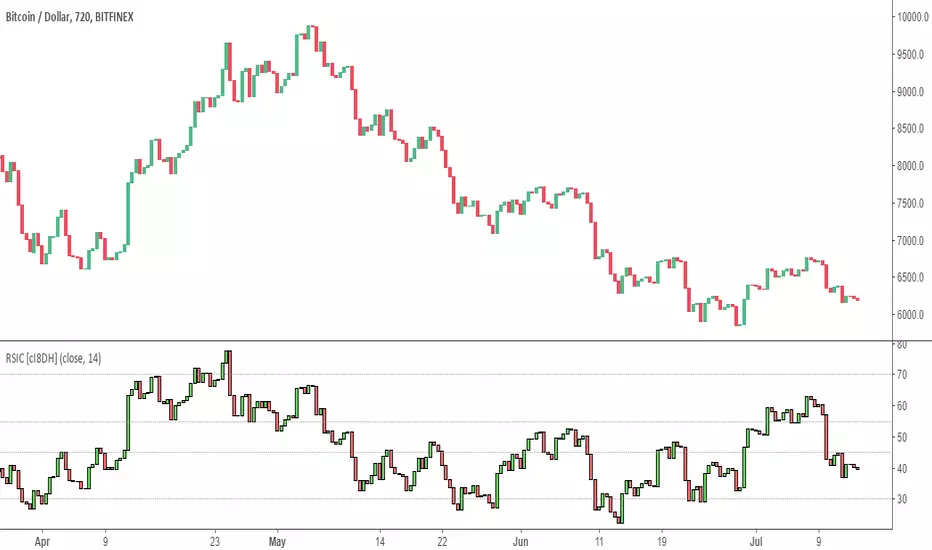
This is candle visualization of regular RSI. That's all.
I have seen two other RSI candles, but their implementation is not correct. The high on RSI usually matches the low on price and vice versa. I have completely turned off the wicks so you can safely use this indicator as a replacement for regular RSI.
I have seen two other RSI candles, but their implementation is not correct. The high on RSI usually matches the low on price and vice versa. I have completely turned off the wicks so you can safely use this indicator as a replacement for regular RSI.
Release Notes
added a band as requested by my friendRelease Notes
- Added dynamic inner band that can be used during sideways periods- Implemented the True RSI fix explained here
![True Relative Strength Index (True RSI / TRSI) [cI8DH]](https://s3.tradingview.com/k/kfFjkxCa_mid.png)
Release Notes
- added standard deviation inner band calculation methodRelease Notes
- minor code optimizationOpen-source script
In true TradingView spirit, the creator of this script has made it open-source, so that traders can review and verify its functionality. Kudos to the author! While you can use it for free, remember that republishing the code is subject to our House Rules.
Disclaimer
The information and publications are not meant to be, and do not constitute, financial, investment, trading, or other types of advice or recommendations supplied or endorsed by TradingView. Read more in the Terms of Use.
Open-source script
In true TradingView spirit, the creator of this script has made it open-source, so that traders can review and verify its functionality. Kudos to the author! While you can use it for free, remember that republishing the code is subject to our House Rules.
Disclaimer
The information and publications are not meant to be, and do not constitute, financial, investment, trading, or other types of advice or recommendations supplied or endorsed by TradingView. Read more in the Terms of Use.