OPEN-SOURCE SCRIPT
Correlation
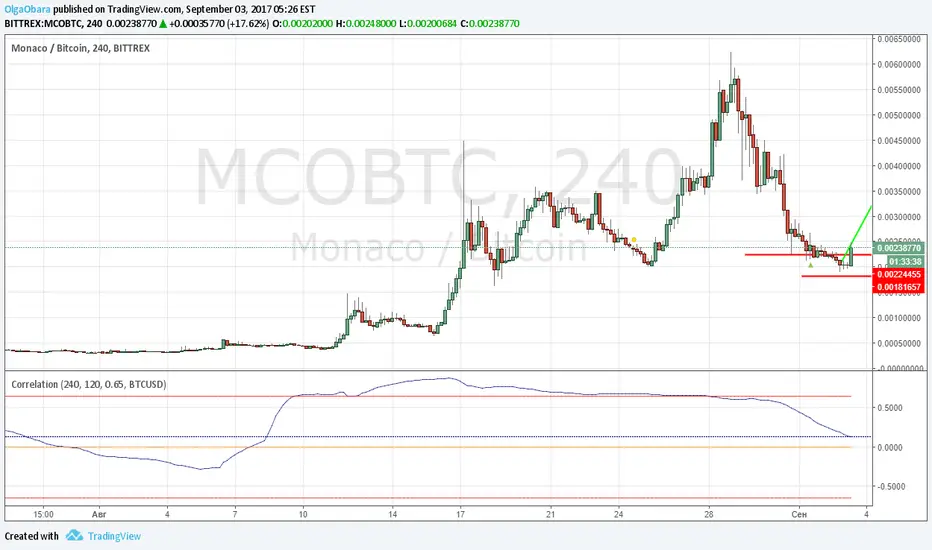
Graph shows level of correlation between current source and another one and track current value of it. User can select source for comparison, graph period and number of candles for calculation, enter level of significal correlation (+-0.65 by default). Grapf contains 4 plots: Correlation - current level of correlation, Zero line , +Corr_level - minimum level of significant positive correlation, -Corr_level -maximum level of significant negative correlation between 2 sources.
Open-source script
In true TradingView spirit, the creator of this script has made it open-source, so that traders can review and verify its functionality. Kudos to the author! While you can use it for free, remember that republishing the code is subject to our House Rules.
Disclaimer
The information and publications are not meant to be, and do not constitute, financial, investment, trading, or other types of advice or recommendations supplied or endorsed by TradingView. Read more in the Terms of Use.