OPEN-SOURCE SCRIPT
Updated VAMA - Volume Adjusted Moving Average [jpkxyz]
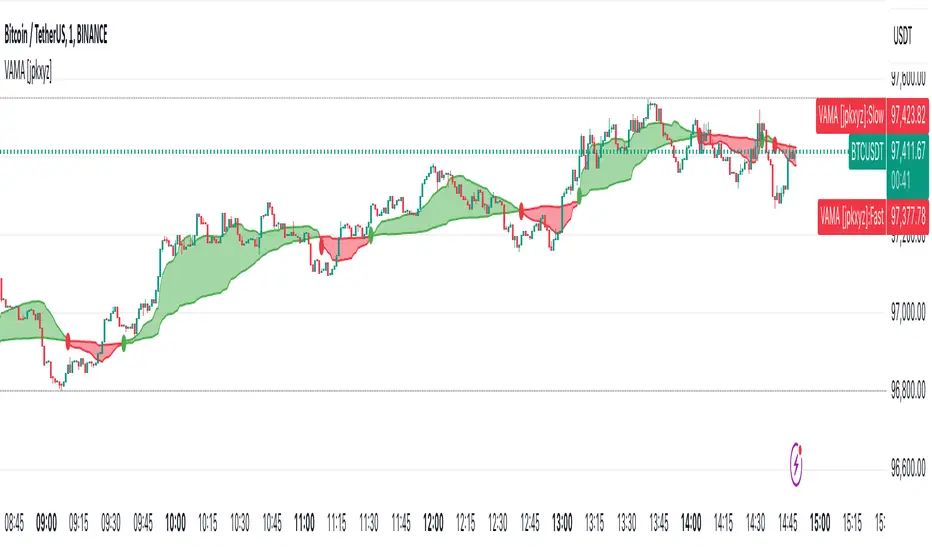
VAMA is a moving average that adapts to volume, giving more weight to price movements backed by higher relative volume. This VAMA (Volume Adjusted Moving Average) indicator implementation emphasizes visual clarity. It is based on the VAMA script by allanster
Dual VAMA lines (Fast/Slow) with dynamic coloring:
Single-color scheme switches between green (bullish) and red (bearish)
Color changes on crossovers rather than relative position
Configurable line widths (set to 1 for clean appearance)
Visual enhancements:
Optional fill between VAMA lines (50% transparency)
Crossover dots can be toggled
Fills and dots match the current trend color
Customization parameters:
Independent source inputs for Fast/Slow lines
Adjustable VI Factor (volume influence)
Sample size control
Strict/non-strict calculation toggle
The code maintains efficient computation while prioritizing visual feedback for trend changes. It's designed for clear signal identification without visual clutter.
Notable style choices:
Consistent color theming throughout all visual elements
Simplified color transitions (only at crossovers)
Subtle transparency for fill areas
Minimal dot size for crossover markers
VAMA (Volume Adjusted Moving Average) Technical Analysis:
Core Calculation:
1. Volume Influence (v2i):
Pine Script®
- total_volume: Sum of volume over sample period
- total_periods: Either full history (nvb=0) or specified sample size
- volume_factor: Controls sensitivity to volume deviation
2. Price Weighting:
Pine Script®
3. Accumulation Process:
- Iterates through length*10 periods
- Accumulates weighted prices and volume influence values
- Continues until volume influence sum >= specified length or strict rule triggers
4. Final VAMA Value:
Pine Script®
Parameters:
- SampleN: Historical reference length (0=full history)
- Length: Base period for calculation
- VI Factor: Volume influence multiplier (>0.01)
- Strict: Forces exact length period completion when true
- Source: Input price data
Dual VAMA lines (Fast/Slow) with dynamic coloring:
Single-color scheme switches between green (bullish) and red (bearish)
Color changes on crossovers rather than relative position
Configurable line widths (set to 1 for clean appearance)
Visual enhancements:
Optional fill between VAMA lines (50% transparency)
Crossover dots can be toggled
Fills and dots match the current trend color
Customization parameters:
Independent source inputs for Fast/Slow lines
Adjustable VI Factor (volume influence)
Sample size control
Strict/non-strict calculation toggle
The code maintains efficient computation while prioritizing visual feedback for trend changes. It's designed for clear signal identification without visual clutter.
Notable style choices:
Consistent color theming throughout all visual elements
Simplified color transitions (only at crossovers)
Subtle transparency for fill areas
Minimal dot size for crossover markers
VAMA (Volume Adjusted Moving Average) Technical Analysis:
Core Calculation:
1. Volume Influence (v2i):
v2i = volume / ((total_volume/total_periods) * volume_factor)
- total_volume: Sum of volume over sample period
- total_periods: Either full history (nvb=0) or specified sample size
- volume_factor: Controls sensitivity to volume deviation
2. Price Weighting:
weighted_price = source_price * v2i
3. Accumulation Process:
- Iterates through length*10 periods
- Accumulates weighted prices and volume influence values
- Continues until volume influence sum >= specified length or strict rule triggers
4. Final VAMA Value:
vama = (weighted_sum - (volume_sum - length) * last_price) / length
Parameters:
- SampleN: Historical reference length (0=full history)
- Length: Base period for calculation
- VI Factor: Volume influence multiplier (>0.01)
- Strict: Forces exact length period completion when true
- Source: Input price data
Release Notes
VAMA Indicator Update: Multi-Timeframe SupportThis update introduces multi-timeframe analysis capabilities while preserving the core VAMA calculation.
What's New
The indicator now includes a Timeframe input field that allows you to view VAMA calculations from higher timeframes while trading on lower timeframe charts. For example, you can now see 1-hour VAMA signals while trading on a 5-minute chart, helping you align your short-term trades with longer-term trends.
How It Works
The indicator performs the VAMA calculation on your selected higher timeframe and projects those values onto your current chart timeframe. This means the VAMA values will update when the higher timeframe candle closes, providing clean, uncluttered signals based on completed candles.
Technical Notes
This update maintains full backward compatibility. If no timeframe is selected, the indicator behaves exactly as it did in previous versions. The core VAMA calculation remains unchanged, ensuring consistency with your existing trading strategies.
Release Notes
Cleaned and updated the displayed chart and linked a "How-To". Open-source script
In true TradingView spirit, the creator of this script has made it open-source, so that traders can review and verify its functionality. Kudos to the author! While you can use it for free, remember that republishing the code is subject to our House Rules.
Disclaimer
The information and publications are not meant to be, and do not constitute, financial, investment, trading, or other types of advice or recommendations supplied or endorsed by TradingView. Read more in the Terms of Use.
Open-source script
In true TradingView spirit, the creator of this script has made it open-source, so that traders can review and verify its functionality. Kudos to the author! While you can use it for free, remember that republishing the code is subject to our House Rules.
Disclaimer
The information and publications are not meant to be, and do not constitute, financial, investment, trading, or other types of advice or recommendations supplied or endorsed by TradingView. Read more in the Terms of Use.