PROTECTED SOURCE SCRIPT
Updated Relative Vigor Index [MTF] with MACD, Divergence and Alerts
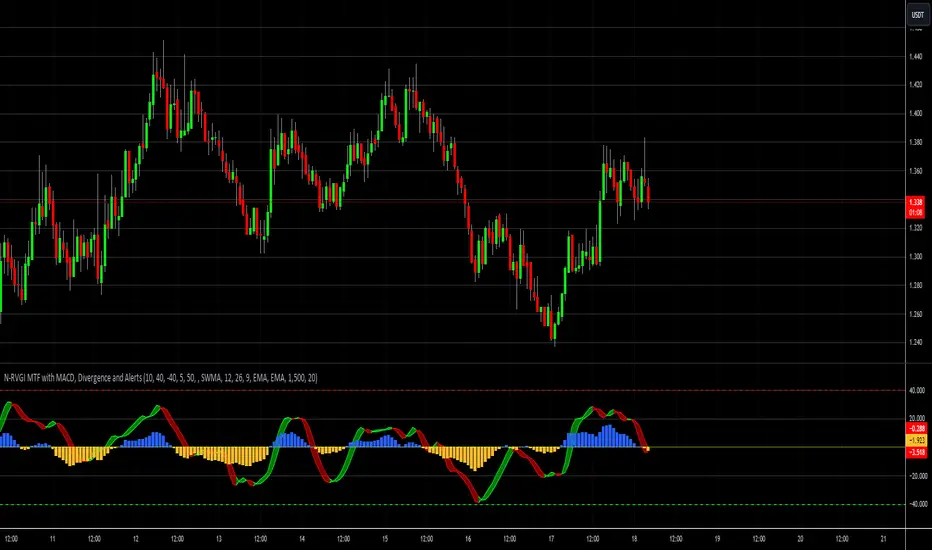
This advanced indicator integrates the Normalized Relative Vigor Index (RVGI) with Multi-Timeframe (MTF) analysis, MACD, divergence detection, and customizable alert features. It provides a comprehensive toolkit for traders to analyze market momentum, identify trend changes, and react to significant technical signals.
Key Features:
Normalized Relative Vigor Index (RVGI):
Calculation: Computes the RVGI and its signal line using various smoothing methods (SWMA, EMA, SMA). The RVGI measures the strength of price movement relative to its historical volatility, providing insights into market momentum.
Plotting: Visualizes the RVGI and signal line on the chart. Users can customize the colors and transparency of the plots and the ribbon that fills the area between them.
Overbought/Oversold Levels: Displays horizontal lines to mark overbought and oversold zones, helping to identify potential reversal points.
Multi-Timeframe (MTF) Analysis:
Timeframe Selection: Allows users to select different timeframes for RVGI analysis, providing a broader perspective on market trends and signals.
Integration: Combines MTF data with the main indicator calculations to offer a more comprehensive view of market conditions.
MACD Integration:
Calculation: Computes MACD, MACD signal line, and MACD histogram with options for different moving average types (SMA, EMA) and a customizable scaling factor.
Plotting: Plots the MACD histogram, zero line, and signal line, with color and transparency settings to distinguish between positive and negative values.
Divergence Detection:
Bullish Divergence: Identifies and plots bullish divergence when the price makes a lower low while the RVGI makes a higher low, suggesting potential upward reversals.
Bearish Divergence: Identifies and plots bearish divergence when the price makes a higher high while the RVGI makes a lower high, indicating potential downward reversals.
Alerts:
Divergence Alerts: Configurable alerts for bullish and bearish divergences, notifying traders of significant potential reversals.
RVGI Alerts: Alerts for RVGI crossovers, overbought/oversold conditions, and trend changes based on RVGI and signal line crossovers.
MACD Alerts: Alerts for MACD line crossovers, histogram crossovers, and MACD zero line crossovers, helping traders stay informed of key MACD signals.
Customization Options:
Ribbon Colors and Transparency: Users can adjust the colors and transparency of the RVGI ribbon, enhancing visual clarity.
MACD Histogram Colors and Transparency: Customizable colors and transparency settings for the MACD histogram improve visibility and differentiation of positive and negative values.
Smoothing Methods: Choose between different smoothing methods for RVGI, tailoring the indicator to specific trading strategies.
Use Cases:
Trend Analysis: Utilize RVGI and MACD signals to analyze market trends, identify potential trend reversals, and assess momentum.
Divergence Identification: Detect and act on divergences between price and RVGI to spot potential trading opportunities.
Alert Management: Customize and receive alerts based on various conditions, ensuring timely responses to market signals.
Conclusion:
This indicator is designed for traders who seek a comprehensive tool combining momentum analysis, divergence detection, and signal alerts. By integrating RVGI, MACD, and MTF analysis, it provides a powerful suite of features to enhance market analysis and trading decisions
Release Notes
Normalized Relative Vigor Index (N-RVGI) [MTF] with MACD, Divergence, and AlertsDescription: The Billware Normalized Relative Vigor Index (N-RVGI) is a comprehensive multi-timeframe (MTF) indicator designed to provide a robust analysis of market trends by combining the Relative Vigor Index (RVGI) with Moving Average Convergence Divergence (MACD) and divergence detection. This indicator offers dynamic scaling for MACD, advanced visualization, and customizable alerts to assist traders in identifying trend changes, divergences, and key trading signals.
Key Features:
Normalized RVGI:
Multi-Timeframe Analysis: Provides RVGI values and signals for different timeframes, enabling a broader view of market conditions.
Dynamic Scaling: Automatically scales MACD values based on the dynamic range of recent data to ensure optimal visualization and interpretation.
MACD Integration:
MACD Histogram: Visualizes the difference between the MACD line and the signal line, with customizable colors and transparency.
Divergence Detection:
Bullish and Bearish Divergences: Identifies bullish and bearish divergences between price and RVGI, signaling potential trend reversals.
Customizable Lookback Period: Allows users to adjust the lookback period for divergence detection.
Alerts:
Divergence Alerts: Notifies when bullish or bearish divergences are detected.
RVGI Crossover Alerts: Alerts on crossovers between RVGI and its signal line.
Overbought/Oversold Alerts: Triggers alerts when RVGI moves into overbought or oversold zones.
MACD Alerts: Includes alerts for MACD line crossovers, histogram signals, and zero line crossovers.
Customizable Visualization:
Ribbon and Signal Colors: Users can choose colors for the RVGI ribbon and signal line, and apply transparency for better visual clarity.
Adjustable Levels: Includes overbought and oversold levels with customizable thresholds.
Advanced Smoothing Options:
Signal Smoothing: Select from SWMA, EMA, or SMA for smoothing the RVGI signal line.
Benefits:
- Provides a comprehensive view of market trends through the combination of RVGI and MACD.
- Detects key trading signals with built-in divergence analysis.
- Offers flexibility with customizable alerts and visual settings to fit various trading strategies.
- This indicator is ideal for traders seeking a detailed and adaptable tool for market analysis, trend detection, and signal generation.
Release Notes
Automated MACD sizing and transparency.Protected script
This script is published as closed-source. However, you can use it freely and without any limitations – learn more here.
Disclaimer
The information and publications are not meant to be, and do not constitute, financial, investment, trading, or other types of advice or recommendations supplied or endorsed by TradingView. Read more in the Terms of Use.
Protected script
This script is published as closed-source. However, you can use it freely and without any limitations – learn more here.
Disclaimer
The information and publications are not meant to be, and do not constitute, financial, investment, trading, or other types of advice or recommendations supplied or endorsed by TradingView. Read more in the Terms of Use.