PROTECTED SOURCE SCRIPT
Updated Buy/Sell Volume Details
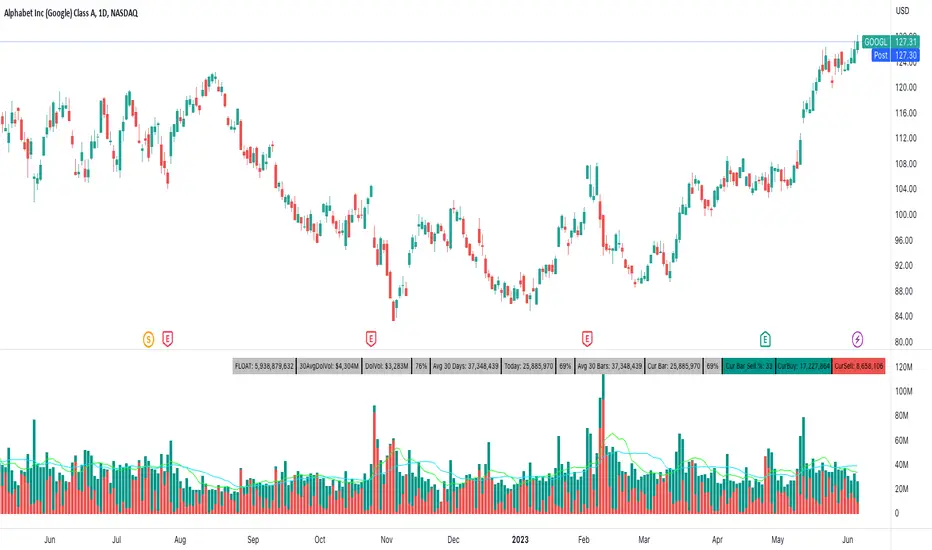
This attempts to color buy and sell volume of each bar.
In addition to coloring the bars, the table shows average volumes for the past 30 days, current volume for the day, current bar volume, the float of the ticker, and dollar volume for the day and average 30 days. You can also plot a fast and slow moving average of volume.
In addition to coloring the bars, the table shows average volumes for the past 30 days, current volume for the day, current bar volume, the float of the ticker, and dollar volume for the day and average 30 days. You can also plot a fast and slow moving average of volume.
Release Notes
- Enhanced the code to be. more efficient when calculating the averages
- Added the ability to select the look back period. The default is 30 days but you can now change how far back you want the averages to take into account.
Release Notes
- Added buy and sell volume cells that can be toggled on/off
Protected script
This script is published as closed-source. However, you can use it freely and without any limitations – learn more here.
Disclaimer
The information and publications are not meant to be, and do not constitute, financial, investment, trading, or other types of advice or recommendations supplied or endorsed by TradingView. Read more in the Terms of Use.